FOCAS Adapter Script Configuration
This page covers the FOCAS-specific data sources an adapter script can read. For adapter script syntax itself — variables, operations, expressions — see the Adapter Scripts reference.
Adapter Script Configuration
Macro Variables
Macro variables provide access to custom data stored in the control.
Common Use Cases:
- Custom part counters
- Process parameters
- Quality measurements
- Tool life tracking
- Automation status
Basic Configuration Example:
{
  "macros": {
    "custom_part_count": 510,
    "tool_life_remaining": 520,
    "temperature_setpoint": 530
  }
}
With Path Specification:
For multi-path machines or specific path targeting:
{
  "macros": {
    "X1_Wear_1": 2001,
    "X1_Wear_2": {
      "addr": 2002,
      "path": [1]
    },
    "X1_Wear_3": {
      "addr": 2003,
      "path": [1]
    }
  }
}
Data Mapping: Map each macro to appropriate type:
- Part counts → Part Count / Target or Actual
- Measurements → Sample / (appropriate subtype)
- Status → Event or Condition
PMC (Programmable Machine Control)
PMC allows direct access to PLC inputs and outputs within the FANUC control.
What is PMC?
- PMC is FANUC's built-in PLC functionality
- X-addresses = Inputs (from machine sensors, switches, relays)
- Y-addresses = Outputs (to machine actuators, lights, relays)
- Used for machine logic, interlocks, and automation
Common Use Cases:
- Door interlocks
- Collet open/close status
- Chuck clamp/unclamp status
- Bar feeder status
- Coolant status
- Stack lights
- Key switches
- Air cut status
- One-cycle mode
Configuration Example:
⚠️ IMPORTANT: The addresses below are examples only. PMC addresses vary by machine model and machine tool builder. You must find the correct addresses for your specific machine in the machine manual or PMC ladder diagram.
{
  "pmc": {
    "X5_0_MAIN_COLLET_OPEN": "X5.0",
    "X5_1_MAIN_SP_CLAMP": "X5.1",
    "X5_2_MAIN_SP_UNCLAMP": "X5.2",
    "X5_3_CUT_OFF_TOOL_OFF": "X5.3",
    "X5_4_CUT_OFF_TOOL_ON": "X5.4",
    "X9_1_DOOR_INTLOCK_MAIN": "X9.1",
    "X7_0_BAR_STOCK_EMPTY": "X7.0",
    "X7_3_BAR_FEED_READY": "X7.3",
    "X47_6_KEY_SWITCH": "X47.6",
    "Y53_5_ONE_CYCLE": "Y53.5",
    "Y53_1_AUTO_CUT_OFF": "Y53.1",
    "Y53_2_AIR_CUT": "Y53.2",
    "Y52_3_MACRO_BUTTON": "Y52.3"
  }
}
Finding PMC Addresses:
-
Access PMC Diagnosis
- Press SYSTEM → PMC → DIAGNOS
- Shows real-time X (inputs) and Y (outputs)
-
Identify Address
- Watch PMC screen while activating machine function
- Example: Open door → watch for bit that changes
- Note the address (e.g., X9.1 for door interlock)
-
Name Descriptively
- Use clear, descriptive names
- Include location if multi-spindle (e.g., MAIN, SUB)
- Document what triggers the signal
Data Mapping:
- Binary signals (0 or 1)
- Map to Event type in MachineMetrics
- Use for automation triggers, alerts, or dashboards
Here's an example of a fully configured PMC adapter in MachineMetrics, with the JSON showing G/Y/F addresses:
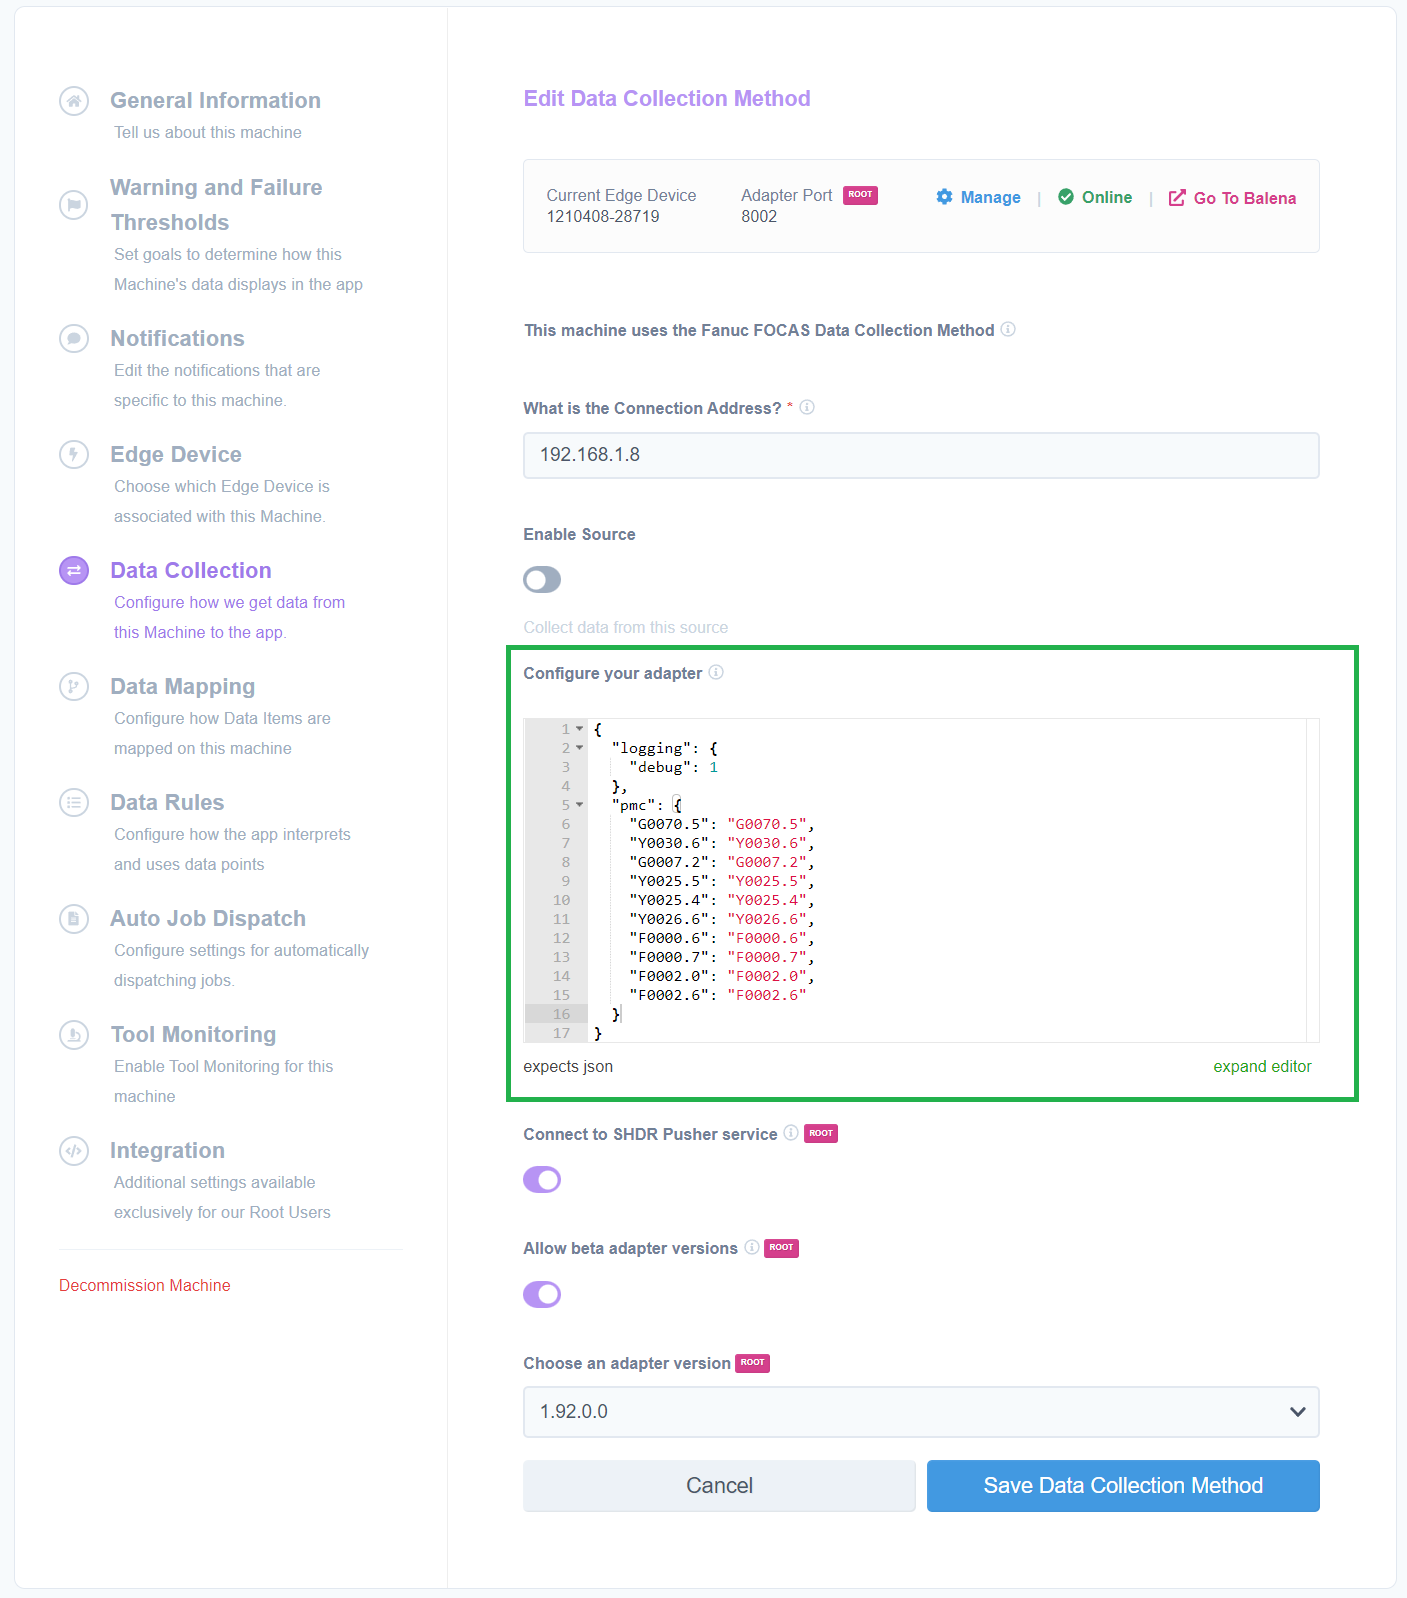
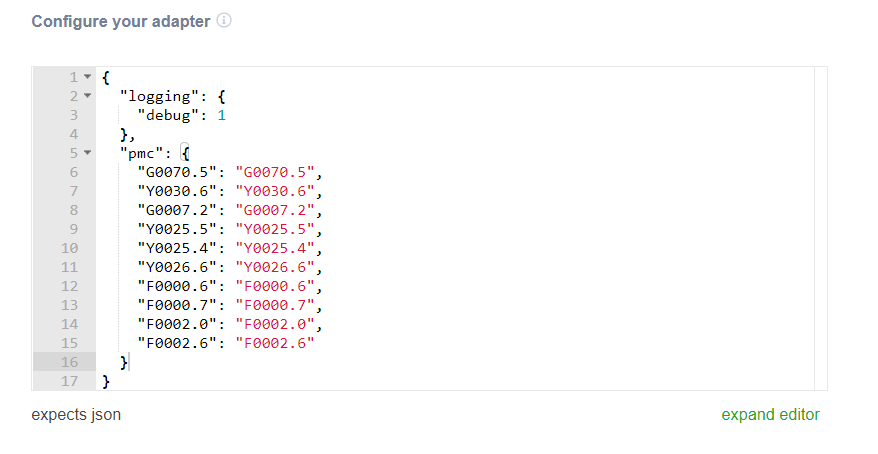
After saving, go to Data Mapping to configure each PMC signal. Click any data item to open the Edit dialog:
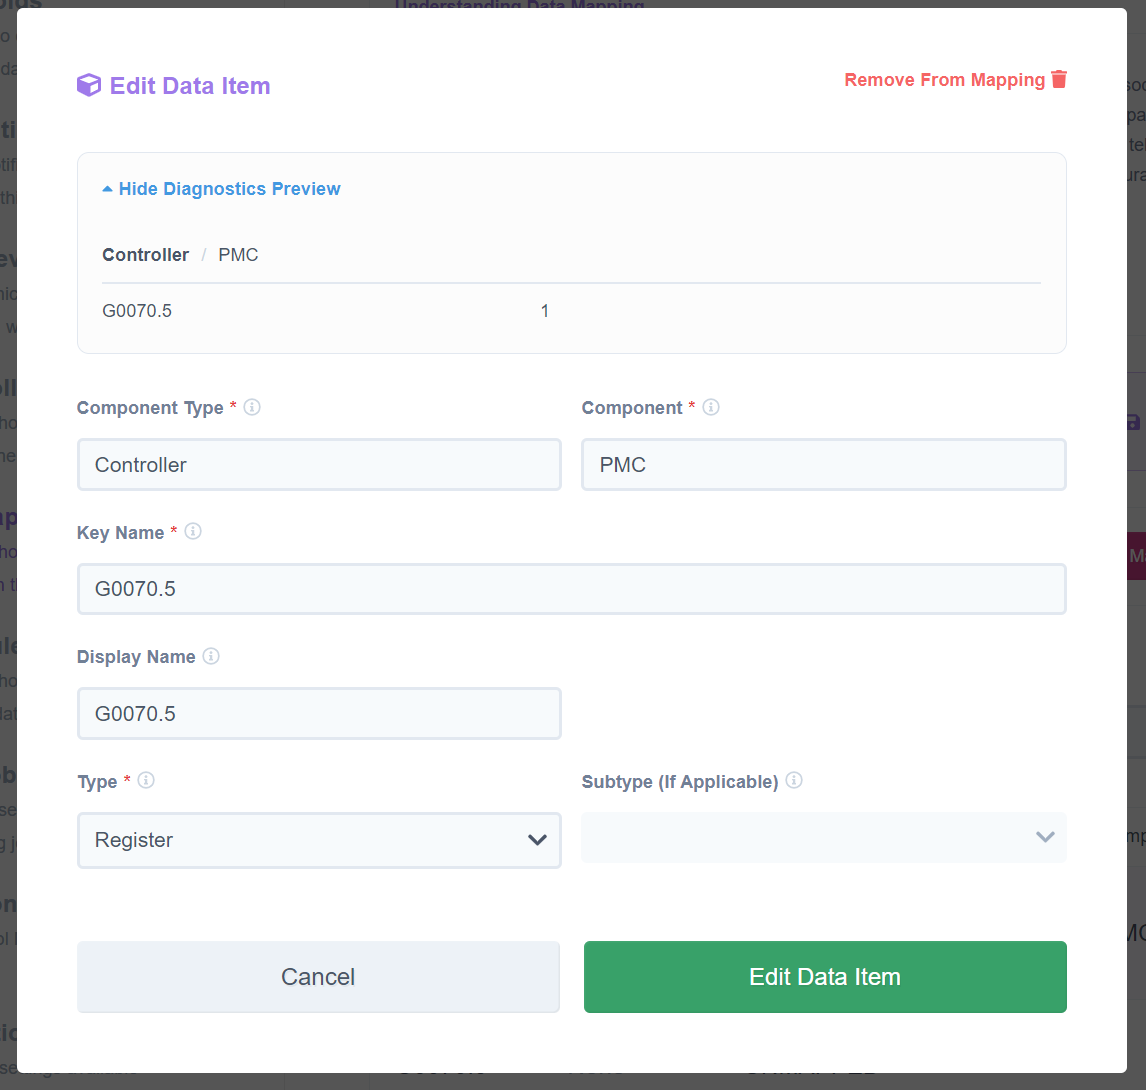
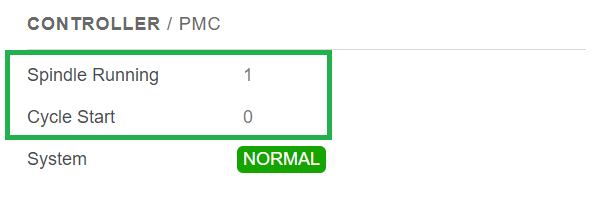
Use the Diagnostics Preview panel to verify signal values in real time:

PMC Data Types and Address Formats
PMC registers support three configuration patterns depending on whether you need the full byte, a single bit, or a specific multi-byte data type.
| Pattern | Description | Example key/value |
|---|---|---|
| Address string | Default data type is BYTE — monitors the entire byte at the register address | "G54": "G54" |
Bit notation (Gxxxx.N) | Monitors a single bit within a register; the .N suffix selects bit N | "G0070.5": "G0070.5" |
| Extended JSON object | Specifies an explicit data type (BYTE, WORD, or DWORD) using address and dtype keys | "D124": { "address": "D124", "dtype": "DWORD" } |
Valid dtype values: BYTE, WORD, DWORD
- Monitoring the entire byte at a PMC register address — When a PMC register is configured with a plain address string, the default data type is BYTE. The adapter reads and reports the full byte value at that register. Example:
"G54": "G54"tracks the byte value at G54. - Monitoring an individual bit in a PMC register — The
Gxxxx.Nnotation targets bit N within the register. Example:"G0070.5": "G0070.5"tracks and reports the 5th bit of register G0070. - Monitoring a PMC register with a specified data type — To read D-addresses or any multi-byte register (WORD or DWORD), use the extended JSON object form with
addressanddtypekeys. Example:"D124": { "address": "D124", "dtype": "DWORD" }.
Example adapter JSON combining all three patterns:
{
  "pmc": {
    "G54": "G54",
    "G0070.5": "G0070.5",
    "D124": { "address": "D124", "dtype": "DWORD" }
  }
}
Use the extended JSON object form ({ "address": "...", "dtype": "..." }) whenever you need to monitor D-addresses or any multi-byte register. Plain address strings always default to BYTE.
P-Codes (Machine Builder Data Table)
P-codes provide access to data stored by machine tool builders in FANUC controls.
What are P-Codes?
- P-codes are a table where machine tool builders store their custom information
- Machine-specific: P-code addresses vary by machine make, model, and control
- Not standardized: Never assume P-code addresses are the same across different FANUC machines
- Used by OEMs to store custom data relevant to their machine design
Common MachineMetrics Use Case: Tool Life Tracking
While P-codes can store any machine builder data, MachineMetrics most commonly uses them to track tool life management (TLM) data.
⚠️ IMPORTANT: P-code addresses for tool life are machine-specific. You must discover the addresses for each machine using the procedure below.
How to Discover P-Code Addresses for Tool Life
Follow these steps to identify which P-code addresses contain tool life data on your specific machine:
Step 1: Enable Parameter Write (PWE)
- See Enabling Parameter Write for instructions
- Enable PWE to allow parameter changes
Step 2: Set Parameter 9000#1 (NDP) = 1
- Press SYSTEM button
- Navigate to Parameters
- Search for parameter 9000
- Set bit #1 (NDP) = 1
- This enables P-code variable display
Step 3: Access Macro Screen
- Press OFFSET hard key
- Press Macro screen key
- Press EXEC screen key
- You should now see P-code variables
Step 4: Output P-Code Variables to USB
- Press OPRT menu key
- Select Output or Punch
- Set I/O channel:
- 17 for USB
- 4 for Memory Card
- Specify output file name (e.g.,
PCODE.TXT) - Execute output
- P-code variables will be saved to USB/card
Step 5: Restore Settings
- Set parameter 9000#1 back to 0
- Turn off PWE (see Parameter Safety)
Step 6: Take Photo of TLM Screen
- On the CNC control, navigate to the Tool Life Management (TLM) screen
- Take a clear photo showing:
- Tool group numbers
- Tool life preset values
- Tool life count/remaining values
- Note which tools are in use and their current counts
Step 7: Match Values on PC/Mac
- Open the P-code output file from USB on your computer
- Search for the values from the TLM screen photo
- Look for clusters of values that match TLM data
- P-code addresses for related TLM data will be close together
- Document the addresses:
- Which P-codes = Tool Life Preset
- Which P-codes = Tool Life Count
- Which tool groups they correspond to
Example:
If you see on TLM screen:
- Tool Group 1: Preset = 500, Count = 350
- Tool Group 2: Preset = 1000, Count = 750
Search P-code file for 500 and 350 (should be near each other), and 1000 and 750.
You might find:
- P-code 12101 = 500 (Tool 1 Preset)
- P-code 12201 = 350 (Tool 1 Count)
- P-code 12102 = 1000 (Tool 2 Preset)
- P-code 12202 = 750 (Tool 2 Count)
Configuration Example
Once you've identified P-code addresses, configure them in MachineMetrics:
{
  "pcodes": {
    "TLM_1_PRESET": {
      "addr": 12101,
      "path": [1]
    },
    "TLM_1_COUNT": 12201,
    "TLM_2_PRESET": 12102,
    "TLM_2_COUNT": 12202,
    "TLM_3_PRESET": 12103,
    "TLM_3_COUNT": 12203,
    "TLM_4_PRESET": 12104,
    "TLM_4_COUNT": 12204,
    "TLM_5_PRESET": 12105,
    "TLM_5_COUNT": 12205
  }
}
Replace the addresses (12101, 12201, etc.) with the addresses discovered from your specific machine.
Other P-Code Use Cases
Beyond tool life, P-codes may contain:
- Custom part counters
- Machine-specific process parameters
- OEM-specific automation data
- Pallet changer status
- Bar feeder information
- Custom measurements or setpoints
To discover what data is in P-codes:
- Use the same procedure above
- Cross-reference P-code values with machine displays
- Consult machine builder documentation
- Contact machine OEM for P-code map
Data Mapping in MachineMetrics
For Tool Life:
- Preset values → Map to Target or Setpoint
- Count/Remaining values → Map to Actual or Sample
- Can calculate remaining life (Preset - Count)
For Other Data:
- Map to appropriate type based on data purpose
- Use descriptive names in JSON configuration
- Document what each P-code represents
Complete Advanced JSON Example
Here's a comprehensive example combining PMC, P-codes, and macros for a multi-spindle lathe with tool life management:
⚠️ IMPORTANT: These addresses are examples only. PMC addresses, P-codes, and macro numbers vary by machine model and machine tool builder. You must find the correct addresses for your specific machine in the machine manual or PMC ladder diagram.
{
  "pmc": {
    "X5_0_MAIN_COLLET_OPEN": "X5.0",
    "X5_1_MAIN_SP_CLAMP": "X5.1",
    "X5_2_MAIN_SP_UNCLAMP": "X5.2",
    "X5_3_CUT_OFF_TOOL_OFF": "X5.3",
    "X5_4_CUT_OFF_TOOL_ON": "X5.4",
    "X9_1_DOOR_INTLOCK_MAIN": "X9.1",
    "X7_0_BAR_STOCK_EMPTY": "X7.0",
    "X7_3_BAR_FEED_READY": "X7.3",
    "X47_6_KEY_SWITCH": "X47.6",
    "Y53_5_ONE_CYCLE": "Y53.5",
    "Y53_1_AUTO_CUT_OFF": "Y53.1",
    "Y53_2_AIR_CUT": "Y53.2",
    "Y52_3_MACRO_BUTTON": "Y52.3"
  },
  "pcodes": {
    "TLM_1_PRESET": {
      "addr": 12101,
      "path": [1]
    },
    "TLM_1_COUNT": 12201,
    "TLM_2_PRESET": 12102,
    "TLM_2_COUNT": 12202,
    "TLM_3_PRESET": 12103,
    "TLM_3_COUNT": 12203,
    "TLM_4_PRESET": 12104,
    "TLM_4_COUNT": 12204,
    "TLM_5_PRESET": 12105,
    "TLM_5_COUNT": 12205,
    "TLM_6_PRESET": 12106,
    "TLM_6_COUNT": 12206,
    "TLM_7_PRESET": 12107,
    "TLM_7_COUNT": 12207,
    "TLM_8_PRESET": 12108,
    "TLM_8_COUNT": 12208,
    "TLM_9_PRESET": 12109,
    "TLM_9_COUNT": 12209,
    "TLM_10_PRESET": 12110,
    "TLM_10_COUNT": 12210
  },
  "macros": {
    "X1_Wear_1": 2001,
    "X1_Wear_2": {
      "addr": 2002,
      "path": [1]
    },
    "X1_Wear_3": {
      "addr": 2003,
      "path": [1]
    },
    "X1_Wear_4": {
      "addr": 2004,
      "path": [1]
    },
    "X1_Wear_5": {
      "addr": 2005,
      "path": [1]
    },
    "Z1_Wear_1": {
      "addr": 2101,
      "path": [1]
    },
    "Z1_Wear_2": {
      "addr": 2102,
      "path": [1]
    },
    "Z1_Wear_3": {
      "addr": 2103,
      "path": [1]
    },
    "Z1_Wear_4": {
      "addr": 2104,
      "path": [1]
    },
    "Z1_Wear_5": {
      "addr": 2105,
      "path": [1]
    },
    "X2_Wear_1": {
      "addr": 2001,
      "path": [2]
    },
    "X2_Wear_2": {
      "addr": 2002,
      "path": [2]
    },
    "X2_Wear_3": {
      "addr": 2003,
      "path": [2]
    },
    "X2_Wear_4": {
      "addr": 2004,
      "path": [2]
    },
    "X2_Wear_5": {
      "addr": 2005,
      "path": [2]
    },
    "Z2_Wear_1": {
      "addr": 2101,
      "path": [2]
    },
    "Z2_Wear_2": {
      "addr": 2102,
      "path": [2]
    },
    "Z2_Wear_3": {
      "addr": 2103,
      "path": [2]
    },
    "Z2_Wear_4": {
      "addr": 2104,
      "path": [2]
    },
    "Z2_Wear_5": {
      "addr": 2105,
      "path": [2]
    }
  }
}
This example demonstrates:
- PMC signals for machine status (collet, chuck, bar feeder, doors)
- P-codes for tool life management (10 tool groups)
- Macro variables for tool wear offsets (2 paths, 5 tools per axis)
- Path specification for multi-spindle machines
Configuration Steps:
-
Add JSON to Machine Configuration
- Assets → Machines → Select Machine → Edit
- Data Collection → Adapter Configuration
- Paste JSON into adapter script field
-
Save and Wait for Data Collection
- Save configuration
- Wait 1-2 minutes for data to appear
-
Map Data Items
- Assets → Machines → Data Mapping
- All new data items appear in left column
- Map each to appropriate type:
- PMC signals → Event
- P-code presets → Target
- P-code counts → Actual
- Macro wear values → Sample
-
Verify Data in Diagnostics
- Navigate to machine → Diagnostics tab
- Check that all configured items are reporting
- Verify values match control screen
Multi-Path Machines
Multi-path (multi-channel) machines have multiple independent machining processes.
Configuration:
{
  "macros": {
    "path1_parts": 501,
    "path2_parts": 502,
    "all_paths_status": { "addr": 600, "path": [-1] }
  }
}
Data Mapping:
- Path 2+ data items will have path number suffixed
- Example:
all_paths_status(path 1),all_paths_status2(path 2)
Components:
- Map data to correct path/spindle
- Path naming may not directly correspond (e.g., A12 in data vs A2 in UI)
- Use domain knowledge to match components correctly
Diagnostics Configuration
Common Diagnostics:
| Code | Description | Type |
|---|---|---|
| 200 | Servo Alarm Status | Bitfield |
| 308 | Servo Motor Temperature | Numeric (°C) |
| 309 | Pulsecoder Temperature | Numeric (°C) |
| 403 | Spindle Temperature | Numeric (°C) |
| 300 | Servo Load | Numeric (%) |
Configure diagnostics in the adapter JSON:
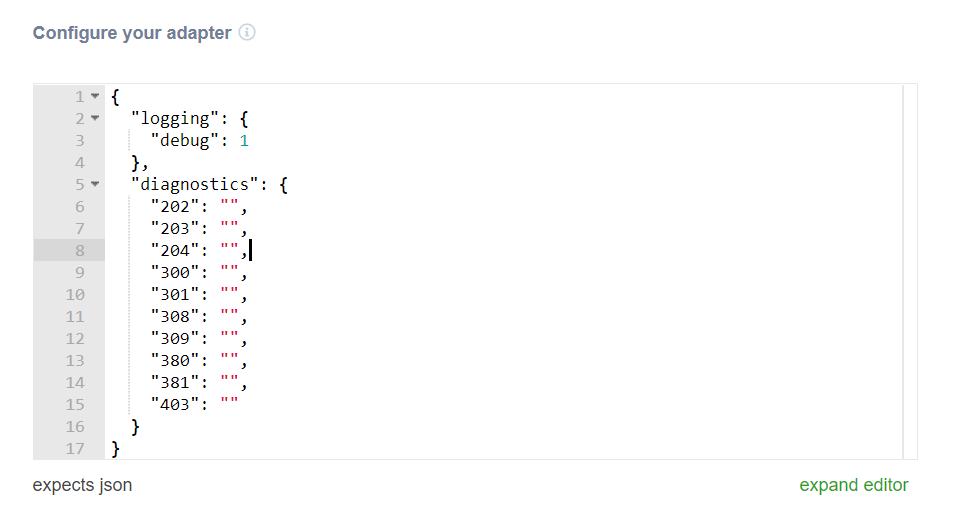
Bitfield Diagnostics:
- Some diagnostics encode multiple values in bits
- MachineMetrics automatically extracts each bit
- Example: Diag200Bit0_X, Diag200Bit1_X, etc.
Diagnostic Key Format:
Diag[Code]_[Axis/Spindle][Path]- Example:
Diag308_Z= Servo temp for Z axis - Example:
Diag403_S2= Spindle temp for spindle 2
After saving, go to Data Mapping and map each diagnostic item:
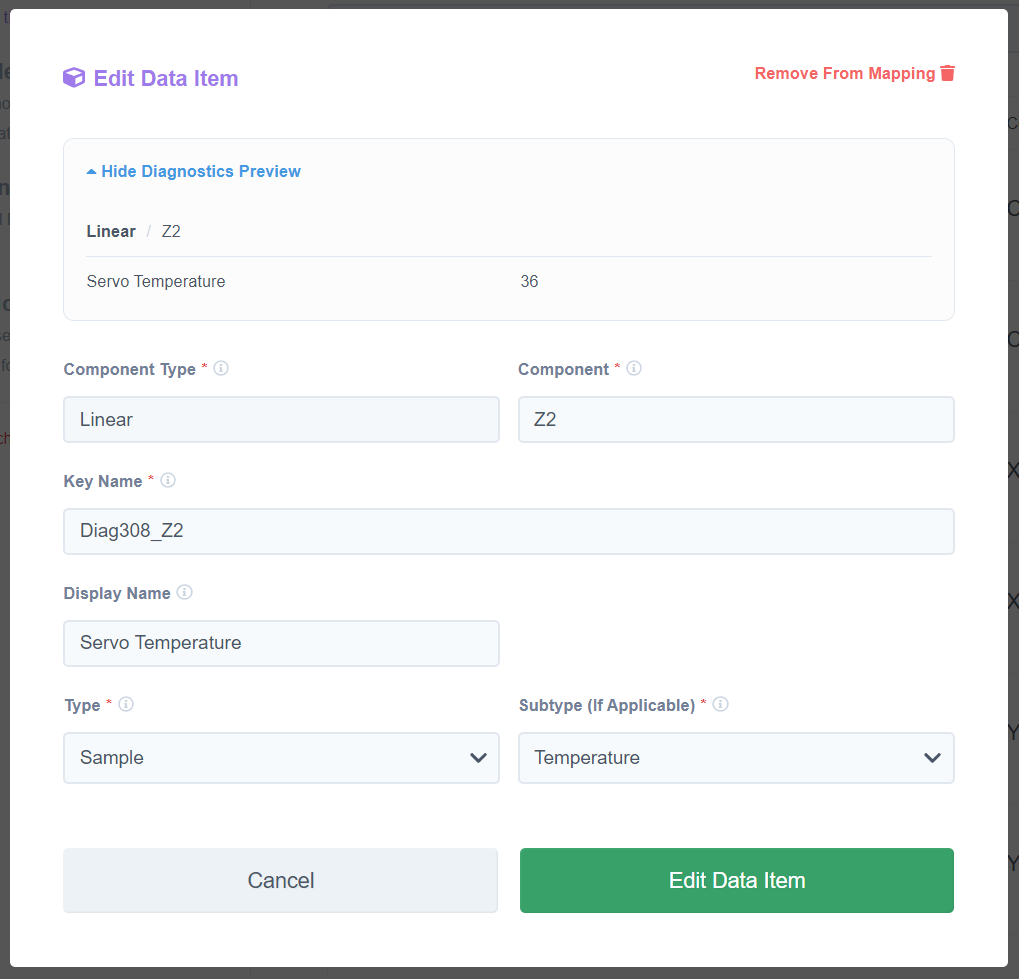
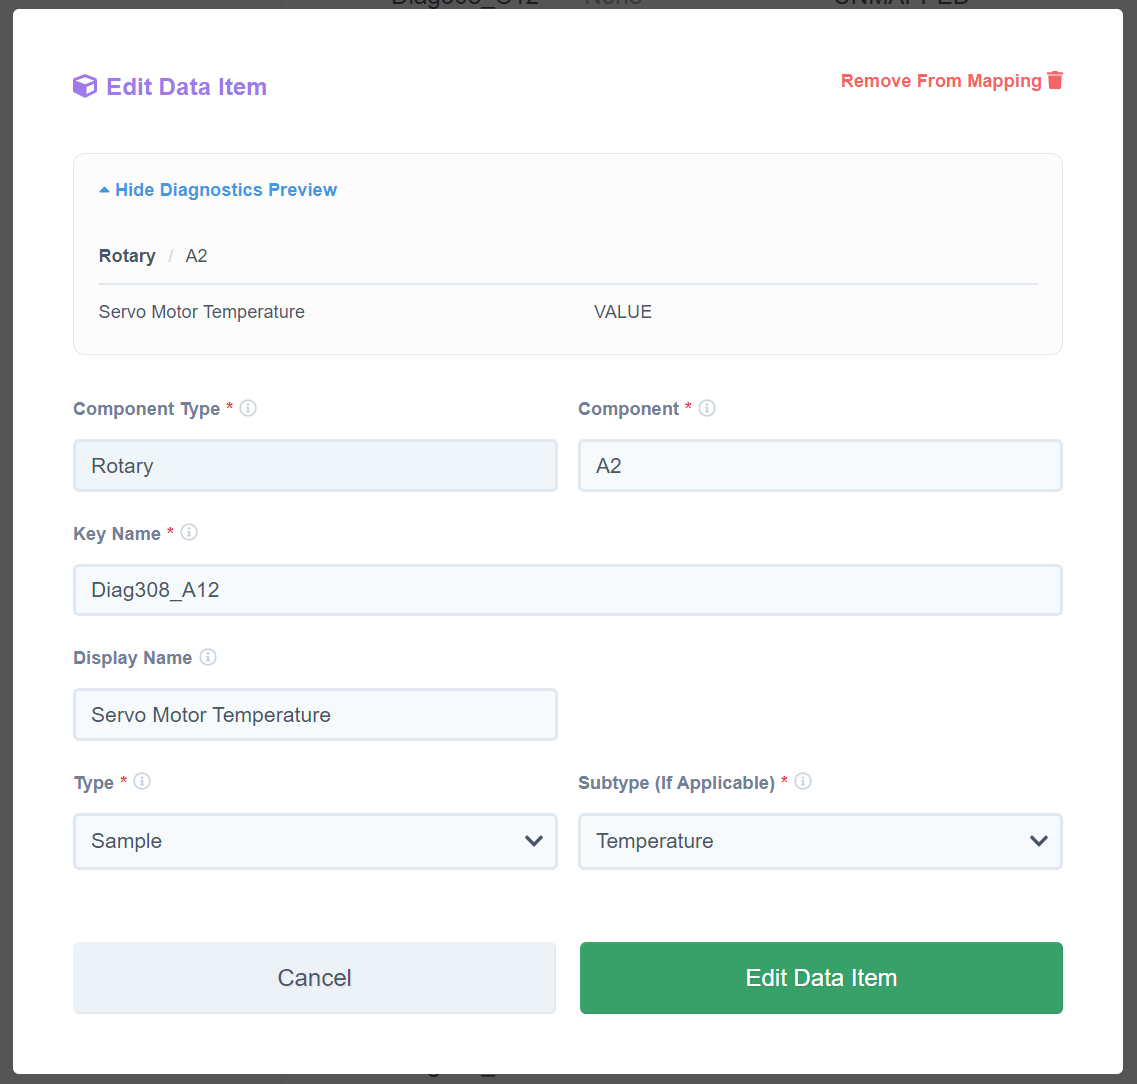
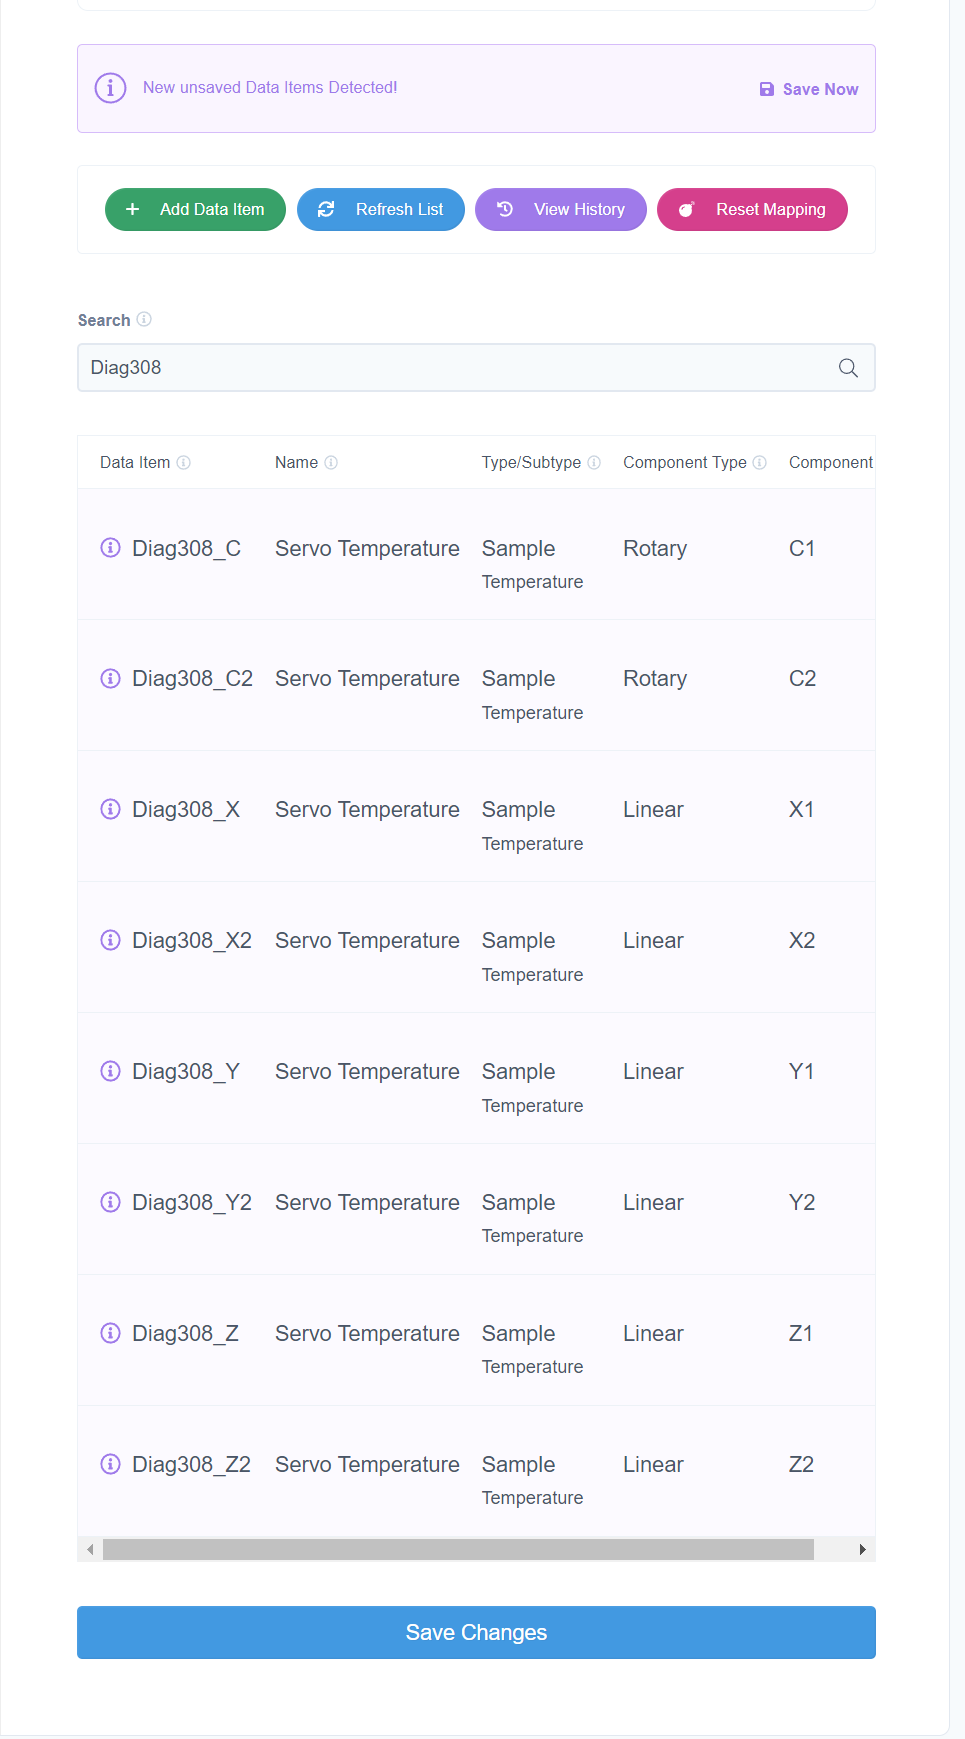
After mapping all axes, the Data Mapping list will show all Diag308 items per axis:
Live diagnostics view in MachineMetrics:
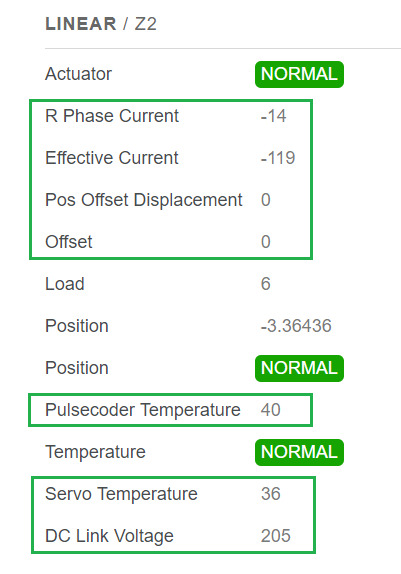
Mapping Tips:
- Use descriptive display names
- Map to correct Component/Subcomponent
- Pay attention to multi-path naming differences
- Refer to FANUC manuals for diagnostic code meanings
Tool Offsets
Tool offset configuration allows tracking of tool wear and compensation values.
Configuration in MachineMetrics:
- Edit machine → Data Collection
- Enable tool offset tracking
- Map tool data items
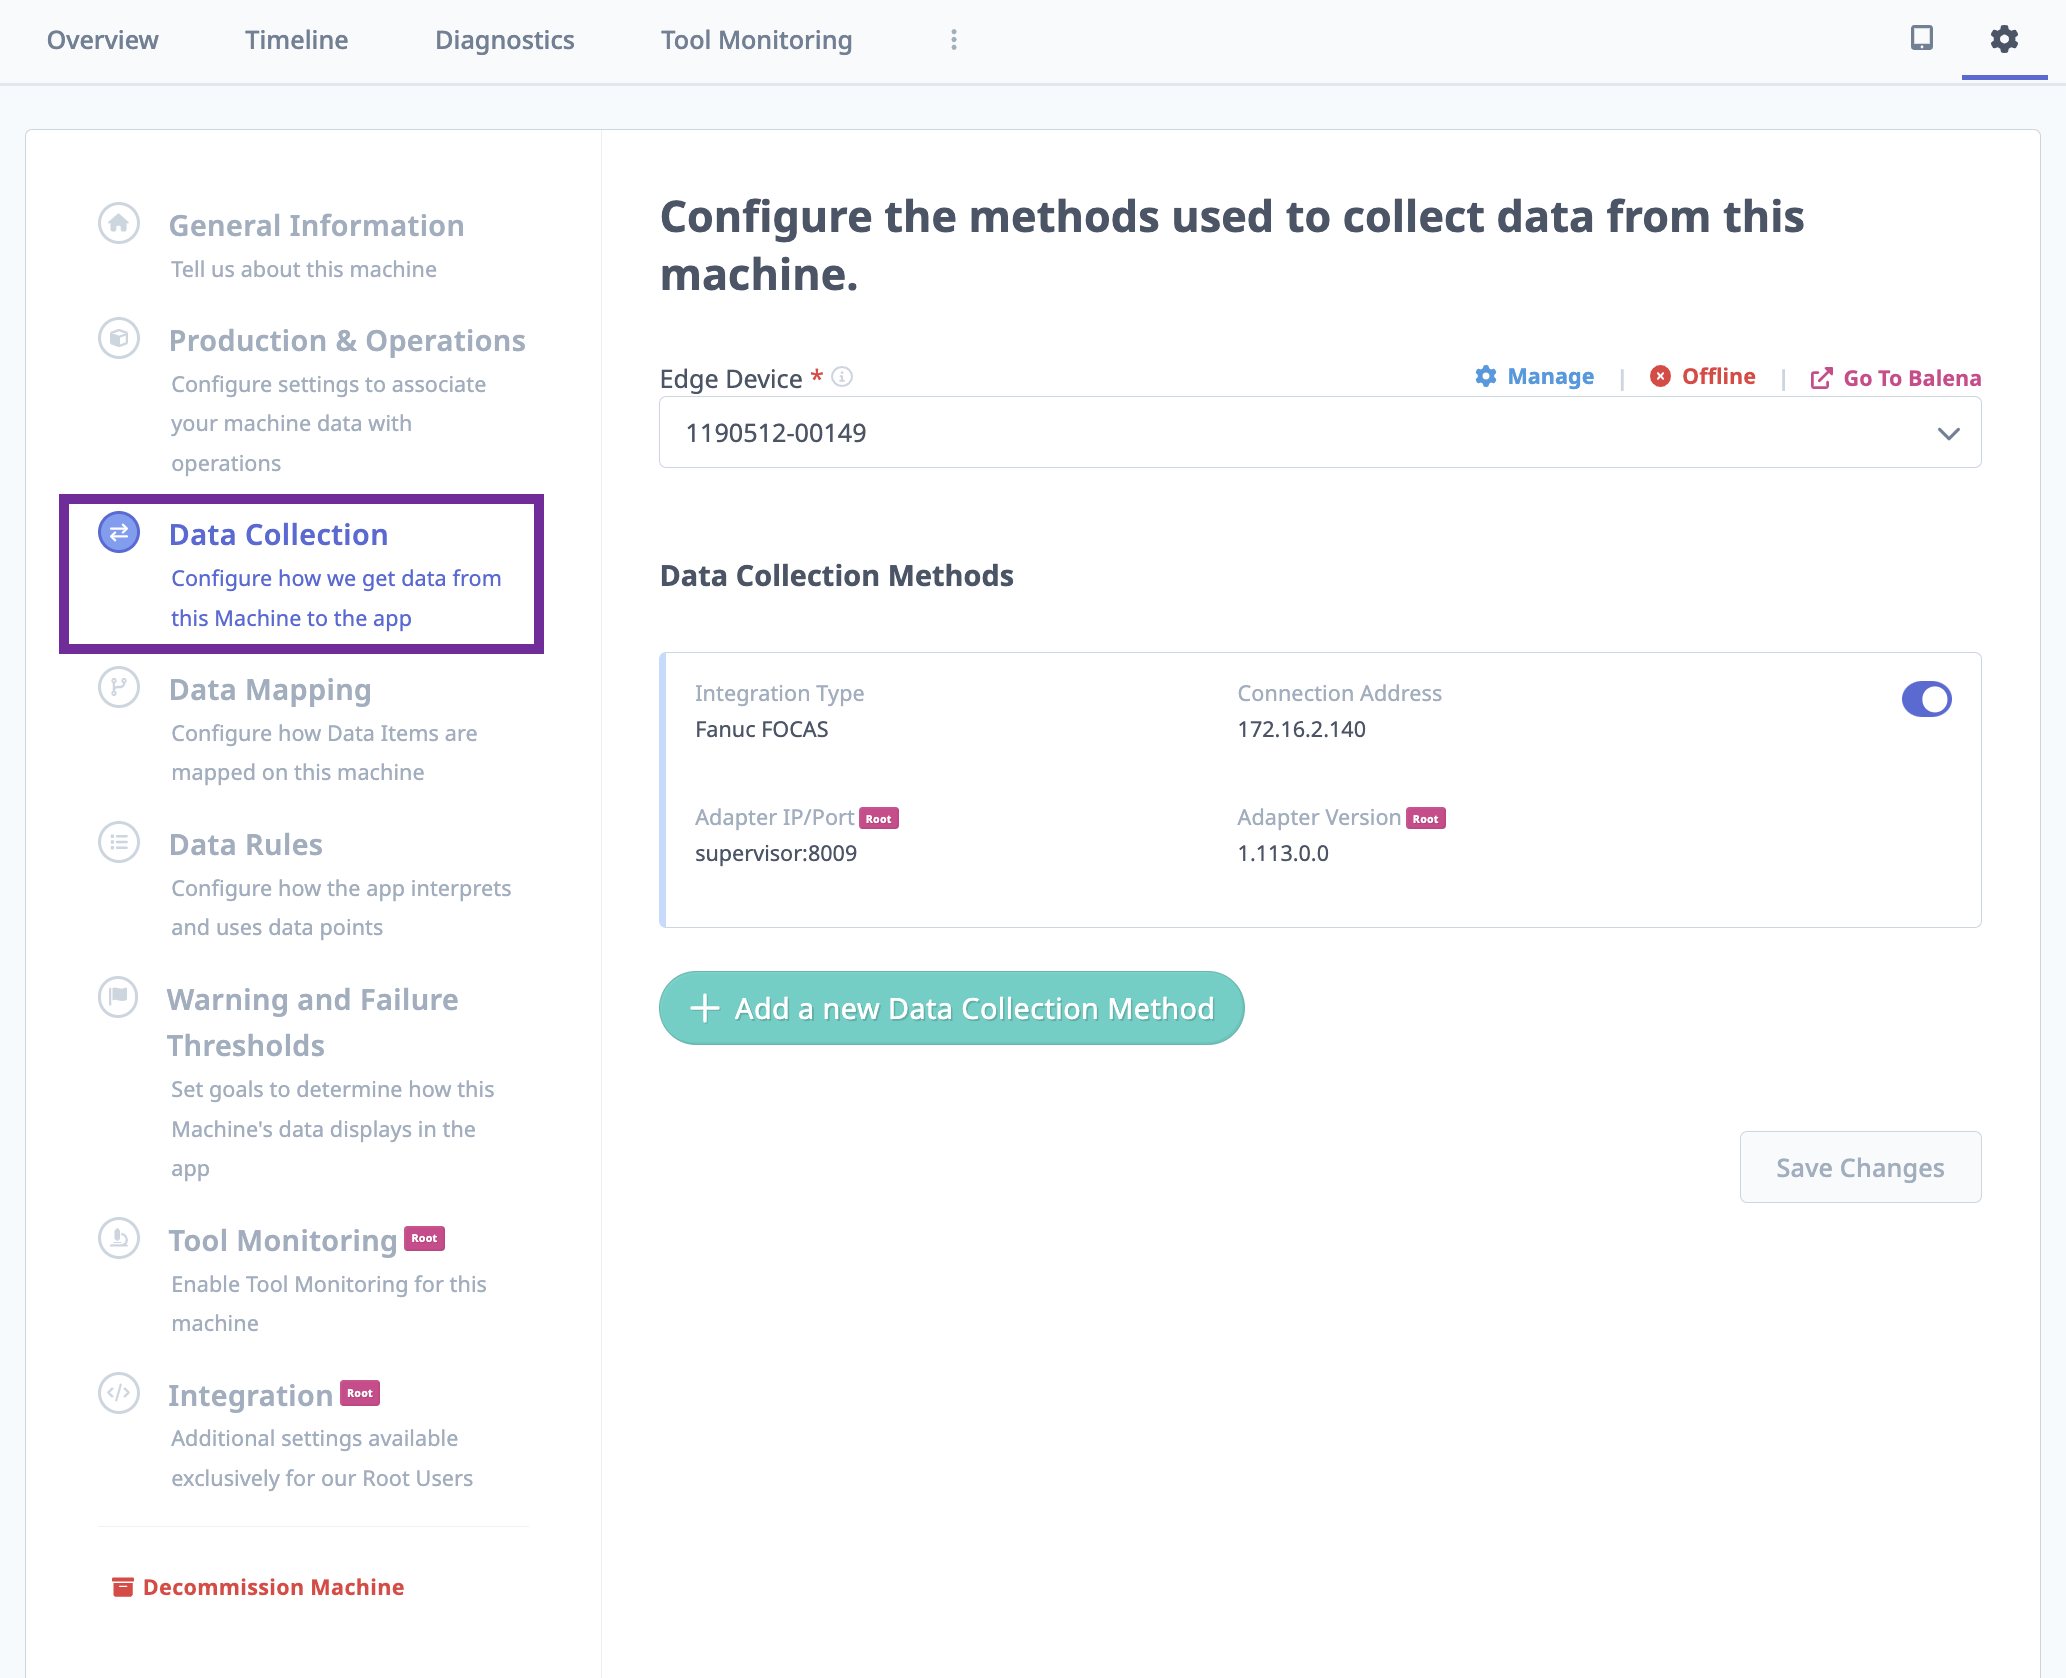
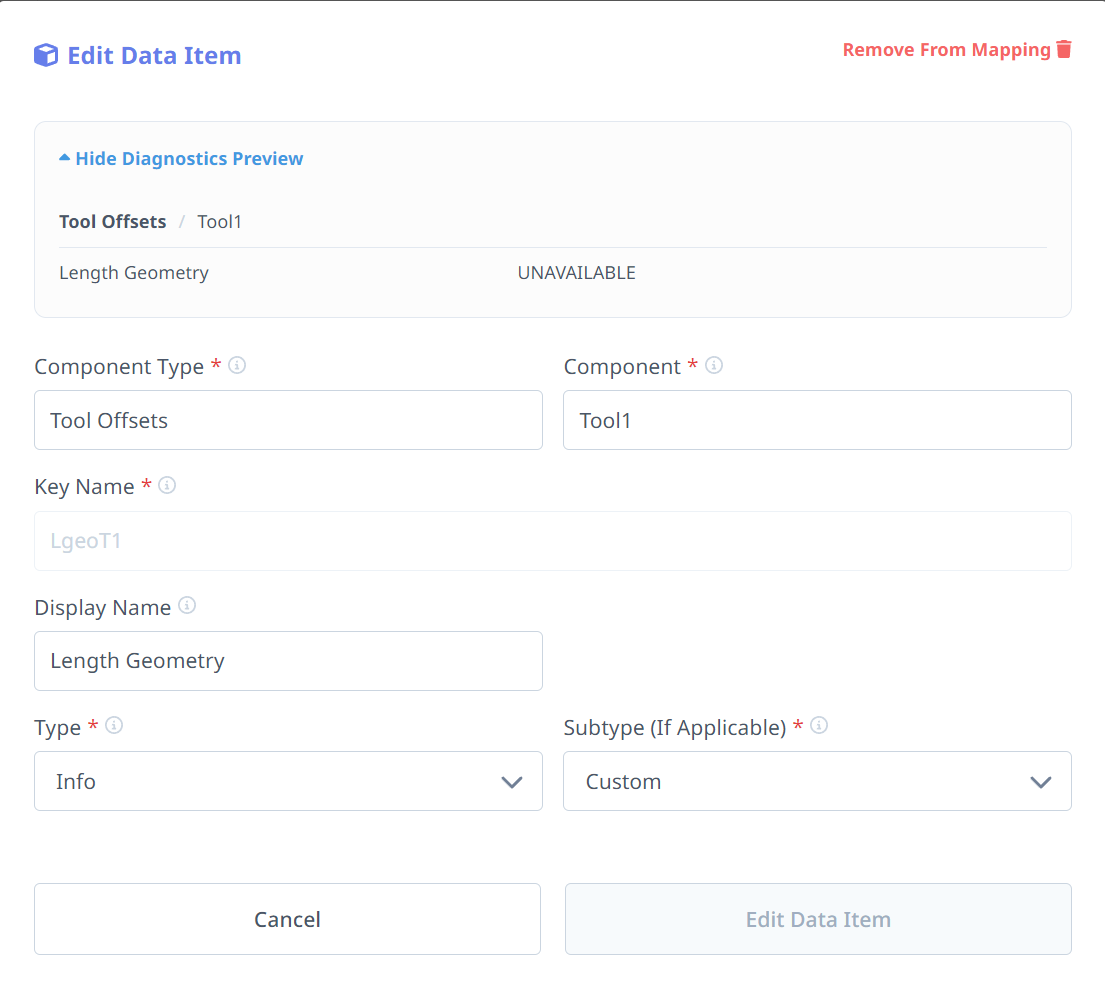
After refreshing the data items list, tool offset entries appear in Data Mapping. Open any item to configure:
Use Cases:
- Tool wear monitoring
- Predictive tool replacement
- Quality correlation with tool condition
Rapid Dial Address
For tracking feed/rapid override dial position:
Purpose: Display real-time override percentage in dashboards
Finding the Rapid Dial Address:
-
Access PMC Diagnosis
- Press SYSTEM → PMC → DIAGNOS
- This shows I/O monitor with X-addresses (inputs)
-
Search for Override Dial
- Press SEARCH → type
X0→ EXECUTE - Rotate rapid/feed-override dial slowly (0 → 25 → 50 → 75 → 100%)
- Watch for bits that flip when dial moves
- Press SEARCH → type
-
Identify the Address
- Note full address (e.g., X010 or X10)
- Confirm by rotating back and forth
- Only that X-word should toggle with dial
-
Map Each Position
- Record binary pattern for each detent
- Example: 0% = 0000, 25% = 0001, 50% = 0010, etc.
-
Contact MachineMetrics
- Provide X-address and mapping
- We'll configure dashboard to show correct percentage