System Settings Guide
- Profile
- Company
- Users
- Machine Groups
- Machine Schedules
- Activities
- Auto Setup
- Downtimes
- Quality
- Operators
- Operator Dashboard
- API Keys
- Integrations
- Single Sign-On
- Edge Management
Overview
What are System Settings?
System Settings is the central configuration area for MachineMetrics. This is where administrators configure company-wide settings, manage users, set up machine groups and schedules, configure downtime and quality categories, and integrate with external systems.
Key Capabilities:
- Configure user profiles and notification preferences
- Set company-wide defaults and goals
- Manage users and assign roles
- Organize machines into groups
- Define shift schedules
- Configure downtime and quality categories
- Manage operators and ShopPulse Interface settings
- Generate API keys for integrations
- Configure Single Sign-On (SSO)
Who Uses System Settings:
- IT Admins: Full access to all settings, including SSO and API keys
- Executives: Access to all settings
- Managers: Access to most settings, including user management
- Supervisors: Limited access (view only for most settings)
Accessing System Settings
Opening System Settings
Step-by-Step:
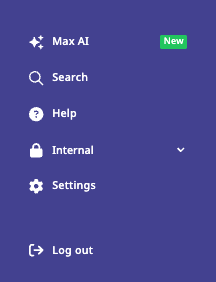
- Look at the bottom left corner of the MachineMetrics interface
- Click the gear icon (⚙️)
- Settings menu appears from the bottom of the screen
Settings Menu Structure: The left sidebar contains all settings categories:
- Profile
- Company
- Users
- Machine Groups
- Machine Schedules
- Activities
- Auto Setup
- Downtimes
- Quality
- Operators
- ShopPulse Interface
- API Keys
- Integrations
- Single Sign-On
- Edge Management
Profile Settings
What is Profile?
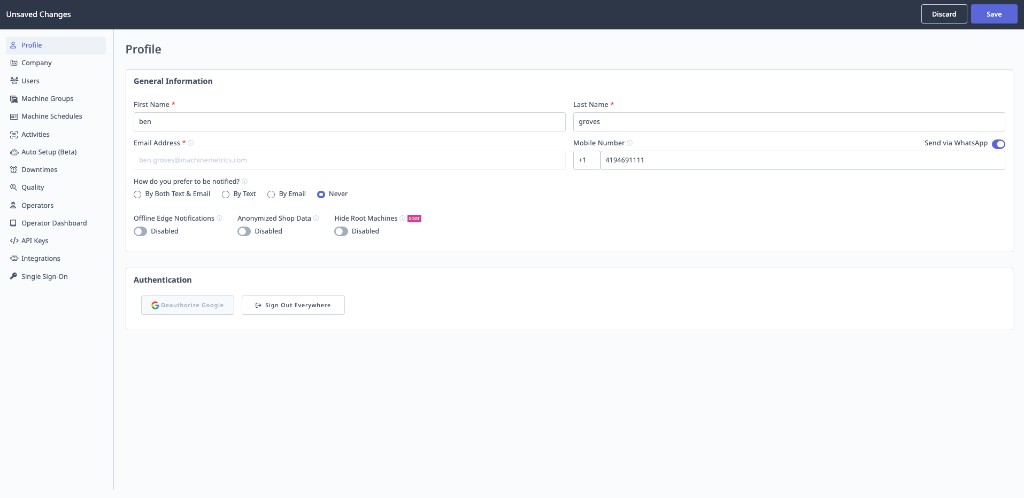
Profile contains your personal user settings, including notification preferences and working hours.
Access: Settings → Profile
Mobile Number
Purpose: Receive text or WhatsApp notifications from workflows and alerts.
Configuration:
- Enter your mobile number (with country code)
- Format:
+1-555-123-4567 - Toggle Send via WhatsApp to receive notifications through WhatsApp instead of SMS text
- Click Save
Use Case: Receive urgent alerts via text or WhatsApp when workflows trigger. If you prefer WhatsApp over SMS, enable the Send via WhatsApp toggle next to your mobile number — notifications will be delivered to the WhatsApp account associated with that number.
Notification Preferences
How You Prefer to Be Notified: Configure how workflows and alerts reach you.
Options:
- Email: Receive notifications via email only
- Text: Receive notifications via text message only
- Email and Text: Receive notifications via both methods
- Never: Do not receive notifications
Important: By default, notification preference is set to Never. If you're not receiving workflow notifications, check this setting first.
Configuration:
- Select preferred notification method from dropdown
- Click Save
Notification Schedule
Purpose: Specify when you want to receive notifications (avoid off-hours alerts).
Configuration:
- Click Add Schedule
- Select days of week (e.g., Monday - Friday)
- Set start time (e.g., 9:00 AM)
- Set end time (e.g., 5:00 PM)
- Click Save
Example:
Working Hours: Monday - Friday, 9:00 AM - 5:00 PM
Result: Notifications only sent during these hours
Multiple Schedules:
- Add multiple schedules for different days or shifts
- Example: Monday-Friday 9-5, Saturday 8-12
Override: Workflow creators can choose to override notification times for critical alerts (sent at any time regardless of your schedule).
Company Settings
What is Company Settings?
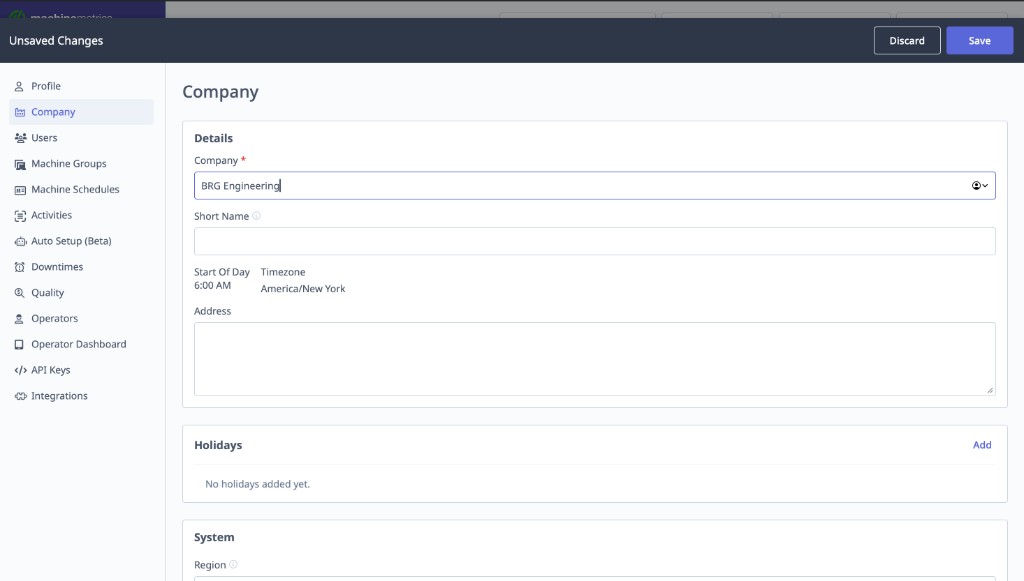
Company Settings contains system-wide defaults and preferences that apply to all users.
Access: Settings → Company
Who Can Edit: Managers, Executives, IT Admins
Start of Day and Timezone
Access: Settings → Company → Details
Start of day is the time your facility’s working day begins. This is one of the most impactful settings in MachineMetrics — it controls the First Active Time displayed throughout the application, including on machine cards, dashboards, and reports.
Important: The First Active Time shown on machine cards and dashboards is calculated from your Start of Day setting. If your Start of Day is set to 6:00 AM, the First Active Time for any given day will be the first moment a machine was active on or after 6:00 AM. Changing this setting will shift when “today” begins across the entire app.
MachineMetrics uses Start of Day as the boundary for all calendar-style periods — not midnight in your timezone.
Reports and historical metrics: Date ranges follow start of day → start of day. For example, if Start of day is 6:00 AM, a report for yesterday includes data from 6:00 AM yesterday through 6:00 AM today. Choosing last week or similar periods uses the same rule: each “day” in the range is your configured working day, not 12:00 AM–11:59 PM.
Live reporting: Views such as OEE and utilization for the current period also roll up from start of day forward, so intraday numbers match how your shop defines “today.”
Timezone: Set the timezone that matches your facility (e.g., America/New_York). Start-of-day boundaries and timestamps are interpreted in this timezone.
Start of Day and Timezone are configured by MachineMetrics — customers do not have access to change them. Although these values are visible under Settings → Company → Details, they are not customer-editable. To request a change to either setting, contact your Solution Delivery Manager (SDM).
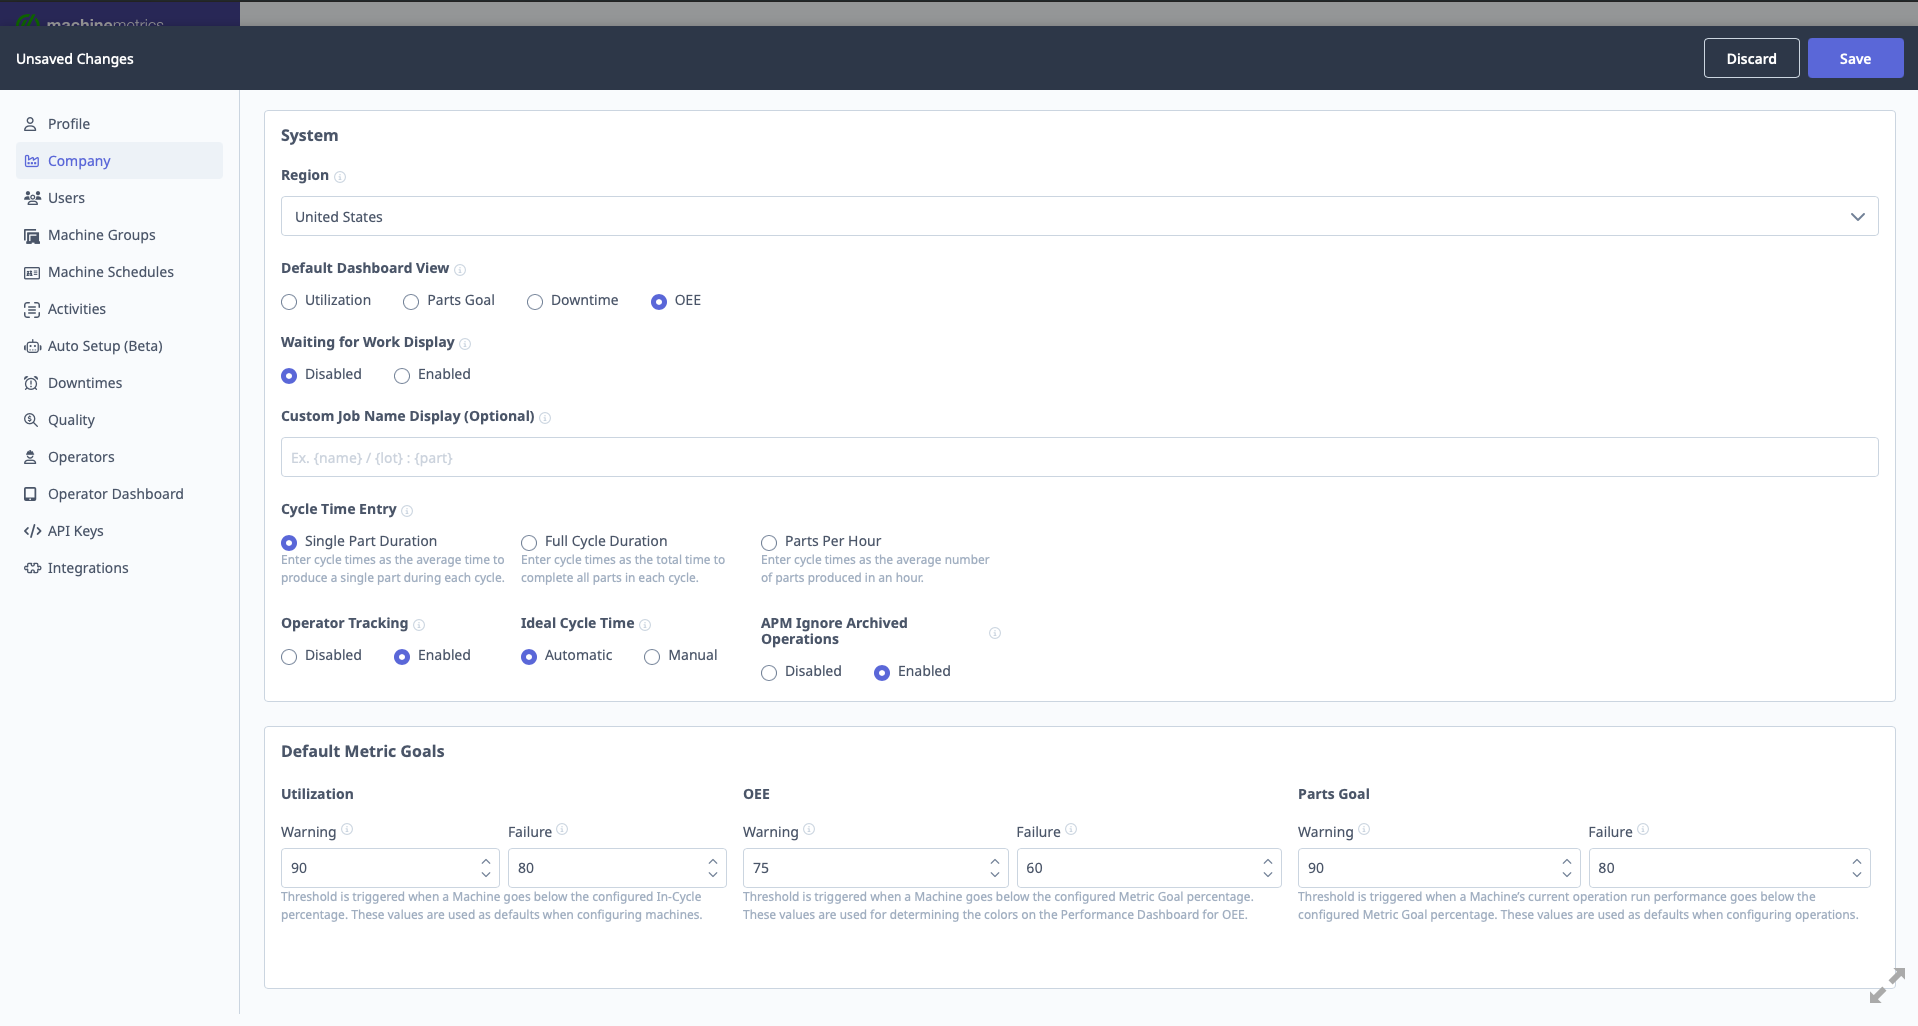
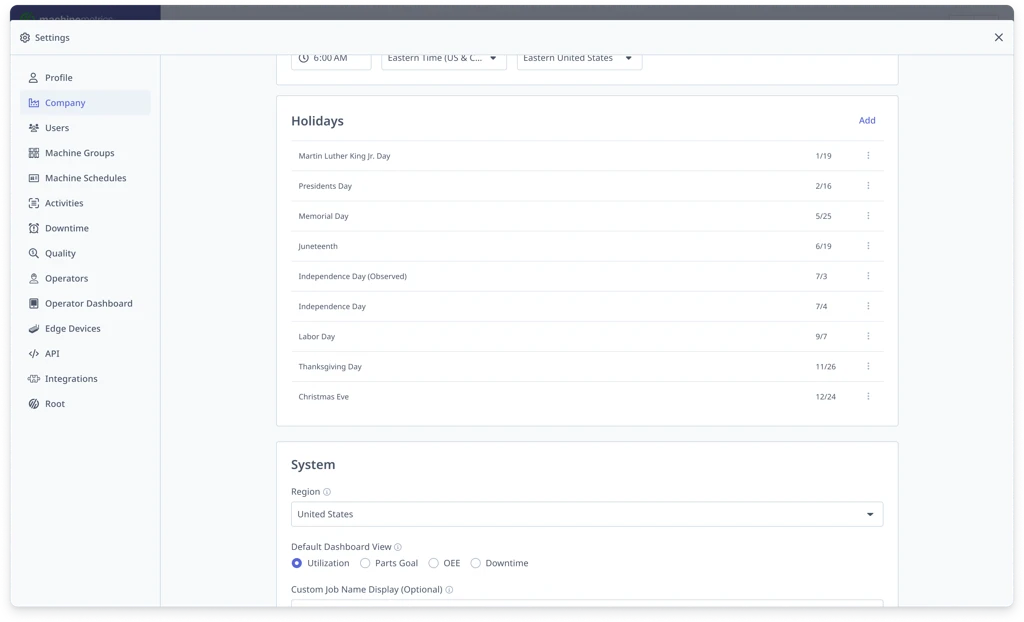
Default Dashboard View
Purpose: Set which dashboard users see when logging in or navigating to dashboards.
Options:
- Utilization: Current Shift Dashboard with Utilization view
- Parts Goal: Current Shift Dashboard with Parts Goal view
- Downtime: Current Shift Dashboard with Downtime view
- OEE: Current Shift Dashboard with OEE view
Configuration: Select default view from dropdown and click Save.
Display Settings
Display "Waiting for Work":
- Enabled: Show "Waiting for Work" status when machine has no assigned operation
- Disabled: Hide this status
Display "Unknown Job":
- Enabled: Show "Unknown Job" when machine is running without assigned operation in MachineMetrics
- Disabled: Hide this status
Use Case: If you don't use Operations/APM, disable "Unknown Job" to reduce clutter.
Allow Operators to Override Job Start/End Times
Purpose: Let operators adjust job timestamps when starting/stopping operations on tablets.
Options:
- Enabled: Operators can backdate job start time (e.g., "I actually started 10 minutes ago")
- Disabled: Job timestamps always use current time
Configuration: Toggle on/off
Use Case: Enable if operators frequently forget to start operations on time. Disable to enforce strict timestamping.
Cycle Time Entry
Purpose: Define how cycle time is entered in operation definitions.
Options:
- Single Part Duration: Enter time for one part (most common)
- Full Cycle Time Duration: Enter time for complete cycle (if multiple parts per cycle)
- Parts Per Hour: Enter production rate (e.g., 30 parts/hour)
Configuration: Select from dropdown
Impact: Affects how Expected Part Time is entered when creating operations.
Operator Tracking
Purpose: Enable/disable operator login functionality on tablets.
Options:
- Enabled: Operators can log in/out on tablets, operator performance tracked
- Disabled: No operator tracking
Configuration: Toggle on/off
See Also: Operators and ShopPulse Interface Guide
Ideal Cycle Time
Purpose: Define how ideal cycle time is handled for OEE Performance calculations.
Options:
- Automatic: MachineMetrics calculates ideal cycle time from historical data
- Manual: Enter ideal cycle time manually for each operation
- Disabled: No ideal cycle time used (Performance based on expected cycle time only)
Configuration: Select from dropdown
See Also: Understanding Your Data Guide
Ignore APM Archive Operations
Purpose: Control whether APM (Automatic Production Monitoring) auto-archives operations.
Options:
- Enabled: APM ignores archived operations (won't create new runs for archived ops)
- Disabled: APM can still create runs for archived operations
Configuration: Toggle on/off
Use Case: Enable to prevent APM from reactivating old operations when program numbers are reused.
ERP Job Tracking Settings
Job Tracking Method:
Purpose: Define who controls production run creation.
Options:
- Driven by MachineMetrics: Operators or APM create production runs in MachineMetrics
- Driven by ERP: External ERP system creates/manages production runs via API
Configuration: Select from dropdown
Use Case: If integrating with ERP (e.g., IQMS, E2, JobBOSS), set to "Driven by ERP".
Default Metric Goals
Purpose: Set company-wide performance thresholds for color-coded dashboards.
Configurable Goals:
1. Utilization Goals
- Goal (Green): % or above (e.g., 85%)
- Warning (Yellow): % threshold (e.g., 70%)
- Failure (Red): Below warning threshold
2. OEE Goals
- Goal (Green): % or above (e.g., 70%)
- Warning (Yellow): % threshold (e.g., 50%)
- Failure (Red): Below warning threshold
3. Parts Goal
- Goal (Green): % or above (e.g., 100% of expected)
- Warning (Yellow): % threshold (e.g., 85%)
- Failure (Red): Below warning threshold
Configuration:
- Enter percentages for each threshold
- Click Save
Impact: Determines Performance Wheel colors on ShopPulse Interface and dashboard tile colors.
Override: Machine-specific or operation-specific goals override company defaults.
Holidays
Purpose: Define company-wide non-production days where downtime is automatically categorized as planned downtime, so metrics like OEE and availability reflect only expected production time.
Access: Settings → Company → Holidays
Prerequisite: Enable Exclude Planned Downtime from Scheduled Time in Settings → Downtimes before configuring holidays. Without this setting, downtime will still be categorized with the selected reason, but Scheduled Time and related metrics will not be adjusted.
How holidays work:
- Apply to all machines across all machine schedules
- Span a full day based on your company's Start of Day setting
- Automatically categorize any idle time during the holiday with the selected downtime reason
- Recur annually on the configured date
- Apply from the date they are created forward — historical metrics are not affected
Note: Existing automatic downtime categorization rules covering the same time period are no longer required once a holiday is configured.
Impact on metrics:
| Metric | Impact |
|---|---|
| Scheduled Time | Reduced by planned downtime during the holiday |
| Availability | Recalculated using reduced Scheduled Time |
| OEE | Recalculated (Availability component changes) |
| OOE | Recalculated |
| TEEP | Recalculated |
| Parts Goal | Recalculated using reduced Scheduled Time |
| Performance | No impact |
| Quality | No impact |
Adding a Standard Holiday
- Navigate to Settings → Company
- Scroll to the Holidays section
- Click Add
- In the Holiday field, select from the list — defaults are based on your company's region; use the search bar to search all holidays. The date populates automatically.
- Select a Downtime Category to classify idle time during this period
- Click Save
Adding a Custom Holiday
- Click Add, then in the Holiday search bar click + Custom holiday
- Enter a unique Name
- Select a Date — custom holidays recur on this date every year
- Select a Downtime Category
- Click Save
Editing or Removing a Holiday
Click the three-dot menu (⋮) next to a holiday and select Edit or Delete.
FAQ:
- Will holidays change historical metrics? No — holidays apply from the date they are created forward.
- What if a machine runs during a holiday? Production activity is recorded normally. Only downtime is automatically categorized.
- Can holidays differ by machine? No — holidays are company-wide.
Users Management
What is Users?
Users is where you invite colleagues to MachineMetrics and assign roles.
Access: Settings → Users
Who Can Manage: Managers, Executives, IT Admins
User Roles
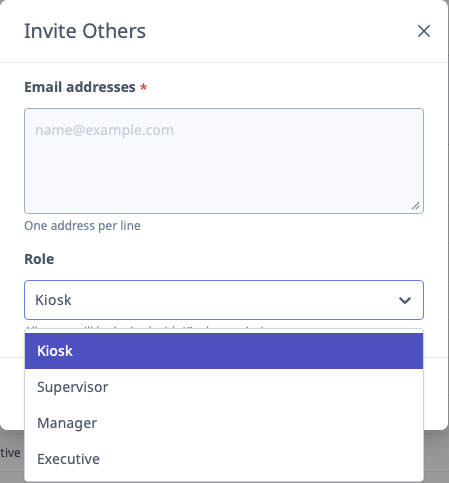
Available Roles:
1. Kiosk
- Purpose: Tablets and large screen TV displays
- Access: View-only, no login required
- Use Case: Shop floor dashboards on TVs
2. Supervisor
- Access:
- View dashboards, reports, machines
- Categorize downtime
- Reject parts
- Cannot create/delete reports
- Cannot manage users
- Use Case: Shift supervisors, floor leads
3. Manager
- Access:
- All Supervisor capabilities
- Create/save/delete reports
- Manage users (invite, edit, delete)
- Export data
- Use Case: Operations managers, plant managers
4. IT Admin
- Access:
- All Manager capabilities
- Configure SSO
- Manage Edge Devices
- Configure API keys
- System-level settings
- Use Case: IT department personnel
5. Executive
- Access: Full access to all settings and features
- Use Case: Plant managers, VPs, executives
Inviting Users
Step-by-Step:
- Navigate to Settings → Users
- Click "Invite Users" button
- Enter email addresses:
- One email per line
- Can invite multiple users at once
- Select Role from dropdown (applies to all invited users in this batch)
- Click "Send Invitations"
Example:
john.doe@company.com
jane.smith@company.com
bob.jones@company.com

Role: Supervisor
What Happens:
- Each user receives invitation email
- They click link to create password
- Account activated with assigned role
Editing Users
Changing User Role:
- Navigate to Settings → Users
- Find user in list
- Click Edit (pencil icon)
- Change Role dropdown
- Click Save
Deactivating Users:
- Click Deactivate to disable account (user cannot log in)
- Account retained for historical data
- Can be reactivated later
Deleting Users:
- Click Delete to permanently remove account
- Historical data (downtime categorizations, etc.) retained but unlinked from user
User List
Columns:
- Name: User's name (from email or profile)
- Email: User's email address
- Role: Current role
- Status: Active or Inactive
- Last Login: When user last logged in
Filtering:
- Search by name or email
- Filter by role
- Filter by status (Active/Inactive)
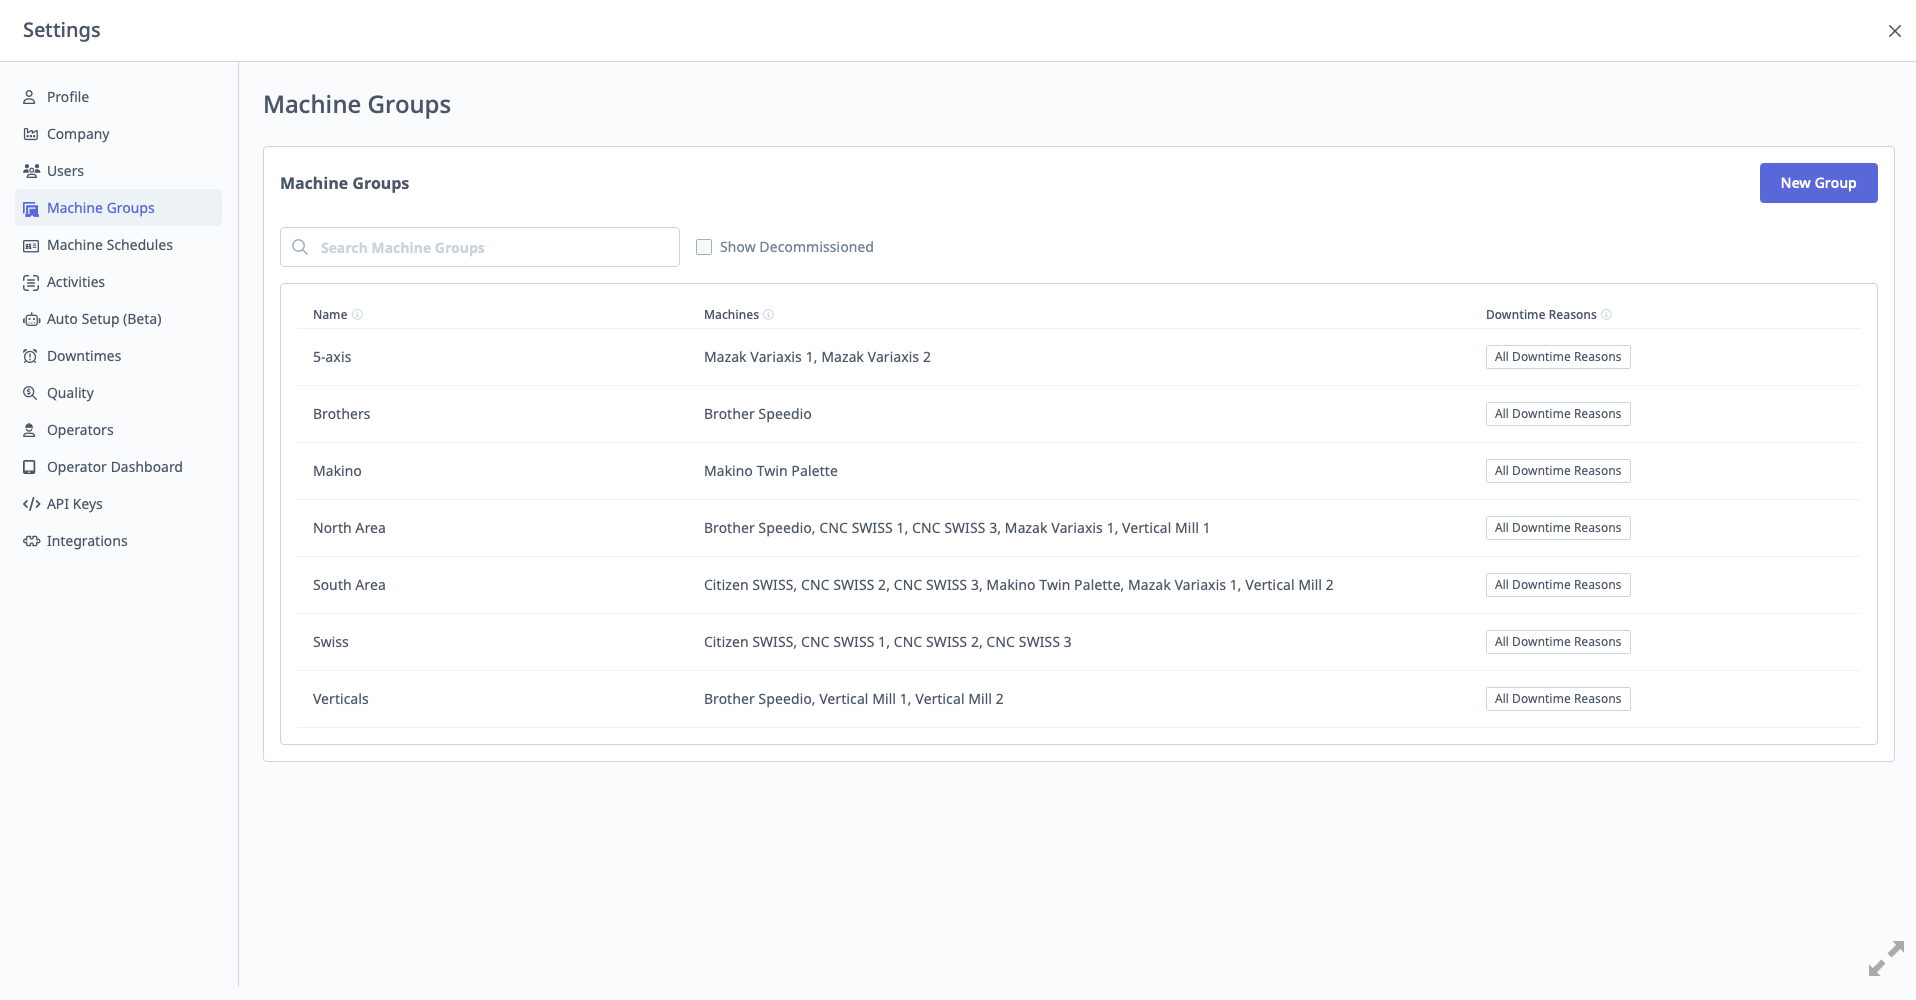
Machine Groups
What are Machine Groups?
Machine Groups organize machines into logical categories for filtering, reporting, and downtime categorization.
Access: Settings → Machine Groups
Who Can Manage: Managers, Executives, IT Admins
Purpose of Machine Groups
Use Cases:
- Filtering: View specific group on dashboards (e.g., "CNC Mills" only)
- Reporting: Run reports for specific group
- Downtime Categorization: Assign different downtime categories to different groups
- ERP Integration: Map groups to ERP work centers
Example Groups:
- CNC Mills
- CNC Lathes
- Manual Welding
- Grinders
- CMMs (Coordinate Measuring Machines)
Creating Machine Groups
Step-by-Step:
- Navigate to Settings → Machine Groups
- Click "Add Group" button
- Enter Group Name (e.g., "CNC Mills")
- (Optional) Select Downtimes: Choose which downtime categories apply to this group
- (Optional) Enter ERP ID: If integrating with ERP, enter work center ID
- Click "Save"
Downtime Category Assignment: Important: Different groups can have different downtime categories.
Example:
Group: CNC Mills
Downtimes: Tool Change, Setup, Material Unavailable, Maintenance

Group: Manual Welding
Downtimes: Waiting for Welder, Material Unavailable, Electrode Change
Why This Matters: Operators on tablets only see downtime categories relevant to their machine group, reducing clutter and improving categorization accuracy.
Assigning Machines to Groups
Method 1: During Machine Creation
- When adding machine, select group from dropdown
Method 2: Edit Existing Machine
- Navigate to Assets → Machines → Select Machine
- Click "Edit"
- Change "Machine Group" field
- Click "Save"
Method 3: Bulk Assignment
- Use CSV import to assign many machines to groups at once
ERP Integration
ERP ID Field:
- Maps MachineMetrics group to ERP work center or resource group
- Used for ERP integrations (IQMS, E2, JobBOSS, etc.)
- Format depends on ERP system
Example:
MachineMetrics Group: CNC Mills
ERP ID: WC-100
Managing Machine Groups
Editing Groups:
- Click group in list
- Modify name, downtimes, or ERP ID
- Click "Save"
Deleting Groups:
- Click "Delete"
- Machines in group are unassigned (not deleted)
- Reassign machines to different group before deleting
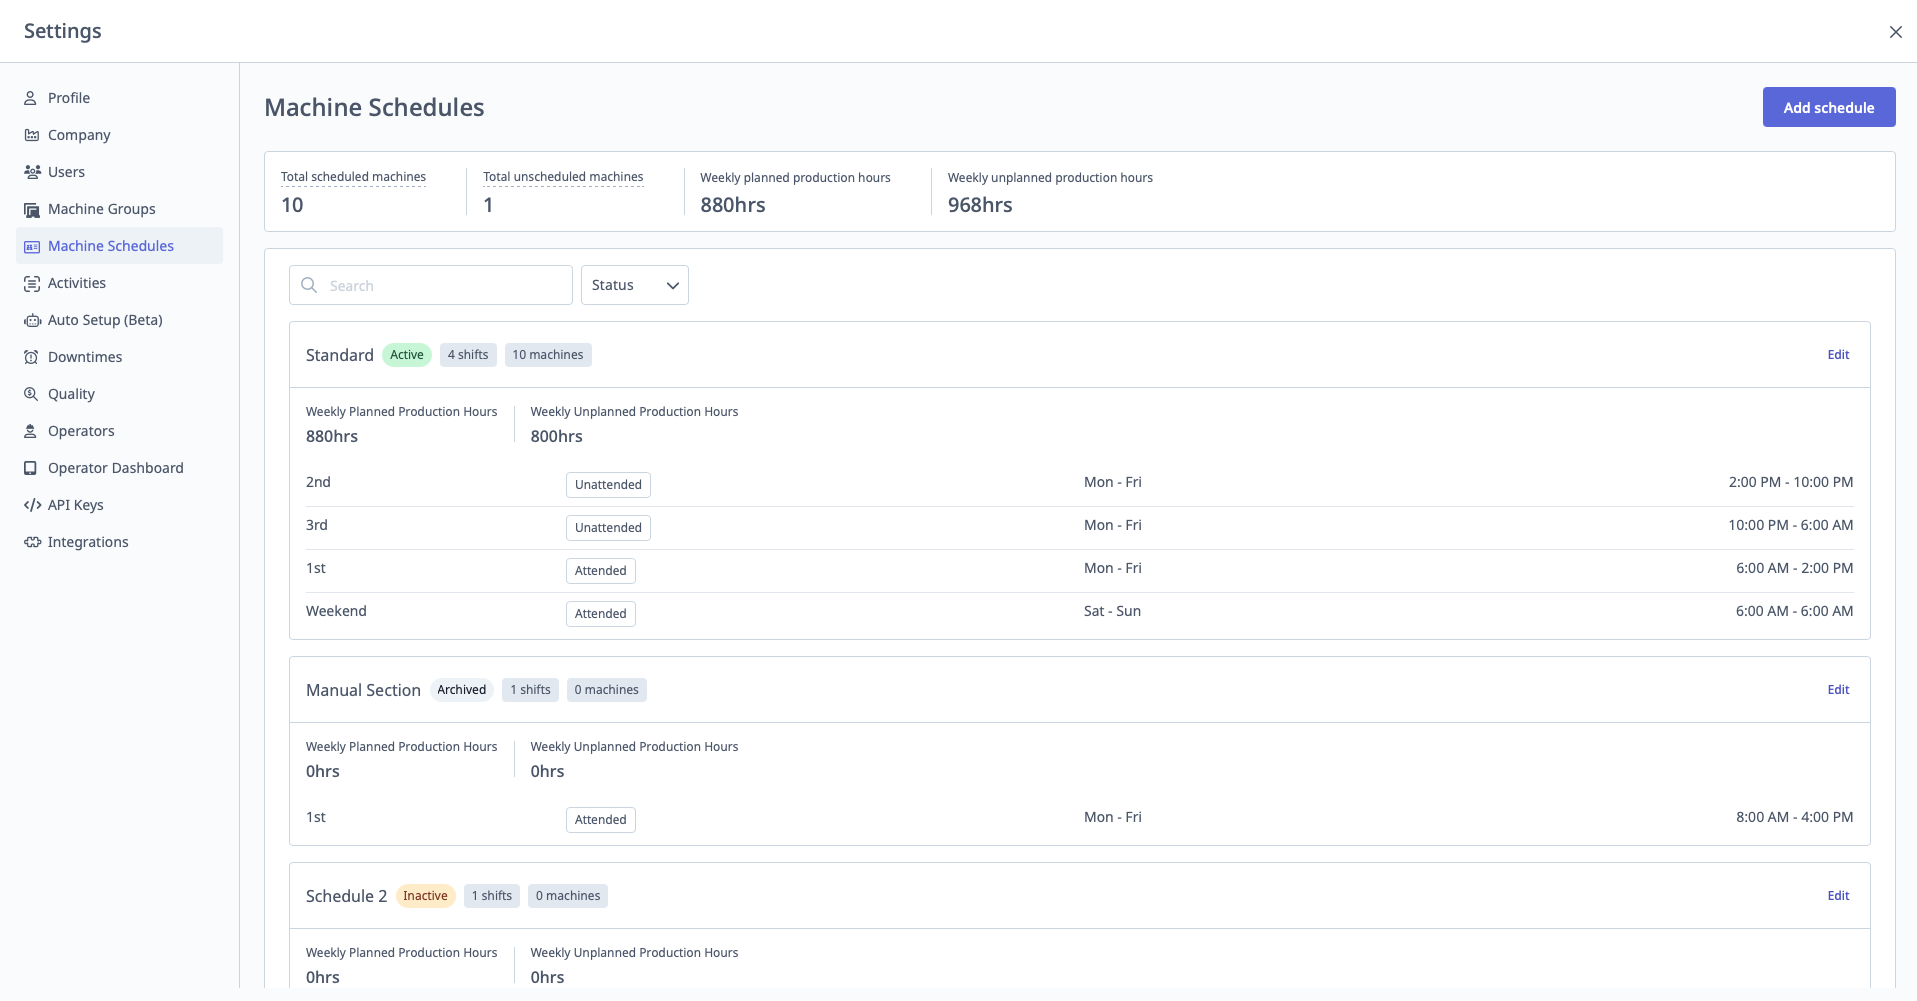
Machine Schedules
What are Machine Schedules?
Machine Schedules define shifts for calculating scheduled time and OEE Availability.
Access: Settings → Machine Schedules
Who Can Manage: Managers, Executives, IT Admins
Purpose of Schedules
Why Define Schedules:
- Calculate Scheduled Time for OEE Availability
- Determine when machines are expected to run
- Separate attended vs. unattended shifts
- Enable shift-based reporting
Impact on OEE:
Availability = (Running Time / Scheduled Time) × 100%
Scheduled time is the denominator. Without shifts defined, scheduled time = 24/7.
Creating Shifts
Step-by-Step:
- Navigate to Settings → Machine Schedules
- Click "Add Shift"
- Configure shift:
- Shift Name: Descriptive name (e.g., "First Shift", "Day Shift")
- Start Time: When shift begins (e.g., 6:00 AM)
- End Time: When shift ends (e.g., 2:00 PM)
- Days: Which days shift runs (Monday - Sunday)
- Shift Type: Attended or Unattended
- Machine Group: Apply to specific group or all machines
- Click "Save"
Example Shifts:
First Shift: 6:00 AM - 2:00 PM, Mon-Fri, Attended, CNC Mills
Second Shift: 2:00 PM - 10:00 PM, Mon-Fri, Attended, CNC Mills
Third Shift: 10:00 PM - 6:00 AM, Mon-Fri, Unattended, CNC Mills
Weekend Shift: 8:00 AM - 4:00 PM, Sat-Sun, Attended, CNC Mills
Attended vs. Unattended Shifts
Attended Shifts:
- All time during shift is scheduled
- Used for shifts with operators present
- Downtime during shift hurts Availability
Unattended Shifts:
- Only time when machine is active counts as scheduled
- Used for overnight or weekend shifts without operators
- Unattended Inactive Threshold (from Downtime settings) determines when machine is considered "unscheduled"
- If inactive > threshold: Time becomes unscheduled (doesn't hurt Availability)
- If active: Time becomes scheduled
Example:
Third Shift (Unattended): 10:00 PM - 6:00 AM
Unattended Inactive Threshold: 30 minutes

Scenario:
- Machine runs 10:00 PM - 2:00 AM (4 hours active) → Scheduled
- Machine idle 2:00 AM - 6:00 AM (4 hours idle > 30 min threshold) → Unscheduled

Scheduled Time: 4 hours (not 8 hours)
Non-Overlapping Shifts
Important Constraint: Shifts cannot overlap within the same machine group.
Allowed:
Group: CNC Mills
- First Shift: 6:00 AM - 2:00 PM
- Second Shift: 2:00 PM - 10:00 PM
- Third Shift: 10:00 PM - 6:00 AM
✅ No overlap

Group: CNC Lathes
- Day Shift: 9:00 AM - 5:00 PM
✅ Different group, can have different schedule
Not Allowed:
Group: CNC Mills
- First Shift: 6:00 AM - 2:00 PM
- Overlap Shift: 1:00 PM - 9:00 PM
❌ Overlap from 1:00 PM - 2:00 PM
Applying Schedules to Machines
Schedules are applied based on Machine Group:
- Create shift and assign to machine group
- All machines in that group inherit the shift schedule
Changing Machine Schedule:
- Move machine to different group (with different schedule)
- Or modify shift assigned to machine's group
Managing Schedules
Editing Shifts:
- Click shift in list
- Modify times, days, or type
- Click "Save"
Deleting Shifts:
- Click "Delete"
- Historical data recalculates based on new schedule configuration
Important: Changing schedules affects historical OEE calculations (data recalculates).
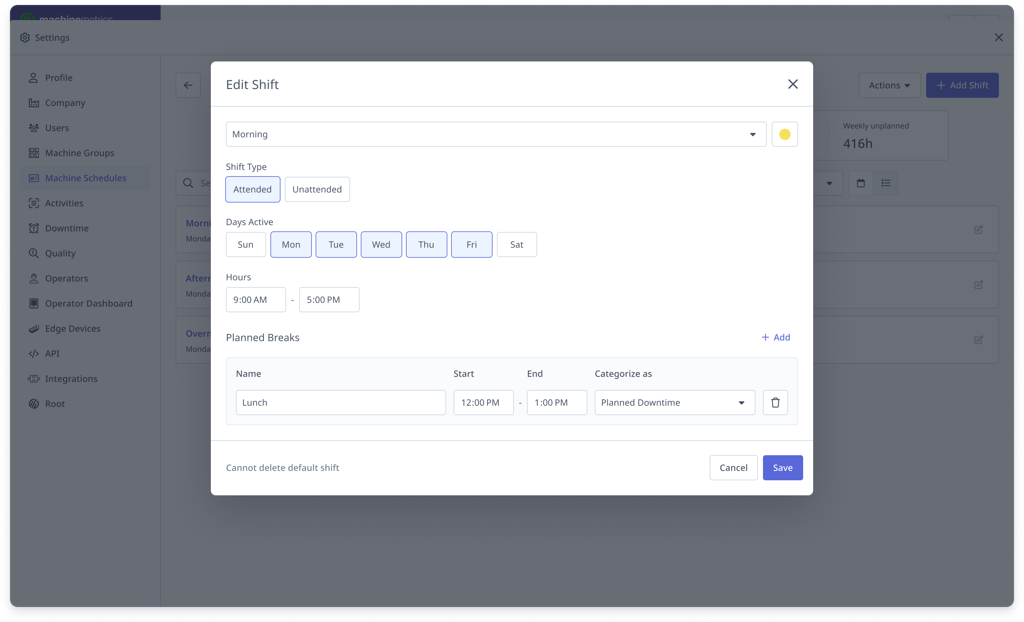
Planned Breaks
Purpose: Define recurring break windows within a shift where downtime is automatically categorized as planned downtime, so metrics reflect only expected production time.
Access: Settings → Machine Schedules → Edit Shift → Planned Breaks
Prerequisite: Enable Exclude Planned Downtime from Scheduled Time in Settings → Downtimes. Without this setting, downtime will still be categorized with the selected reason, but Scheduled Time and related metrics will not be adjusted.
How breaks work:
- Configured at the shift level — apply only to machines in the schedule that contains that shift
- Must fall entirely within shift hours
- Automatically categorize idle time during the break with the selected downtime reason
- Apply from the date they are created forward — historical data is not affected
- Multiple breaks can be added to a single shift; breaks do not carry over between shifts
Note: Existing automatic downtime categorization rules covering the same time period are no longer required once a break is configured.
Example: Shift 9:00 AM – 5:00 PM with a Lunch break 12:00 PM – 1:00 PM. If the machine is idle for the full break, that hour is classified as planned downtime and excluded from Scheduled Time — OEE and Availability then calculate against a 7-hour expected production window.
Impact on metrics:
| Metric | Impact |
|---|---|
| Scheduled Time | Reduced by planned downtime during breaks |
| Availability | Recalculated using reduced Scheduled Time |
| OEE | Recalculated |
| OOE | Recalculated |
| TEEP | Recalculated |
| Parts Goal | Recalculated using reduced Scheduled Time |
| Performance | No impact |
| Quality | No impact |
Adding a Break to a Shift
- Navigate to Settings → Machine Schedules
- Select the schedule to edit
- Click Edit on the shift
- Scroll to Planned Breaks and click + Add
- Configure:
- Name — a unique name for the break (e.g., "Lunch", "Morning Break")
- Start — time the break begins
- End — time the break ends
- Categorize as — downtime category to apply during this period
- Click Save
Rules and constraints:
- Break start and end times must fall within shift boundaries
- Multiple breaks can be added per shift
- Breaks do not carry across shifts
FAQ:
- Do breaks affect historical data? No — breaks apply from the date they are created forward.
- What if a machine runs during a break? Production activity is recorded normally. Only downtime is automatically categorized.
- Do breaks carry over across shifts? No — each break applies only within the shift it is configured on.
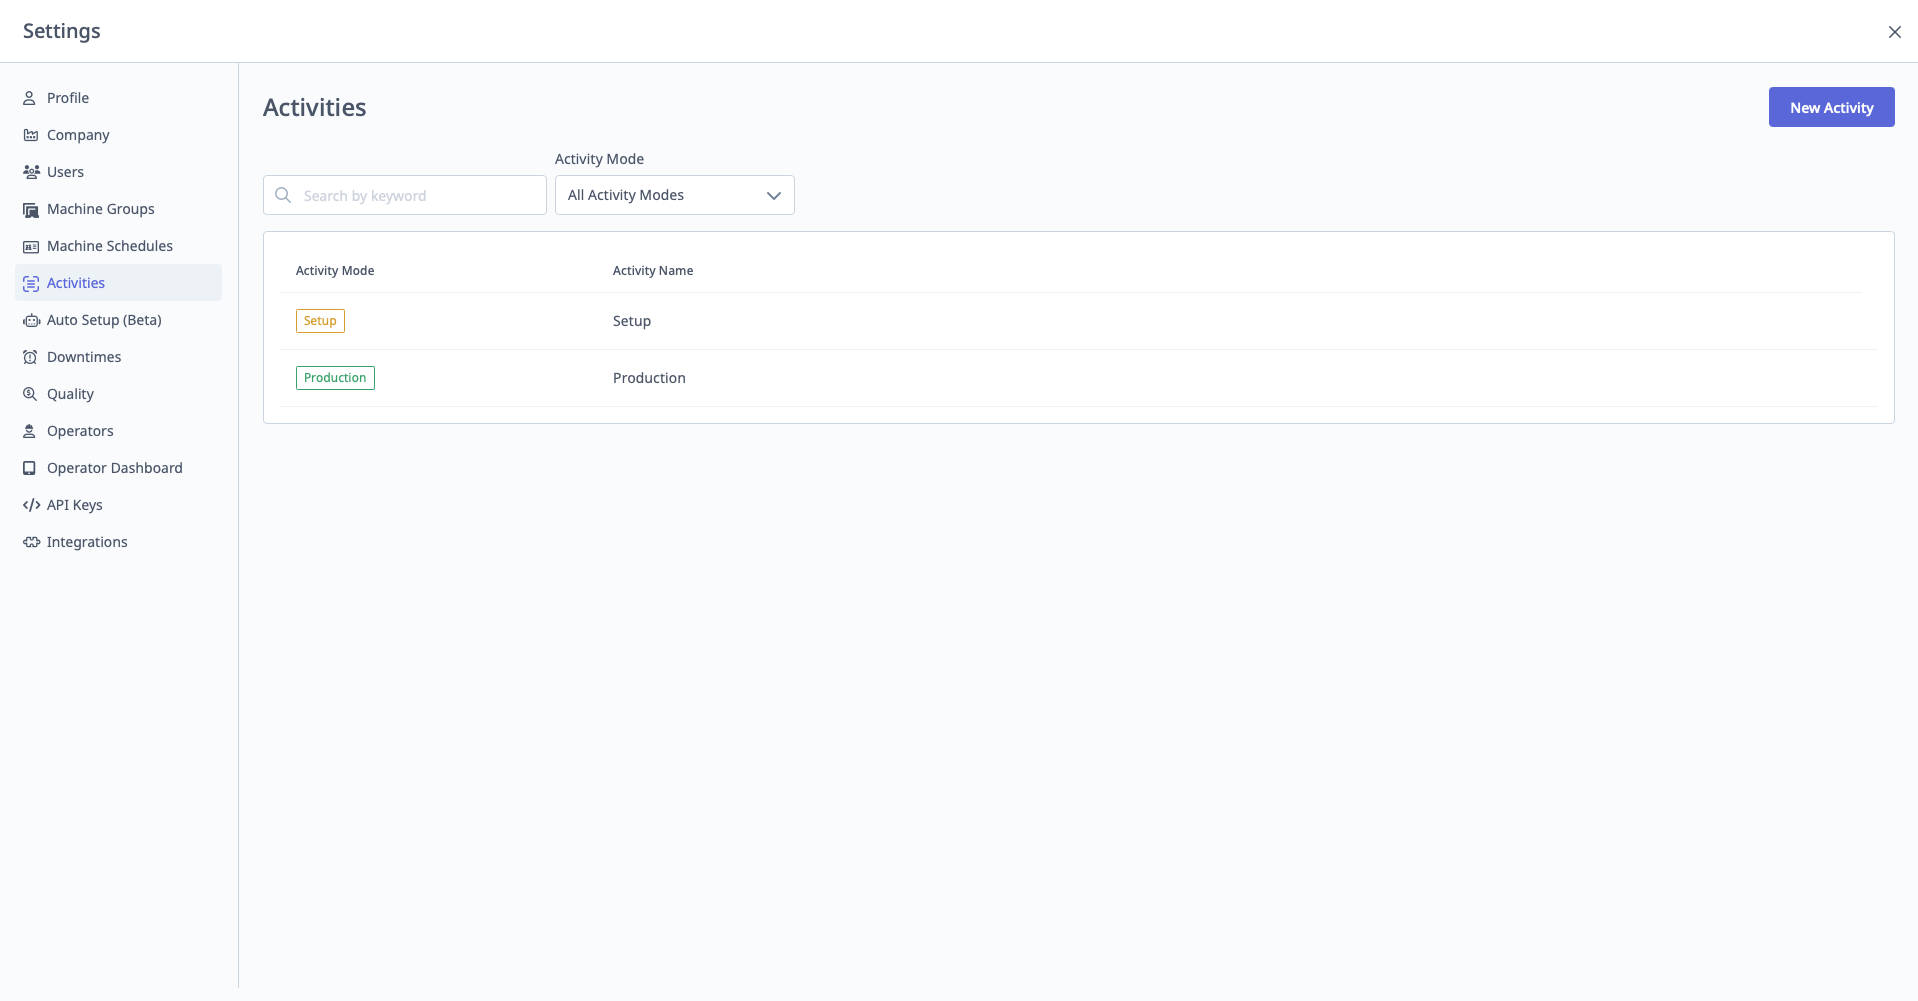
Activities
What are Activities?
Activities distinguish between Setup and Production modes during production runs.
Access: Settings → Activities
Who Can Manage: Managers, Executives, IT Admins
Activity Types
Two Activity Types:
1. Setup
- Machine is being prepared for production
- Includes: Loading fixtures, setting tools, running first article, adjustments
- Tracked separately from production time
2. Production
- Machine is actively producing parts
- Normal production cycle
Purpose of Activities
Why Track Activities:
- Separate Setup Time: Track how long setup takes vs. actual production
- OEE Impact: Planned setup can be excluded from Availability and Performance calculations
- Improvement Opportunities: Identify operations with excessive setup time
- Operator Workflow: Operators switch between Setup and Production on tablets
See Also: Operator Dashboard Guide
Configuration
Activities are generally pre-configured and require minimal setup.
Available Settings:
- Enable/disable activity tracking (toggle)
- Configure planned setup duration for operations
If Activity Tracking Disabled:
- All time considered "Production"
- No distinction between setup and production
- Operators don't select activity on tablets
Planned Setup
Configuring Expected Setup Time:
- Set at operation level (not in Activities menu)
- Navigate to Production → Operations → Select Operation → Edit
- Enter Expected Setup Time (minutes)
Impact:
- If setup time ≤ expected: Marked as planned (can be excluded from OEE)
- If setup time > expected: Excess marked as unplanned (affects OEE)
See Also: Production & Analytics Guide
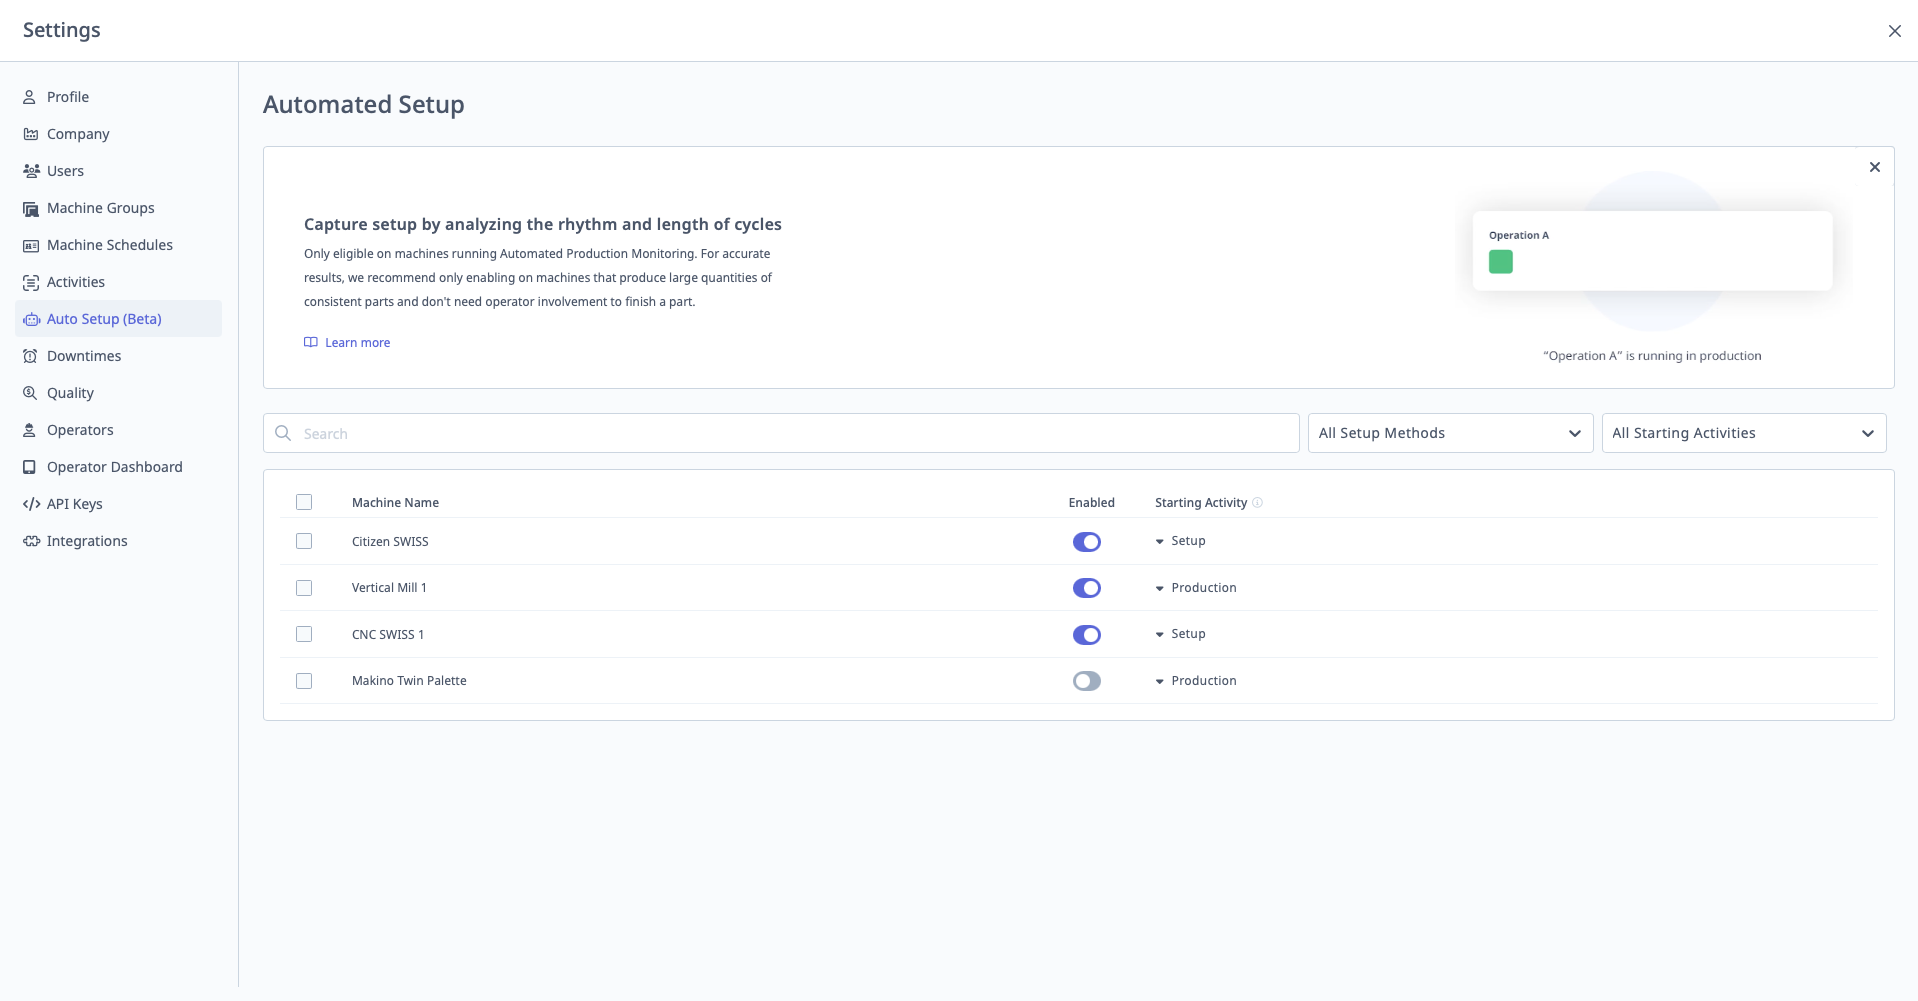
Auto Setup
What is Auto Setup?
Auto Setup automatically transitions machines from Setup to Production mode based on cycle consistency when using APM (Automatic Production Monitoring).
Access: Settings → Auto Setup
Who Can Manage: Managers, Executives, IT Admins
Prerequisites:
- Machine must use APM (Automatic Production Monitoring)
- APM typically used with machines reporting program headers via Ethernet (FOCAS, MTConnect, OPC-UA)
How Auto Setup Works
Automatic Workflow:
1. Job Change Detected (via APM)
- Machine program changes (new part number/operation detected)
- APM creates new Production Run
- Auto Setup activates: Machine automatically enters Setup mode
2. Consistent Parts Detected
- MachineMetrics monitors cycle times
- Once cycle times stabilize and become consistent
- Auto Setup deactivates: Machine automatically switches to Production mode
3. Next Job Change
- Process repeats for next operation
Example:
Time: 8:00 AM - Program changes to Part ABC-123
Action: Auto Setup puts machine in Setup mode

Time: 8:00 AM - 8:30 AM - Operator sets tools, runs first articles (cycle times variable)

Time: 8:30 AM - Cycle times stabilize at ~120 seconds
Action: Auto Setup switches machine to Production mode

Time: 8:30 AM - 2:00 PM - Production runs (cycle times consistent)

Time: 2:00 PM - Program changes to Part XYZ-789
Action: Auto Setup puts machine back in Setup mode
Benefits
- No Operator Input Required: Automatic tracking of setup vs. production
- Accurate Setup Time: Based on actual cycle consistency, not manual operator selection
- Reduced Operator Burden: One less thing for operators to remember
Enabling Auto Setup
Step-by-Step:
- Navigate to Settings → Auto Setup
- Select machines to enable Auto Setup (must have APM enabled)
- Toggle Enable Auto Setup for each machine
- Click "Save"
Bulk Enable:
- Select multiple machines
- Click "Enable All"
Limitations
Auto Setup Requires:
- APM (Automatic Production Monitoring) enabled
- Machine with consistent cycle times
- Program header data from machine
Not Compatible With:
- Manual operation start/stop (non-APM machines)
- Highly variable cycle times
- One-off jobs or prototype runs
See Also: Production & Analytics Guide
Downtimes
What is Downtimes?
Downtimes is where you configure downtime categories (reasons) and general downtime settings.
Access: Settings → Downtimes
Who Can Manage: Managers, Executives, IT Admins
General Downtime Settings
Access: Settings → Downtimes → General
Key Settings:
1. Microstop Duration (seconds)
Purpose: Threshold separating microstops from long downtime.
Configuration:
- Enter duration in seconds (e.g., 60)
- Default: 60 seconds
Impact:
- Downtime < threshold: Categorized as "Microstop"
- Downtime ≥ threshold: Categorized as "Long Downtime"
Reporting:
- Microstops typically excluded from downtime reports
- Long downtime requires categorization
2. Downtime List Filter (seconds)
Purpose: Hide very short downtime events from operator categorization list.
Configuration:
- Enter duration in seconds (e.g., 30)
- Default: 30 seconds
Impact:
- Downtime < filter: Hidden from operator's categorization list on tablet
- Prevents operators from being prompted to categorize very short stops
Example:
Downtime List Filter: 30 seconds

5-second stop: Hidden (not prompted)
45-second stop: Shown (operator can categorize)
3. Unattended Inactive Threshold (minutes)
Purpose: For unattended shifts, determines when idle time becomes unscheduled.
Configuration:
- Enter duration in minutes (e.g., 30)
- Default: 30 minutes
Impact:
- During unattended shifts, if machine idle > threshold:
- Time becomes unscheduled (doesn't affect Availability)
- If machine idle < threshold:
- Time remains scheduled (affects Availability)
See Also: Machine Schedules and Understanding Your Data Guide
4. Exclude Planned Downtime from Production Metrics
Purpose: Exclude planned downtime (breaks, PM, etc.) from Availability and Performance calculations.
Configuration: Toggle on/off
Impact When Enabled:
- Planned downtime subtracted from scheduled time
- Does not hurt Availability or Performance
- Still included in Quality calculation
Impact When Disabled:
- All downtime (planned and unplanned) affects Availability equally
Example:
Scheduled Time: 8 hours (480 minutes)
Planned Break: 30 minutes
Planned Maintenance: 60 minutes

If Enabled:
Scheduled Time = 480 - 30 - 60 = 390 minutes

If Disabled:
Scheduled Time = 480 minutes (breaks/PM hurt Availability)
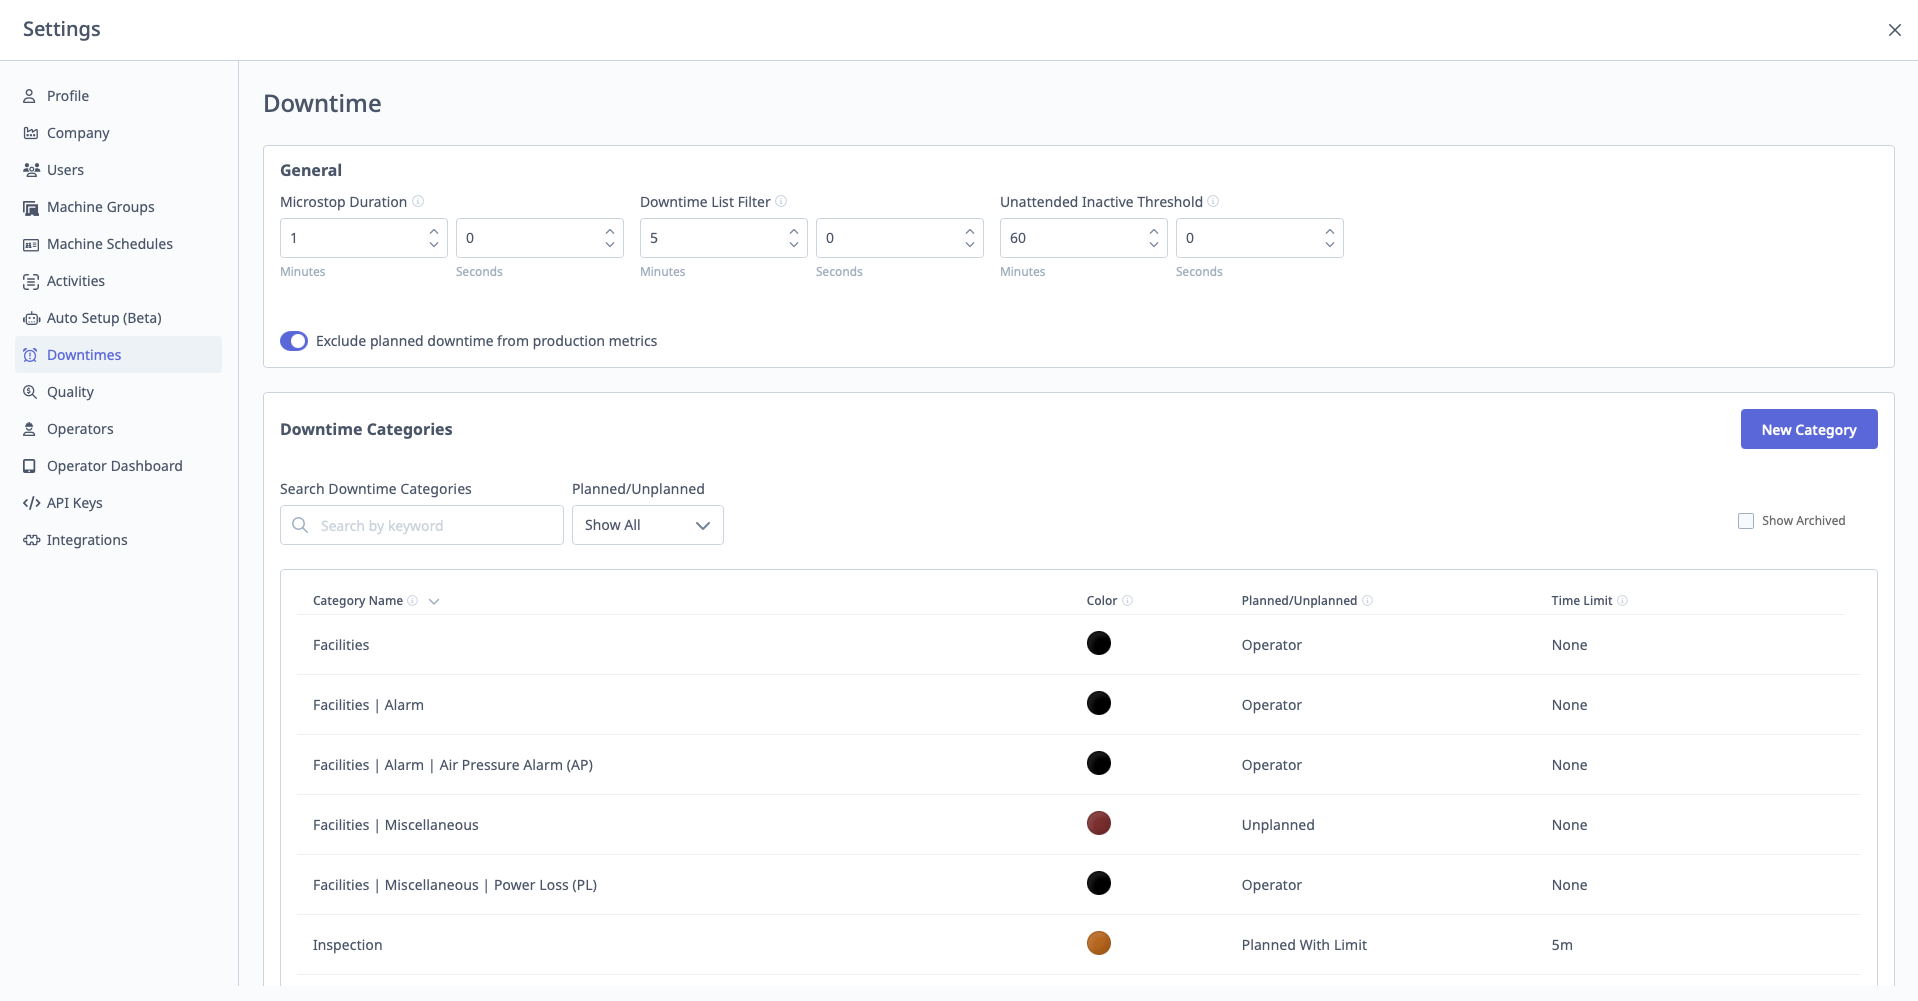
Downtime Categories
Access: Settings → Downtimes → Downtime Categories
Purpose: Define reasons for downtime that operators select on tablets.
See Also: Downtime & Quality Guide for comprehensive guide
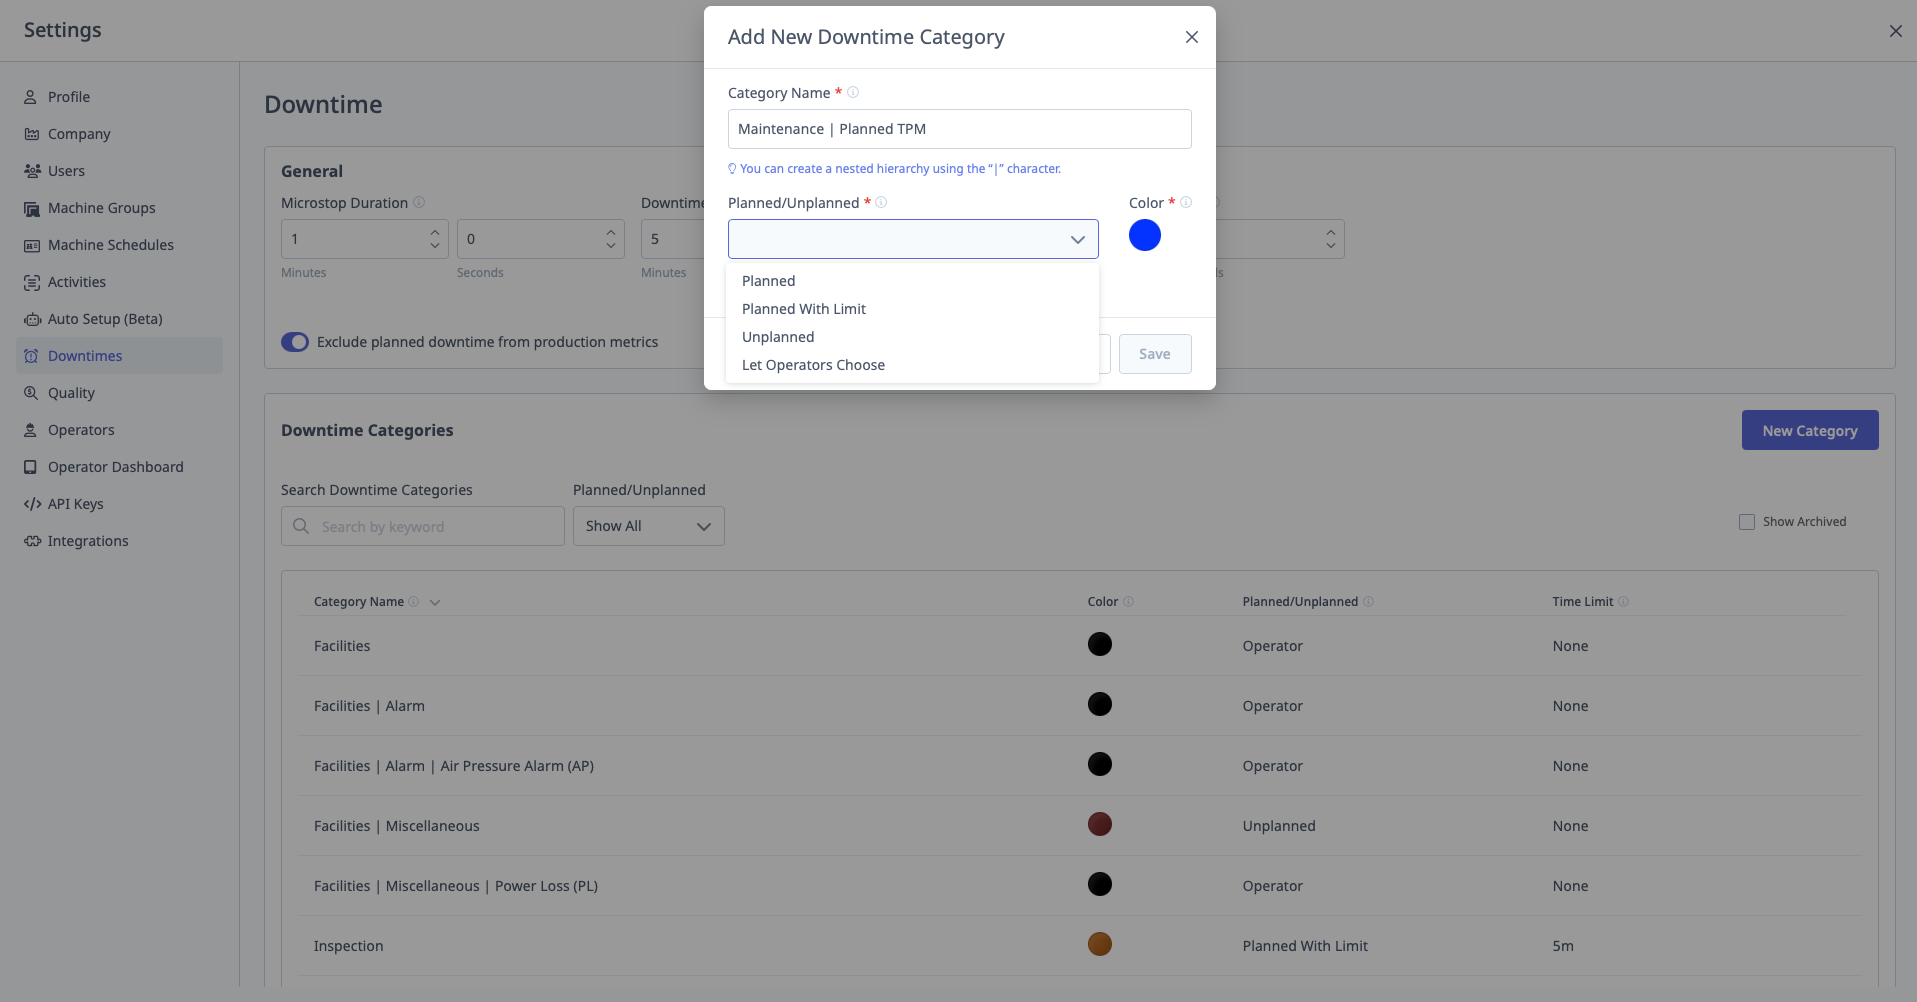
Creating Downtime Categories
Step-by-Step:
- Navigate to Settings → Downtimes → Downtime Categories
- Click "Add Category"
- Enter Category Name
- Select Planned/Unplanned Behavior:
- Planned or Unplanned: Operator chooses
- Unplanned: Always unplanned
- Planned: Always planned
- Planned with Limit: Planned up to X minutes, then unplanned
- Select Color (for visual identification)
- Click "Save"
Creating Hierarchical Categories
Purpose: Nest categories for more specific root cause tracking.
Format: Use pipe (|) separator
Example:
Parent Category: Tooling
Child Category: Tooling | Tool Change
Grandchild Category: Tooling | Tool Change | End of Life
Steps:
- Create parent first:
Tooling - Create child:
Tooling | Tool Change(note the space before and after|) - Create grandchild:
Tooling | Tool Change | End of Life
Important: You must create each level separately.
In Settings, there is an example showing the correct format with the vertical space bar character (|).
Planned with Limit
Purpose: Mark downtime as planned up to a certain duration, then unplanned if it exceeds.
Example:
Category: Operator Break
Behavior: Planned with Limit
Limit: 15 minutes

Scenario:
Break duration: 10 minutes → Planned (OK)
Break duration: 20 minutes → 15 min planned, 5 min unplanned (excess)
Use Case: Allow reasonable breaks without affecting OEE, but flag excessive breaks.
Colors
Purpose: Visual identification on tablets, timelines, and reports.
Best Practice:
- Use consistent colors for related categories
- Example: All "Maintenance" categories = orange, all "Material" categories = blue
Operator View: Colors appear on:
- Operator Dashboard (tablet)
- Timeline visualization
- Downtime reports
Assigning Categories to Machine Groups
When creating/editing Machine Groups:
- Select which downtime categories apply to that group
- Only selected categories appear on tablets for machines in that group
Example:
Group: CNC Mills
Categories: Tool Change, Setup, Material Unavailable, Maintenance

Group: Manual Welding
Categories: Waiting for Welder, Material Unavailable, Electrode Change

Operators on CNC Mills only see the 4 categories relevant to mills.
Quality
What is Quality?
Quality is where you configure reject reasons (why parts are rejected).
Access: Settings → Quality
Who Can Manage: Managers, Executives, IT Admins
Purpose of Reject Reasons
Why Define Reject Reasons:
- Track why parts are rejected
- Root cause analysis (Pareto charts)
- Identify quality improvement opportunities
- Calculate Quality component of OEE
See Also: Downtime & Quality Guide for comprehensive guide
For Auto Reject Rules: Reject reasons configured here are used in the Auto Reject Rules feature in Labs to automatically map machine reject data items to quality categories. See Labs Guide - Auto Reject Rules for configuration details.
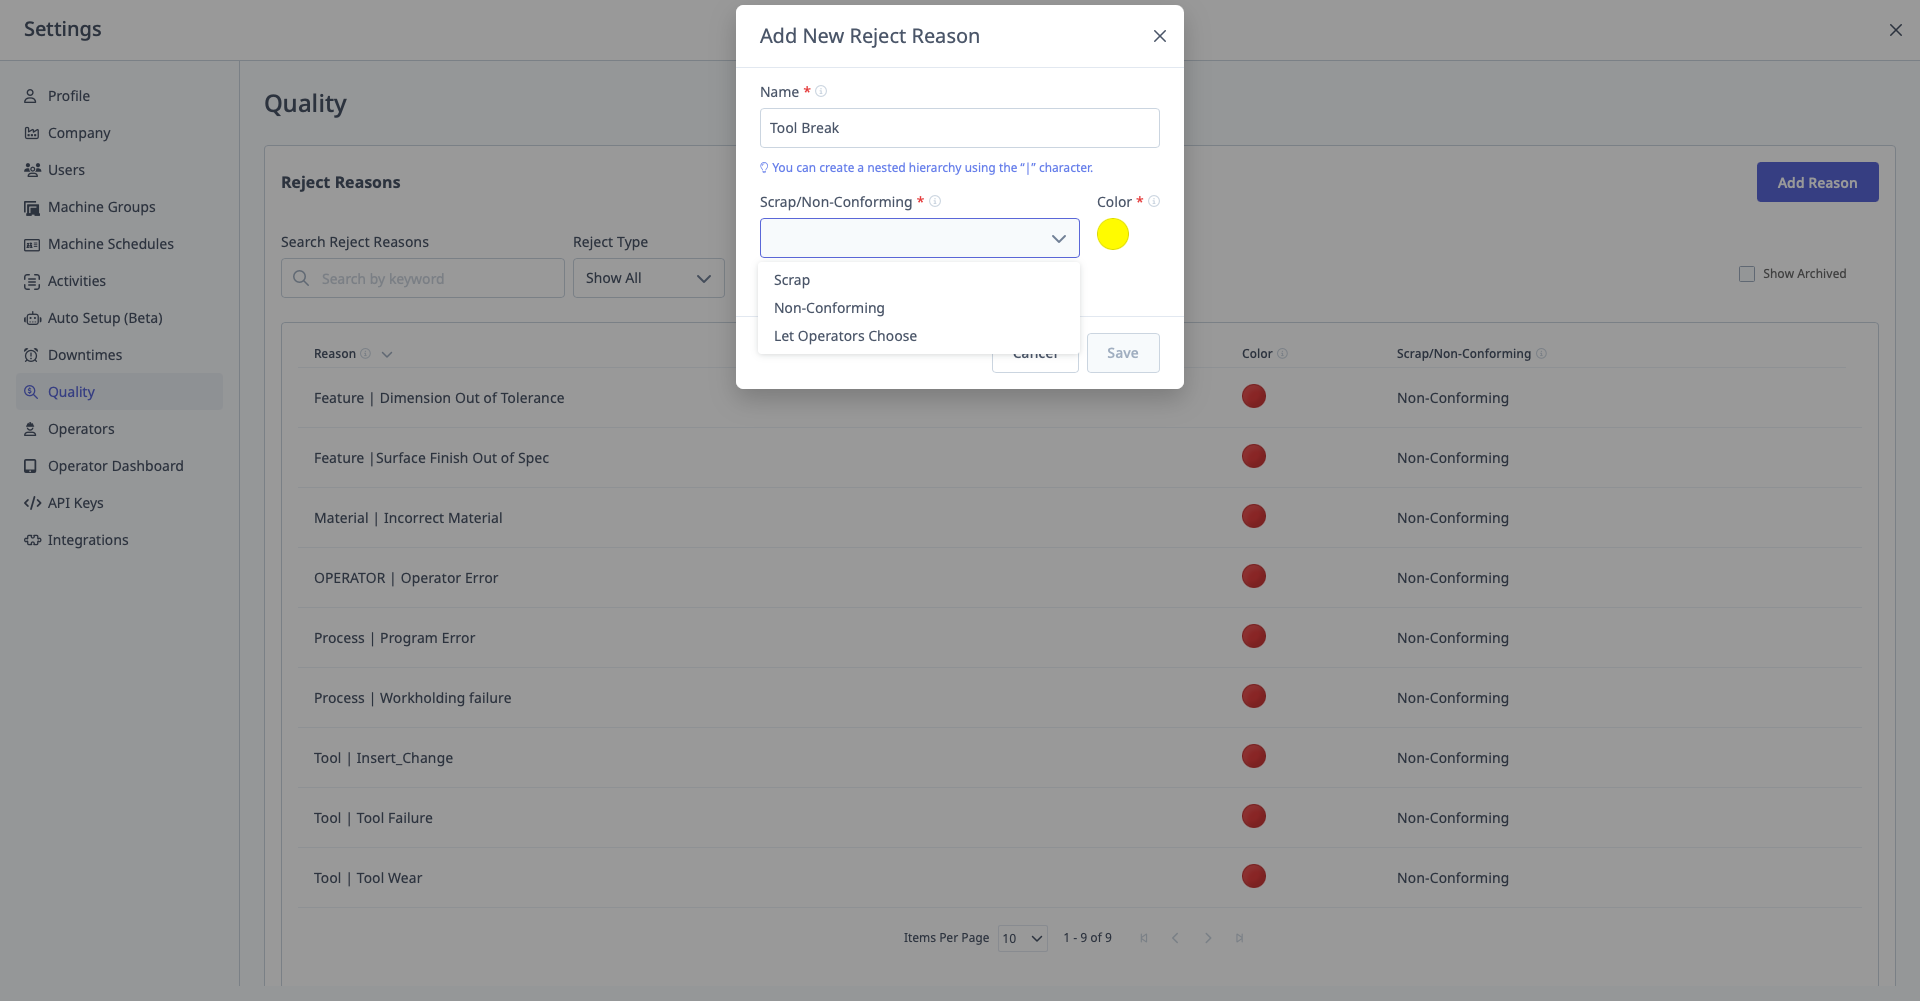
Creating Reject Reasons
Step-by-Step:
- Navigate to Settings → Quality → Reject Reasons
- Click "Add Reason"
- Enter Reason Name
- Select Scrap/Non-Conforming Behavior:
- Scrap or Non-Conforming: Operator chooses
- Scrap: Always marked as scrap
- Non-Conforming: Always marked as non-conforming
- Select Color (for visual identification)
- Click "Save"
Creating Hierarchical Reject Reasons
Format: Same as downtime categories, use pipe (|) separator
Example:
Parent: Dimensional
Child: Dimensional | Out of Specification
Grandchild: Dimensional | Out of Specification | Groove | Diameter Big
Steps:
- Create parent:
Dimensional - Create child:
Dimensional | Out of Specification - Create grandchild:
Dimensional | Out of Specification | Groove - Create great-grandchild:
Dimensional | Out of Specification | Groove | Diameter Big
Operator View: On tablets, reject reasons appear nested for easy selection.
Scrap vs. Non-Conforming
Scrap:
- Part is unusable
- Cannot be reworked
- Total loss
Non-Conforming:
- Part is outside spec but may be reworked
- Or used with deviation approval
- Potential recovery
Configuration:
- Set behavior when creating reject reason
- Or let operator choose (Scrap or Non-Conforming)
Colors
Purpose: Visual identification in reports and dashboards.
Operator View: Colors appear on:
- Operator Dashboard (tablet)
- Quality reports
- OEE Quality component visualization
Best Practices
Specific Reject Reasons:
- Avoid generic "Quality Issues"
- Use hierarchy:
Dimensional | Out of Spec | Feature X | Too Large - Specific reasons enable targeted improvements
Example Hierarchy:
Dimensional
  ├─ Out of Specification
  │   ├─ Groove
  │   │   ├─ Diameter Big
  │   │   └─ Diameter Small
  │   └─ Drill
  │       ├─ Hole Size Big
  │       └─ Hole Size Small
  └─ Surface Finish
      ├─ Rough Surface
      └─ Scratches

Tooling Issues
  ├─ Dull Tool
  ├─ Tool Break
  └─ Wrong Tool
Operators
If your MachineMetrics account is connected to an ERP (e.g., JobBoss, Infor Visual, Epicor), do not add operators here. Operators must be mapped through My Apps → ERP Data Studio → Persons to appear on tablets. Adding operators in Settings → Operators without an Employee ID will not make them available for ERP-linked tablet login. See Adding Operators in an ERP-Linked Setup for the correct workflow.
What is Operators?
Operators is where you add operator names for login on Operator Dashboard (tablets).
Access: Settings → Operators
Who Can Manage: Managers, Executives, IT Admins
Prerequisites:
- Operator Insight must be enabled in Company Settings
Purpose of Operators
Why Add Operators:
- Track individual operator performance
- Identify training needs
- Recognize top performers
- Enable operator-specific reporting
Important: Operator names are not MachineMetrics user accounts. They:
- Have no password
- Have no email
- Have no access to MachineMetrics web interface
- Only appear on tablet sign-in list
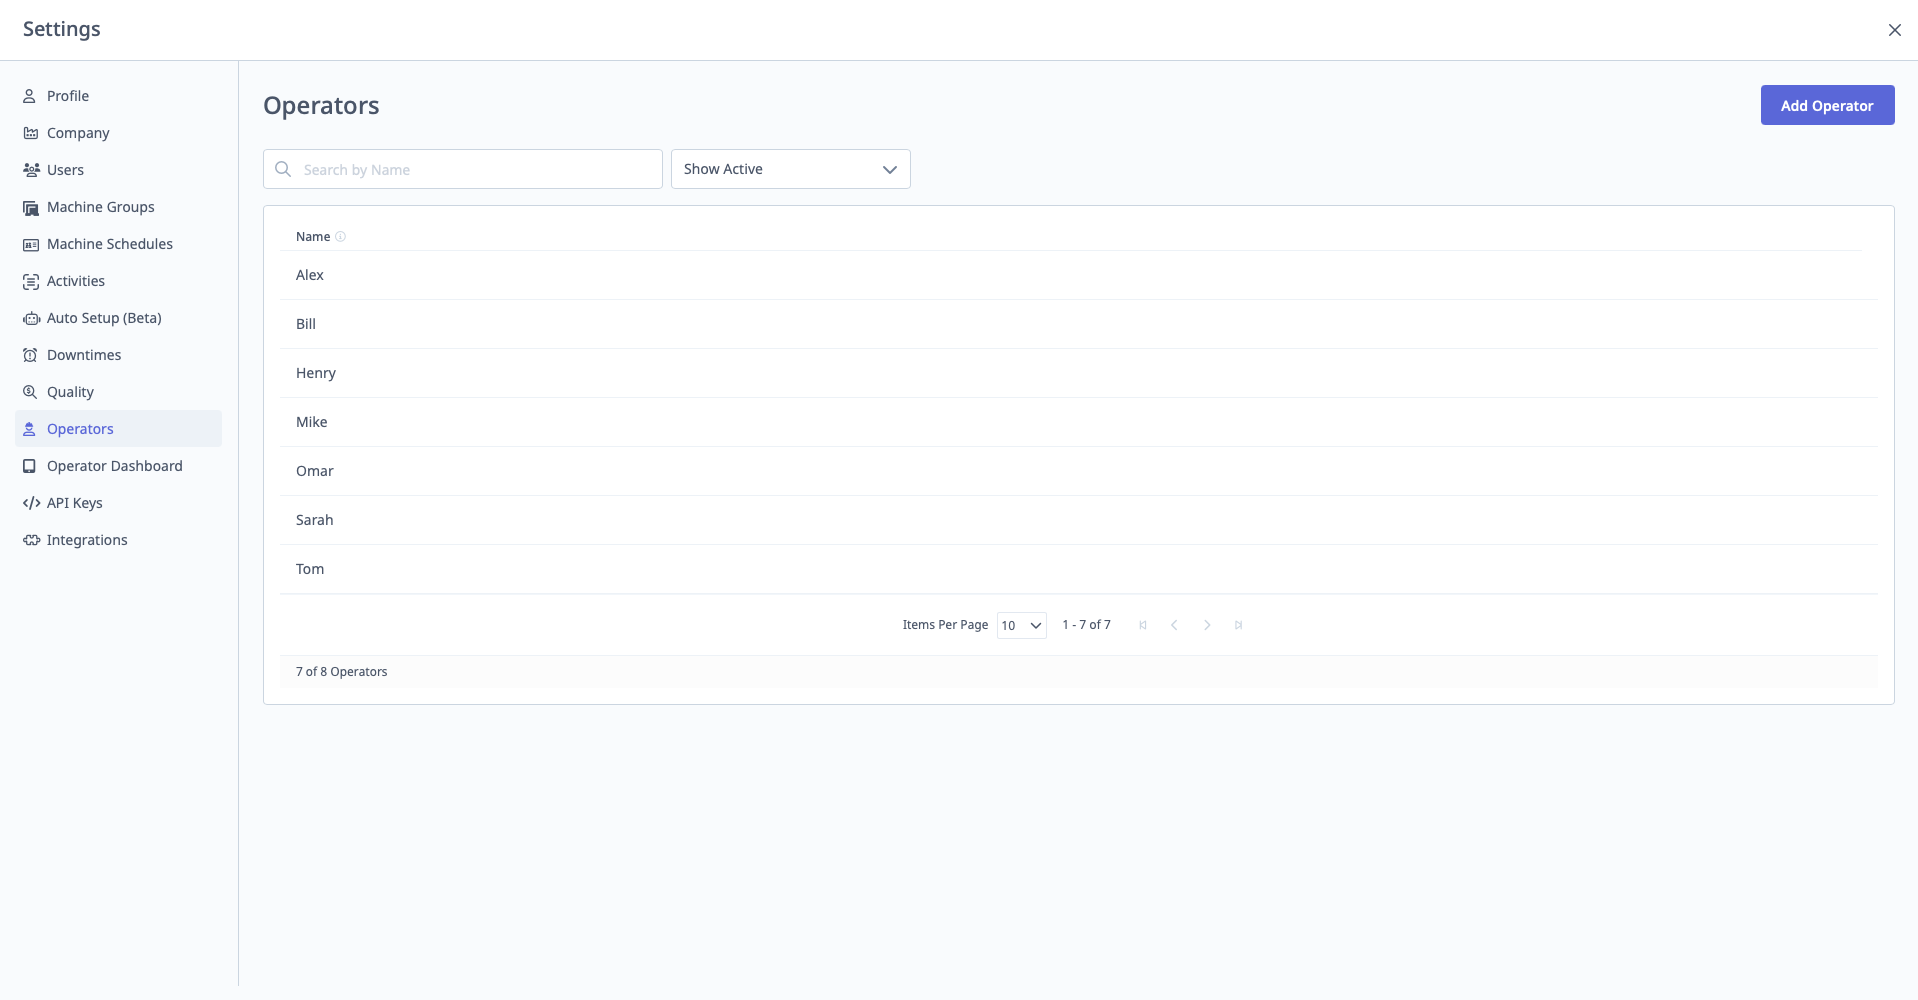
Adding Operators
Step-by-Step:
- Navigate to Settings → Operators
- Click "Add Operator"
- Enter Operator Name:
- Full name (e.g., "John Smith")
- Last name only (e.g., "Smith")
- Employee ID (e.g., "EMP-1234")
- Or nickname (e.g., "Johnny")
- Click "Save"
Important:
- Names must be unique
- Use consistent naming convention (e.g., always "FirstName LastName")
- Operator immediately appears on tablet sign-in list
Managing Operators
Editing Operators:
- Find operator in list
- Click Edit (pencil icon)
- Change name
- Click "Save"
Archiving Operators:
- Click Archive to remove from tablet sign-in list
- Historical data retained
- Can be unarchived later
Do Not Delete:
- Archiving is preferred over deleting
- Deleting removes operator but may break historical data links
Operator Runs
Correcting Operator Data: If operator forgot to log in or logged in incorrectly:
- Navigate to Production → Operator Runs
- Click "Add Operator Run" or "Edit" existing run
- Assign correct operator to time period
- Corrects historical data
See Also: Production & Analytics Guide
Operator Dashboard
What is Operator Dashboard Settings?
Operator Dashboard settings control the behavior and appearance of tablets on the shop floor.
Access: Settings → Operator Dashboard
Who Can Manage: Managers, Executives, IT Admins
General Settings
Access: Settings → Operator Dashboard → General
Available Toggles:
1. Enable/Disable Machine Switching
Purpose: Allow operators to switch between machines on tablet.
Options:
- Enabled: Operators can select different machine from dropdown
- Disabled: Tablet locked to one machine
Use Case: Disable if tablets are dedicated to specific machines (prevents confusion).
2. Force Machine Downtime Categorization
Purpose: Require operators to categorize downtime before proceeding.
Options:
- Enabled: Pop-up blocks tablet until downtime categorized
- Disabled: Pop-up can be dismissed (categorize later)
Use Case: Enable to ensure all downtime is categorized. Disable if operators frequently busy and need flexibility.
3. Remove Rejects from Part Count
Purpose: Subtract rejected parts from total part count display.
Options:
- Enabled: Part count shows only good parts
- Disabled: Part count shows total parts (good + rejected)
Use Case: Enable if you only want to display good parts to operators.
4. Enable Work Order Fields
Purpose: Allow operators to enter work order numbers on tablets.
Options:
- Enabled: Operators can add/edit work orders
- Disabled: No work order functionality
Use Case: Enable if integrating with ERP or tracking work orders.
See Also: Operator Dashboard Guide
5. Enable Operator Auto Sign Out at End of Shift
Purpose: Automatically log operators out when shift ends.
Options:
- Enabled: Operators logged out at shift end time (based on schedule)
- Disabled: Operators must manually log out
Use Case: Enable to ensure clean shift transitions.
Auto Downtime Settings
Access: Settings → Operator Dashboard → General
Two Timing Settings:
1. Initial Prompt Delay
Purpose: How long after downtime begins before toast notification appears.
Configuration:
- Enter delay in seconds (e.g., 10)
- Default: 10 seconds
Impact:
- Downtime begins at 2:00 PM
- Toast appears at 2:00:10 PM (after 10-second delay)
Use Case: Short delay filters out very brief stops (machine stops, immediately resumes).
2. Categorization Prompt Delay
Purpose: How long before full categorization prompt replaces toast.
Configuration:
- Enter delay in seconds (e.g., 30)
- Default: 30 seconds
Impact:
- Downtime begins at 2:00 PM
- Toast appears at 2:00:10 PM
- Full prompt appears at 2:00:30 PM (if not categorized via toast)
Toast vs. Full Prompt:
- Toast: Small notification in bottom right (can dismiss)
- Full Prompt: Larger prompt (blocks tablet if "Force Categorization" enabled)
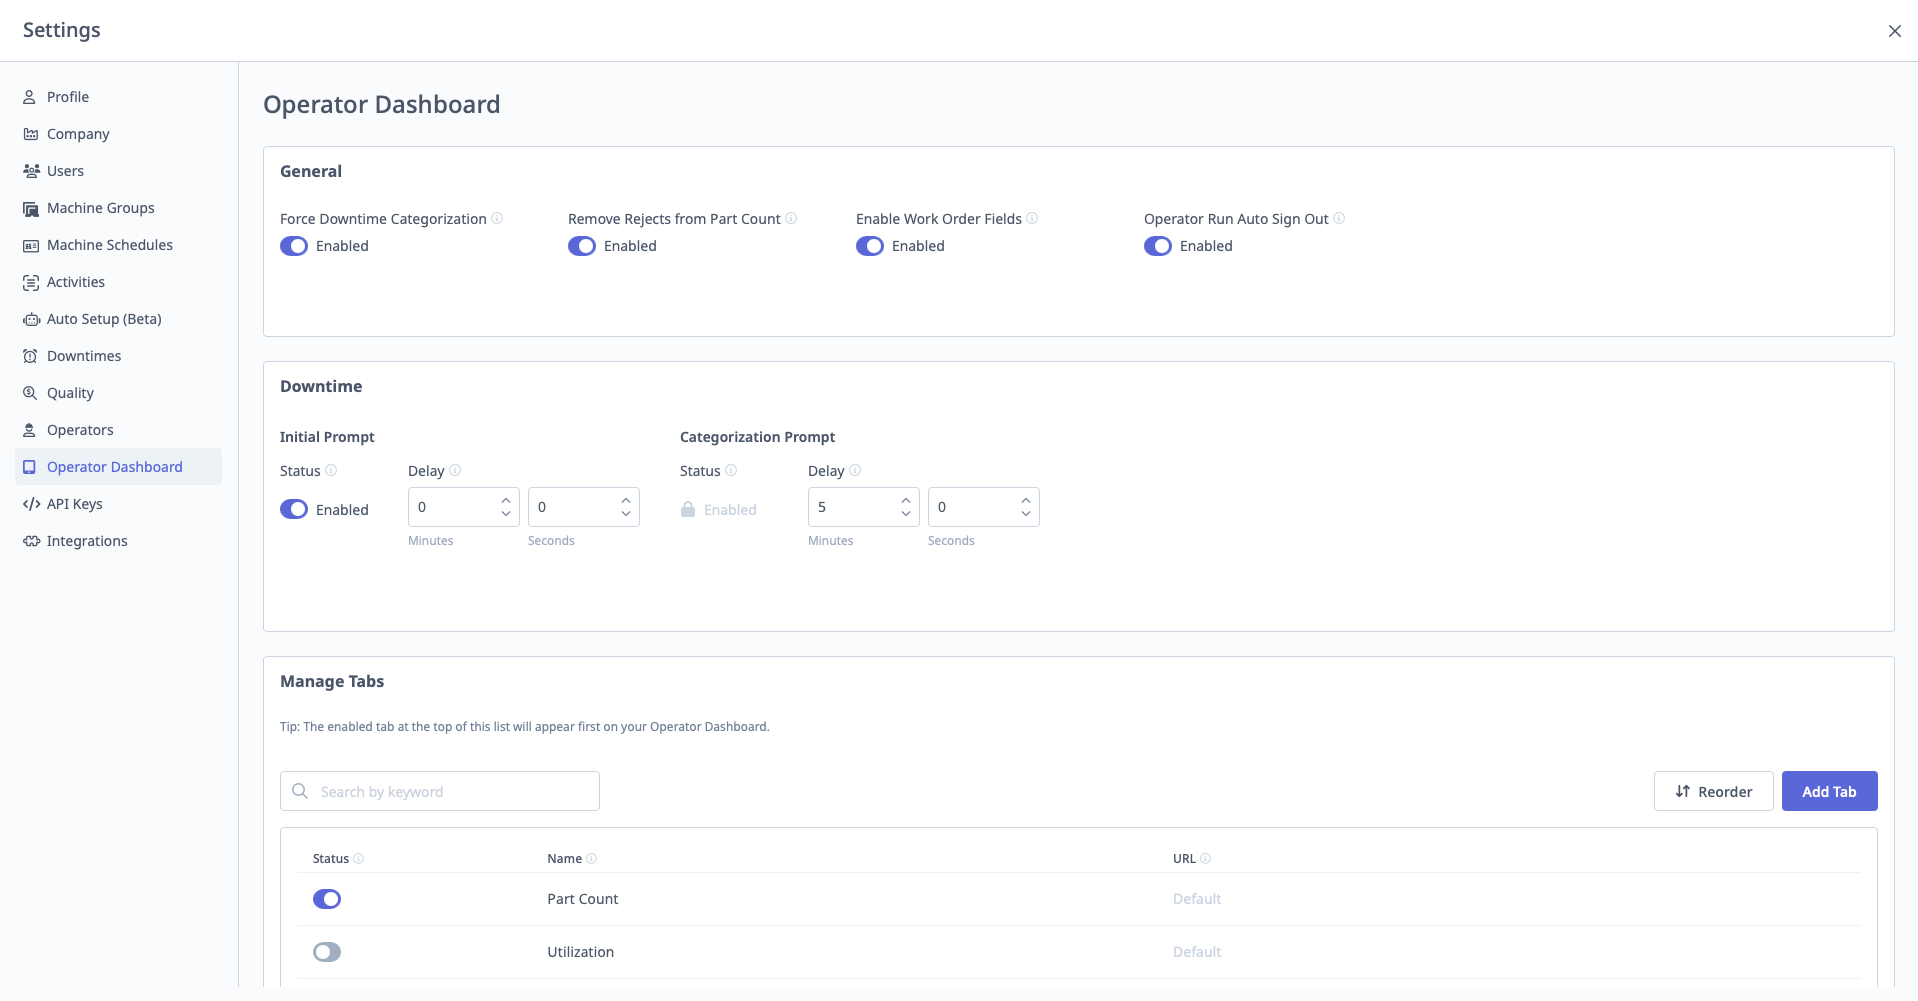
Manage Tabs
Access: Settings → Operator Dashboard → Manage Tabs
Purpose: Customize which tabs appear on Operator Dashboard tablets.
Default Tabs:
- Part Count
- Utilization
- All Downtime
- Active Alarms
- Parts Goal
- Current Cycle Time
- OEE
Managing Tabs:
Toggle Tabs On/Off:
- Navigate to Settings → Operator Dashboard → Manage Tabs
- Toggle each tab On or Off
- Click "Save"
Reorder Tabs:
- Drag and drop tabs to reorder
- Order on settings page = order on tablets
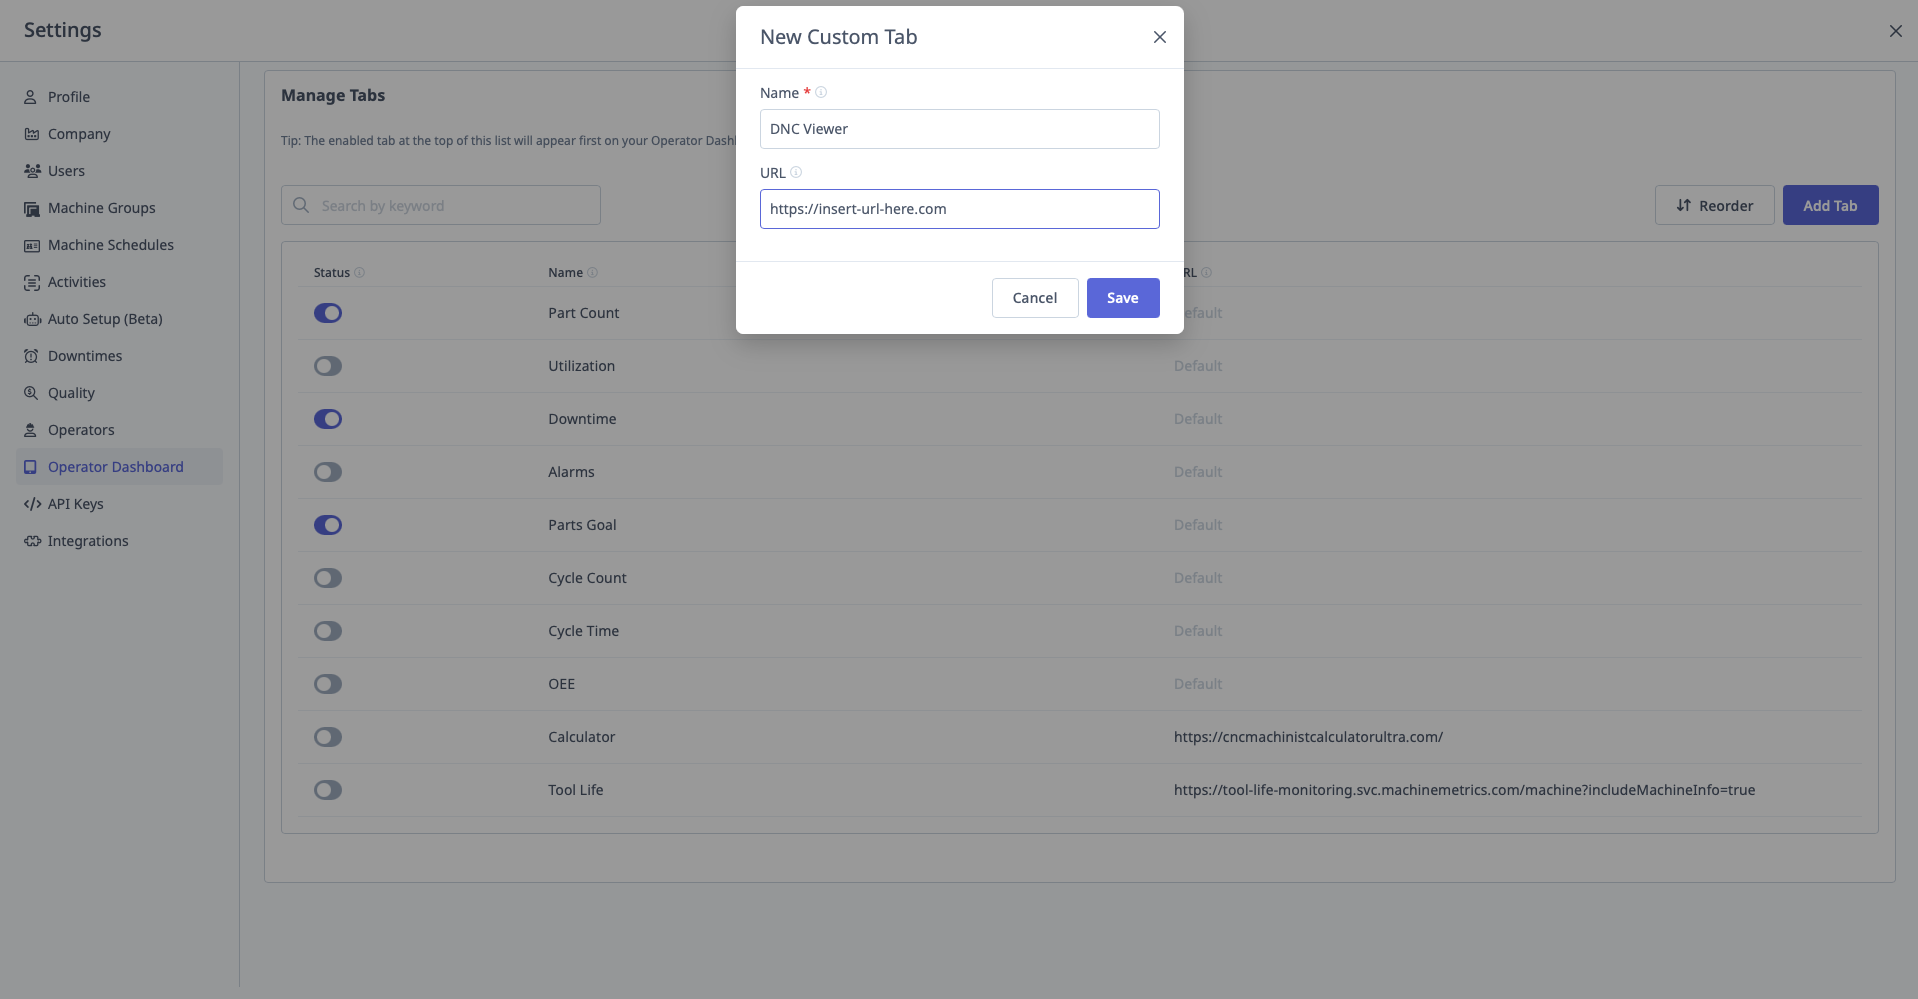
Adding Custom Tabs
Purpose: Embed external content (websites, documents, videos) on tablets.
Step-by-Step:
- Navigate to Settings → Operator Dashboard → Manage Tabs
- Click "Add Tab"
- Configure:
- Tab Name: Display name (e.g., "Work Instructions")
- URL: Full URL to content
- Icon (optional): Select icon for tab
- Click "Save"
Supported Content:
- Google Forms (checklists, surveys)
- Google Drive documents (PDFs, Docs)
- Websites (CNC calculators, reference tools)
- YouTube/Vimeo videos (embedded)
- Tool Life Monitoring Dashboard
- Any iframe-compatible content
Example: Adding Tool Life Monitoring Tab
One of the most popular custom tabs is the Tool Life Monitoring Dashboard, which allows operators to see tool life status directly on their tablet without leaving the Operator Dashboard.
Step-by-Step to Add Tool Life Tab:
- Navigate to Settings → Operator Dashboard → Manage Tabs
- Click "Add Tab"
- Enter the following:
- Tab Name:
Tool Life - URL: Your Tool Life dashboard URL (format:
https://app.machinemetrics.com/dashboards/[dashboard-id]) - Icon: Select the wrench or tool icon
- Tab Name:
- Click "Save"
How to Get Your Tool Life Dashboard URL:
- Go to Dashboards → Find your Tool Life dashboard
- Open the dashboard
- Copy the URL from your browser's address bar
- Use this URL when creating the custom tab
What Operators See:
Once configured, operators can tap the Tool Life tab on their tablet to see:
| Information | Description |
|---|---|
| Tool List | All tools for their machine |
| Life Remaining | Percentage or count remaining for each tool |
| Status Colors | Green (OK), Yellow (Warning), Red (Critical) |
| Time/Cycles Left | Estimated remaining usage |
Benefits for Operators:
- No navigation required — Tool life visible without leaving the Operator Dashboard
- Proactive tool changes — See when tools are approaching end of life
- Reduce scrap — Change tools before they fail and damage parts
- Stay informed — Quick glance during production without interruption
Tip: Position the Tool Life tab near the beginning of the tab order so operators can access it quickly.
Other Example Use Cases:
Custom Tab: "Setup Instructions"
URL: https://docs.google.com/document/d/abc123

Custom Tab: "Feeds & Speeds Calculator"
URL: https://www.cnccookbook.com/feeds-speeds-calculator/

Custom Tab: "Quality Checklist"
URL: https://docs.google.com/forms/d/xyz789
Limitations:
- Sites that block iframes won't work
- Authentication may be required (e.g., Google account login)
See Also: Operator Dashboard Guide, Dashboards Guide, and Tool Life Monitoring Guide
API Keys
What are API Keys?
API Keys allow external systems to access MachineMetrics data programmatically.
Access: Settings → API Keys
Who Can Manage: IT Admins, Executives
Use Cases:
- ERP integration (pull production data)
- Custom dashboards (external BI tools)
- Data warehouse sync
- Third-party applications
API Scopes
Purpose: Control what data the API key can access (principle of least privilege).
Available Scopes:
1. User
- Access: Full control of user profile
- Use Case: User management integrations
2. ERP Read
- Access: Read ERP integration data
- Use Case: View ERP-synced information
3. ERP Write
- Access: Write access for ERP integration
- Use Case: Create/update operations, work orders from ERP
4. Reporting Read
- Access: Read access for reportable data
- Use Case: Pull production reports, OEE data, downtime data
- Recommended: Most common scope for data export
5. Machine Read
- Access: Read machine information
- Use Case: Get machine list, status, configuration
6. Machine Write
- Access: Write access for machines
- Use Case: Create/update machines programmatically
7. Annotation (Downtime)
- Access: Read/write access for downtime categorizations
- Use Case: Auto-categorize downtime via external rules engine
8. Annotation Read
- Access: Read-only access for annotations
- Use Case: View downtime categorizations
9. Part Adjustment
- Access: Write access for part adjustments
- Use Case: Correct part counts programmatically
10. Gateway Read
- Access: Read machine information and support data
- Use Case: Edge Device diagnostics
11. Ingest Activity
- Access: Allow access to activities data
- Use Case: Ingest activity data from external systems
12. Operator
- Access: Write access for operators
- Use Case: Sync operator list from HR system
13. System Gateway
- Access: Manage Edge Devices
- Use Case: Configure Edge Devices programmatically
14. System Gateway Read
- Access: List available Edge Devices and status
- Use Case: Monitor Edge Device health
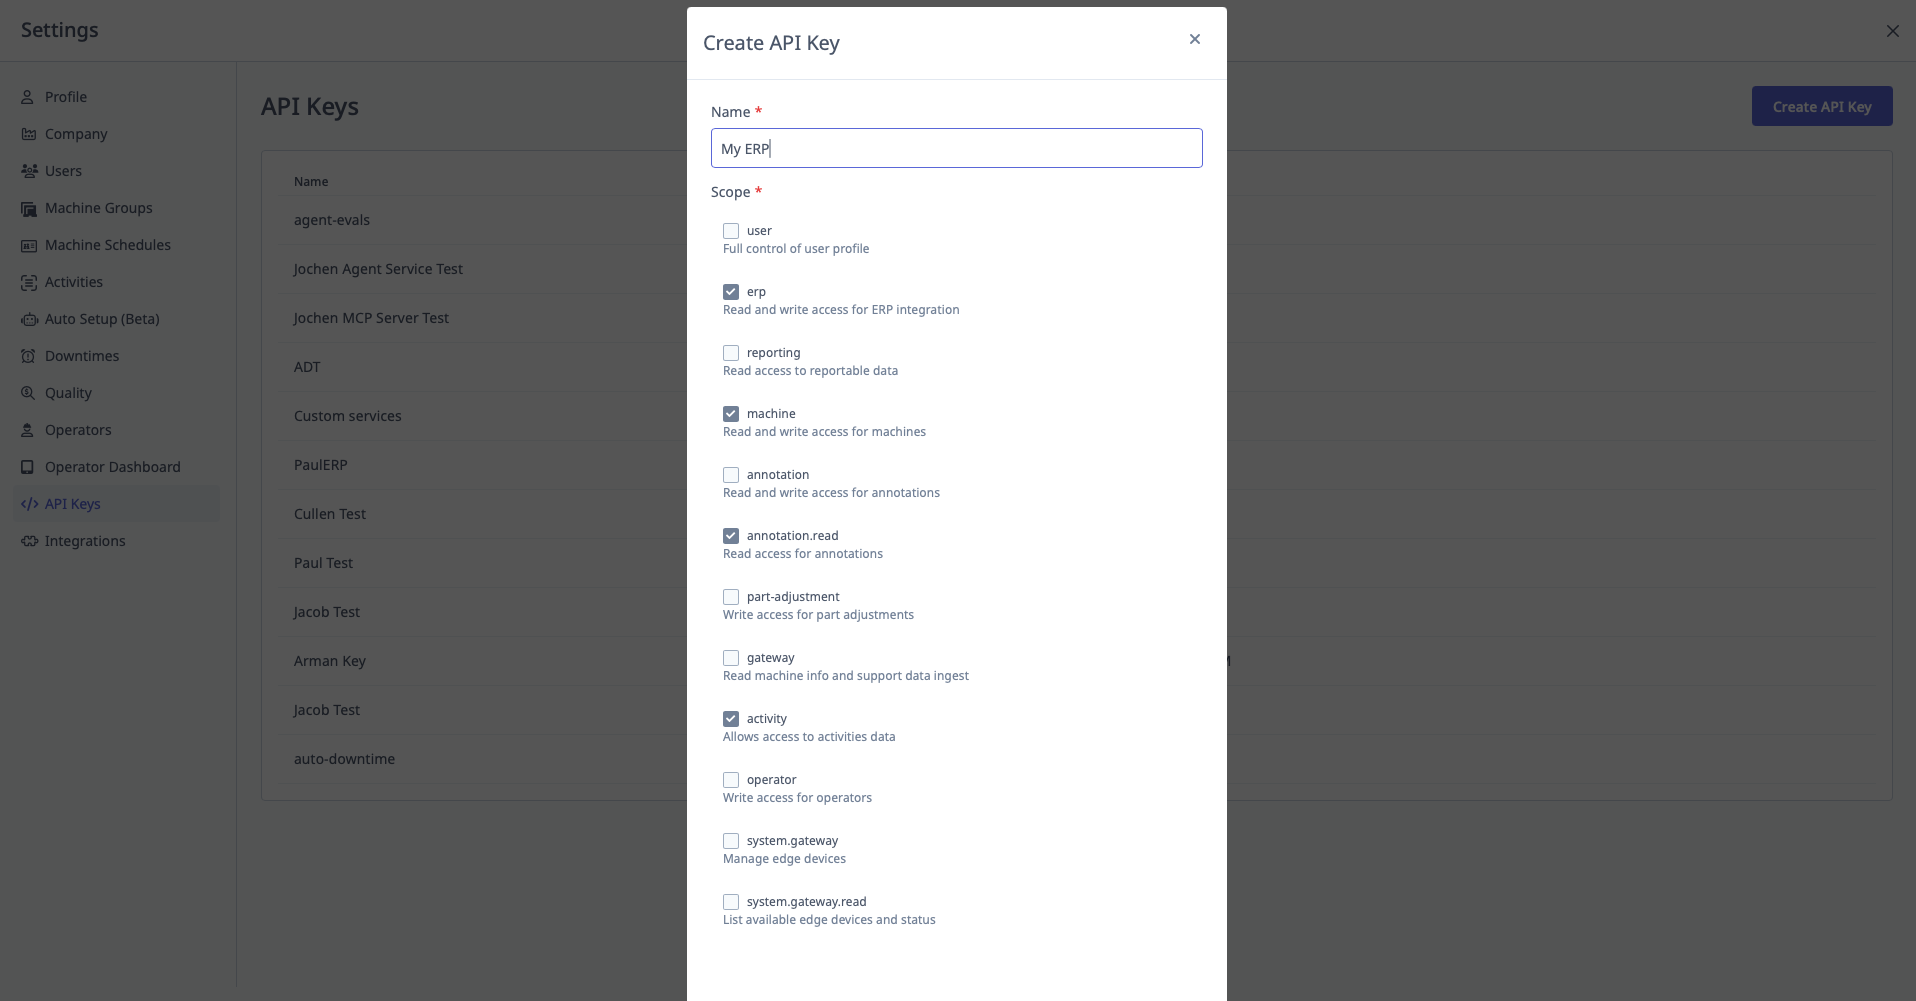
Creating API Keys
Step-by-Step:
- Navigate to Settings → API Keys
- Click "Add Key"
- Enter Key Name (descriptive, e.g., "ERP Integration - Read Only")
- Select Scope(s):
- Recommendation: Only select what you need
- Example: For reporting, select only "Reporting Read"
- Click "Save"
- API Key displayed (long alphanumeric string)
- IMPORTANT: Copy and store key safely (cannot be retrieved later)
- Click "Close"
Security Best Practice:
- Select minimum required scopes
- Create separate keys for different integrations
- Name keys descriptively
Example:
Key Name: "Power BI Dashboard - Reporting Read Only"
Scopes: Reporting Read
Use: Pull OEE and production data for Power BI dashboards
Managing API Keys
Viewing Keys:
- List shows:
- Key name
- Scopes assigned
- Created date
- Last used date
Revoking Keys:
- Find key in list
- Click "Revoke" or "Delete"
- Confirm revocation
- Key immediately invalid
Use Case for Revocation:
- Employee leaves (revoke their personal API key)
- Integration no longer used
- Security concern (key may be compromised)
Using API Keys
Authentication: Include API key in HTTP request header:
Authorization: Bearer YOUR_API_KEY_HERE
Example API Call (cURL):
curl -X GET "https://api.machinemetrics.com/v1/machines" \
  -H "Authorization: Bearer abc123def456..."
See MachineMetrics API Documentation:
- Full API documentation available at developer portal
- Endpoints for machines, production, downtime, quality, etc.
Integrations
What is Integrations?
Integrations is where you configure connections to external systems like ERP, MES, CMMS, and other platforms.
Access: Settings → Integrations
Who Can Manage: IT Admins, Executives
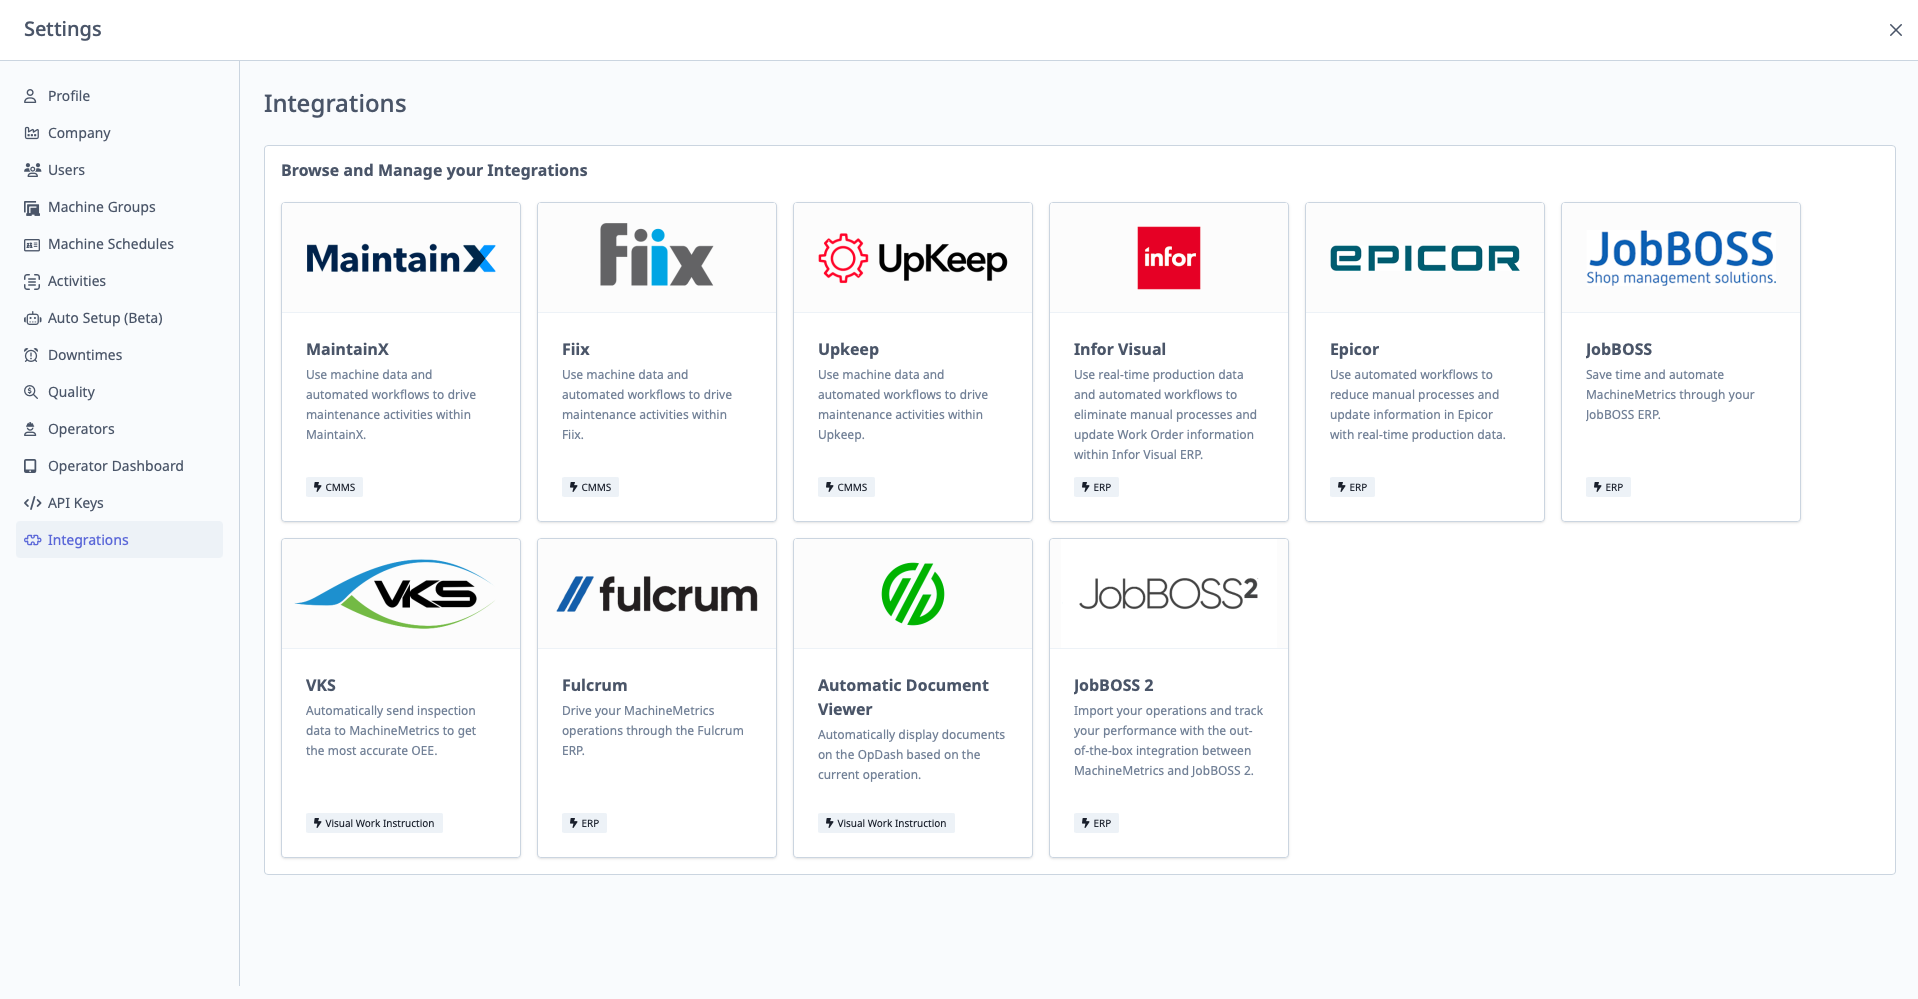
Supported Integrations
Common Integrations:
- MaintainX: CMMS (Computerized Maintenance Management System)
- ERP Systems: IQMS, E2, JobBOSS, SAP, etc.
- MES Systems: Factory MES, etc.
- Custom Integrations: Via webhooks or API
Configuring Integrations
General Process:
- Navigate to Settings → Integrations
- Find integration to configure
- Click "Configure" or "Connect"
- Follow integration-specific setup:
- Enter credentials (API keys, usernames, passwords)
- Configure sync settings (what data to sync, how often)
- Map fields (MachineMetrics fields → ERP fields)
- Click "Save" or "Connect"
- Test connection
Integration-Specific Setup: Each integration has unique configuration requirements. Consult integration-specific documentation or contact support.
MaintainX Integration (Example)
Purpose: Sync work orders between MachineMetrics and MaintainX CMMS.
Configuration:
- Navigate to Settings → Integrations → MaintainX
- Enter MaintainX API Key
- Configure sync settings:
- Create work orders in MaintainX for specific alarm codes
- Sync work order status back to MachineMetrics
- Click "Save"
Use Case: Alarm occurs → Workflow creates MaintainX work order → Maintenance receives notification → Completes work in MaintainX → Status syncs back to MachineMetrics.
Webhooks (Custom Integrations)
If your system isn't listed:
- Use webhooks (configured in Workflows)
- Or use API keys to build custom integration
See Also: Automations & Workflows Guide
Single Sign-On
What is Single Sign-On (SSO)?
Single Sign-On (SSO) allows users to log into MachineMetrics using their company's existing authentication system (Azure AD, Okta, Google Workspace, etc.).
Access: Settings → Single Sign-On
Who Can Manage: IT Admins, Executives
Prerequisites:
- SSO provider (Azure AD, Okta, Google Workspace, OneLogin, etc.)
- IT Admin or Executive role in MachineMetrics
Benefits of SSO
Why Enable SSO:
- Single Credentials: Users use same username/password for all company apps
- Centralized Management: IT manages users in one place (SSO provider)
- Security: Enforce company password policies, MFA, etc.
- Automatic Provisioning: Users added to SSO provider automatically get MachineMetrics access
SSO Configuration Requirements
Information Needed from SSO Provider:
1. SSO Provider Name
- Name of your SSO provider (e.g., "Azure AD", "Okta", "Google Workspace")
2. Client ID
- Unique identifier for MachineMetrics app in SSO provider
- Example:
abc123-def456-ghi789
3. Client Secret
- Secret key for authentication
- Example:
xyz789-abc123-mno456 - Important: Keep secret secure (like API keys)
4. Issuer URL
- Base URL of SSO provider
- Example (Azure AD):
https://login.microsoftonline.com/[tenant-id]/v2.0 - Example (Okta):
https://yourcompany.okta.com
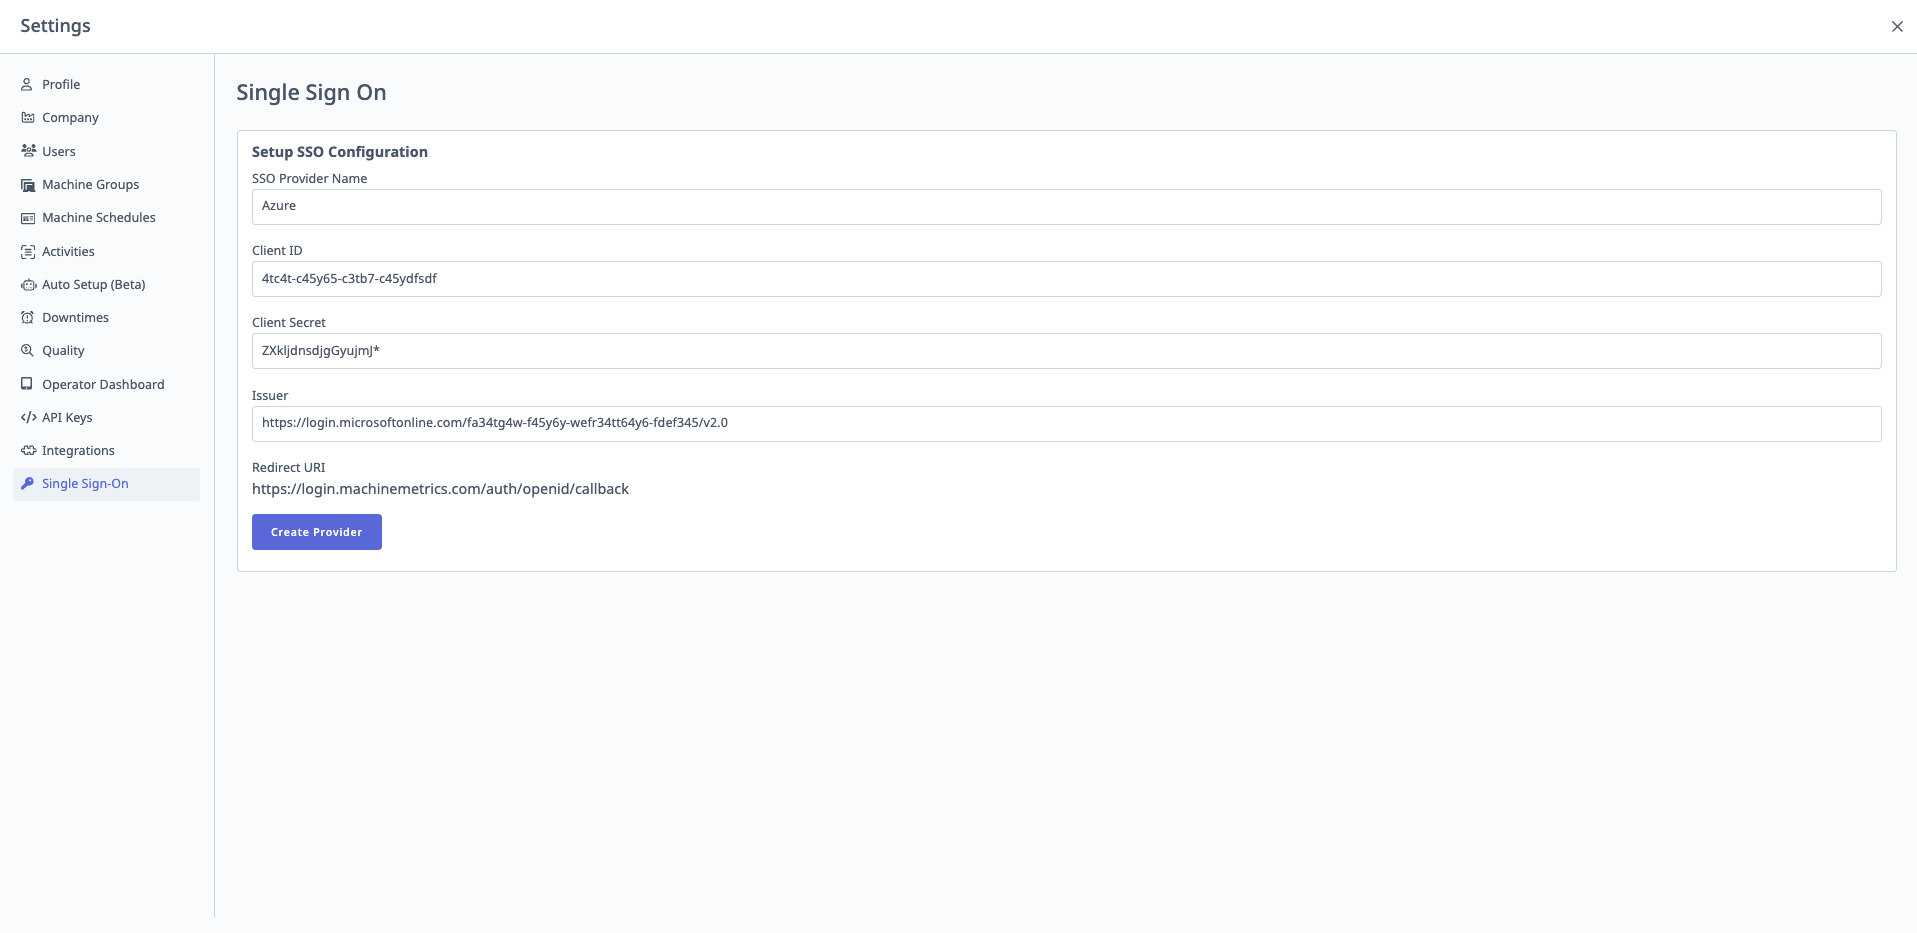
Configuring SSO
Step-by-Step:
- Navigate to Settings → Single Sign-On
- Click "Configure SSO"
- Enter configuration:
- SSO Provider Name: (e.g., "Azure AD")
- Client ID: From SSO provider
- Client Secret: From SSO provider
- Issuer URL: From SSO provider
- Click "Save"
- Click "Test SSO" to verify configuration
- If successful: SSO enabled for your company
After Enabling SSO:
- Login page shows "Sign in with [Provider]" button
- Users click button → Redirected to SSO provider → Authenticate → Redirected back to MachineMetrics
SSO Provider Setup
Each SSO provider requires app registration:
General Steps (Provider-Specific):
- Log into SSO provider admin console
- Create new application (MachineMetrics)
- Configure redirect URLs (provided by MachineMetrics support)
- Copy Client ID and Client Secret
- Enter in MachineMetrics SSO settings
Consult MachineMetrics Support:
- SSO setup is complex and provider-specific
- Contact support@machinemetrics.com for detailed setup guide
- Support can provide redirect URLs and assist with configuration
Managing SSO
Testing SSO:
- Click "Test SSO" button to verify configuration
- Opens new window with SSO login flow
- If successful: Configuration correct
Disabling SSO:
- Click "Disable SSO" to revert to standard login
- Users return to username/password login
Editing SSO Configuration:
- Click "Edit"
- Update Client ID, Client Secret, or Issuer URL
- Click "Save"
- Test again
Troubleshooting SSO
Common Issues:
"SSO login fails"
- Verify Client ID and Client Secret correct
- Check Issuer URL (correct tenant ID or domain?)
- Ensure redirect URLs configured in SSO provider
- Contact support for assistance
"Users not provisioning automatically"
- Check SCIM settings (if using automatic provisioning)
- Verify user roles mapped correctly
- May require additional SSO provider configuration
Edge Management
What is Edge Management?
Edge Management provides centralized monitoring and administration of all edge devices in your MachineMetrics deployment. Edge devices are the on-premise gateways that connect machines to the MachineMetrics Cloud.
Access: Settings → Edge Management (or navigate to the Edge Management page from the main menu)
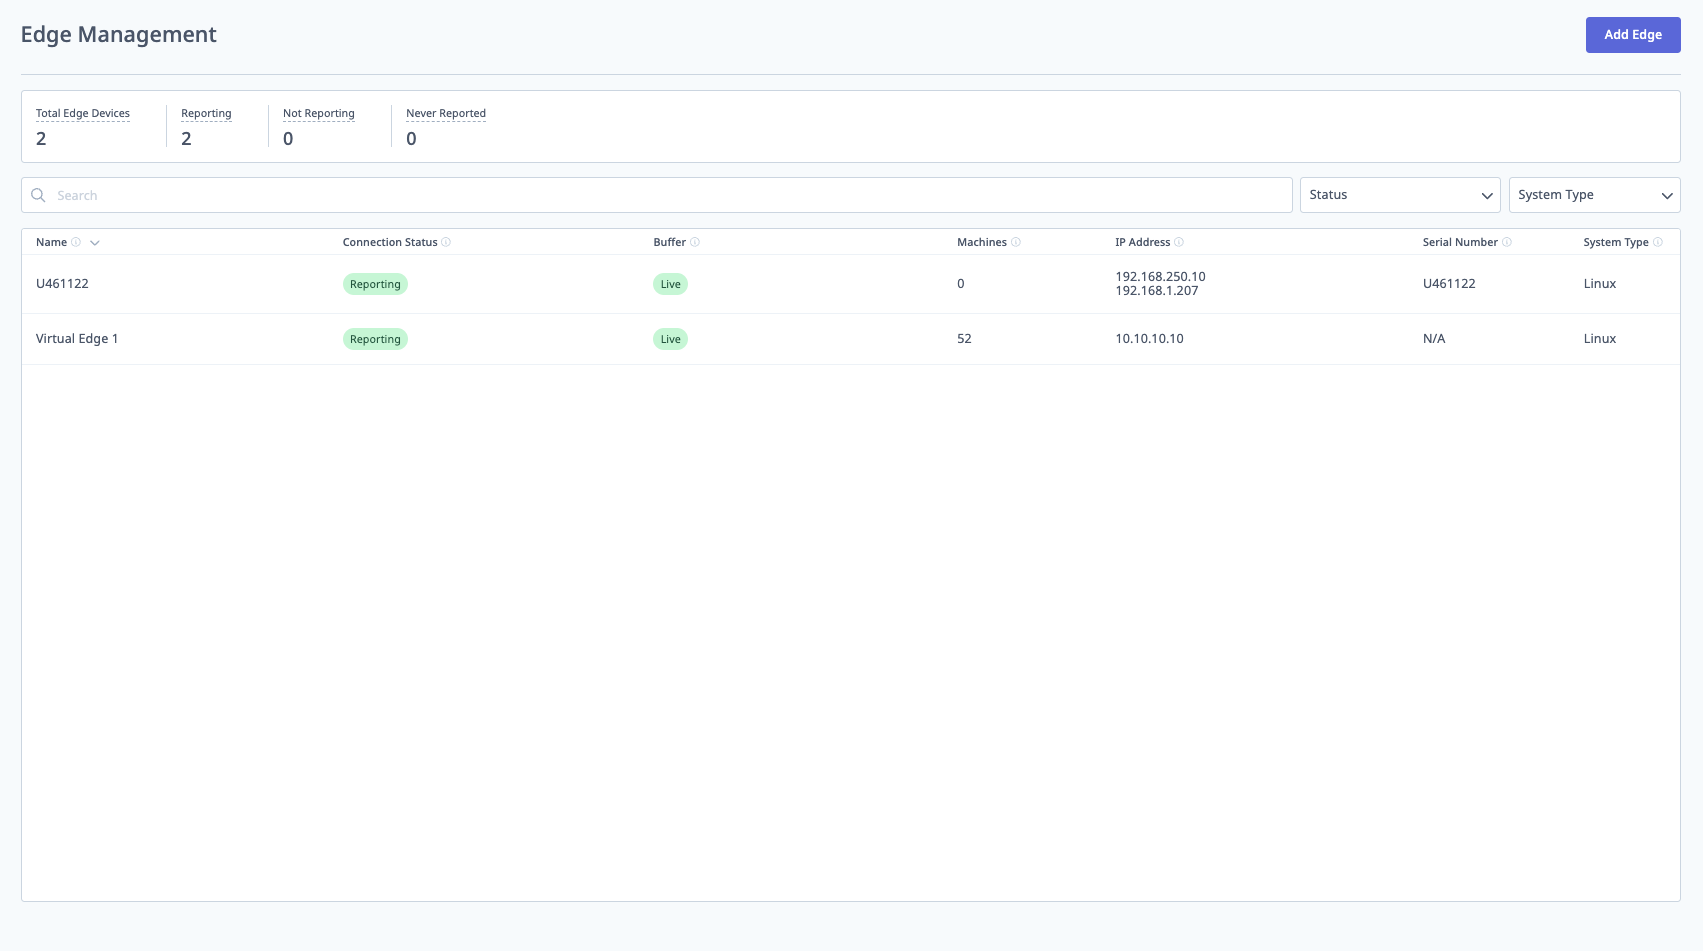
The Edge Management page displays all edge devices with their key metrics: connection status (green "Reporting" indicator), buffer status (showing data queue health), number of machines connected to each edge, IP addresses, serial numbers, and system type (Linux). The summary at the top shows total edge devices (2), reporting status (2), not reporting (0), and never reported (0). This centralized view allows administrators to monitor edge device health and connectivity across the entire deployment.
Key Metrics Displayed
Connection Status:
- Reporting (Green): Edge is actively connected and sending data
- Not Reporting (Red): Edge has stopped reporting (connectivity issue)
- Never Reported (Gray): Edge has been added but never connected
Buffer:
- Live: Data is flowing normally, no backlog
- Number (e.g., 52): Number of data points queued (indicates network or processing delay)
- High buffer numbers may indicate connectivity issues or high data volume
Machines:
- Total number of machines configured on each edge device
- Click the number to see which machines are connected to that edge
IP Address:
- Network IP address(es) of the edge device
- Multiple IPs indicate multiple network interfaces (machine network + internet)
Serial Number:
- Unique identifier for physical edge devices
- Virtual edges may show "N/A"
System Type:
- Operating system running on the edge (typically Linux)
Edge Management Actions
Adding New Edge Devices:
- Click Add Edge button (top right)
- Follow the edge device setup wizard
- See Edge Device Setup Guide for detailed instructions
Viewing Edge Details:
- Click on edge device name
- View detailed metrics:
- Connection history
- Machine assignments
- Network configuration
- Version information
- Health status
Troubleshooting Edge Issues:
If an edge shows Not Reporting:
- Check physical connectivity (cables, power)
- Verify network access (internet connection)
- Check firewall rules (see Network Requirements)
- Review edge device logs in detailed view
If Buffer is high:
- Check internet bandwidth
- Verify no network throttling
- Check if data collection rate is too high
- Contact support if buffer doesn't clear
Best Practices
Naming Edge Devices:
- Use descriptive names indicating location or purpose
- Examples: "Shop-Floor-Building-A", "Virtual-Edge-1", "Mill-Department-Edge"
Monitoring:
- Regularly check Edge Management page for connectivity issues
- Set up alerts for edge device failures (via Automations & Workflows)
Network Configuration:
- Ensure edge has reliable internet connection
- Use wired Ethernet (not WiFi) for production environments
- Assign static or reserved DHCP IP addresses
Capacity Planning:
- Physical edges can typically handle 50-100 machines
- Virtual edges depend on host resources
- Monitor buffer levels to identify capacity issues
Best Practices
User Management
1. Assign Appropriate Roles
- Don't give everyone Executive role
- Use Supervisor for floor leads, Manager for operations managers
- Reserve IT Admin for IT department only
2. Review User List Regularly
- Deactivate accounts for departed employees
- Audit roles quarterly (do users still need access?)
3. Use SSO if Available
- Centralized management
- Better security (company password policies, MFA)
Machine Organization
1. Create Logical Machine Groups
- Group by type (CNC Mills, CNC Lathes, Manual Welding)
- Or by location (Building A, Building B)
- Or by product line (Aerospace, Automotive)
2. Assign Appropriate Downtime Categories to Groups
- CNC machines: Tool Change, Setup, Material Unavailable
- Manual machines: Operator Unavailable, Manual Operations
- Don't show irrelevant categories (reduces clutter on tablets)
3. Name Machines Consistently
- Use format: "[Type]-[Number]" (e.g., "Mill-003", "Lathe-CNC-104")
- Or: "[Brand]-[Model]-[Number]" (e.g., "Haas-VF3-001")
- Avoid generic names ("Machine 1")
Schedules and Shifts
1. Define Shifts Before Going Live
- OEE calculations depend on scheduled time
- Without shifts, scheduled time = 24/7 (unrealistic)
2. Use Attended vs. Unattended Appropriately
- Attended: Shifts with operators present
- Unattended: Overtime or weekend shifts without operators
3. Review Shifts When Schedules Change
- Update shifts if company changes shift times
- Affects OEE calculations (historical data recalculates)
Downtime and Quality
1. Create Clear, Specific Categories
- "Tool Change" (clear) vs. "Tooling" (vague)
- Use hierarchy for specificity: "Tooling | Tool Change | End of Life"
2. Limit Number of Categories
- Too many categories = confused operators
- Aim for 10-20 top-level categories, with subcategories as needed
3. Train Operators on Categorization
- Show operators why it matters (improvements result from their data)
- Demonstrate on tablets during onboarding
API Keys and Integrations
1. Use Minimum Required Scopes
- Only select scopes you need
- Reduces security risk if key compromised
2. Name Keys Descriptively
- Include purpose and scope in name
- Example: "Power BI - Reporting Read Only"
3. Store Keys Securely
- Use password manager or secrets management system
- Don't hardcode in scripts or commit to version control
4. Rotate Keys Periodically
- Create new key, update integrations, revoke old key
- Recommended: Annually or after employee departure
Operator Dashboard
1. Start with Default Tabs, Customize Later
- Learn what operators actually use
- Remove unused tabs after observing usage
2. Test Custom Tabs Before Rolling Out
- Verify content loads on tablets
- Check mobile responsiveness (some sites don't work well on tablets)
3. Place Tablets Strategically
- Easily accessible without interrupting workflow
- Protected from chips, coolant, debris
Getting Help
Common Questions
"I'm not receiving workflow notifications"
- Check Profile settings → Notification preferences (default is "Never")
- Verify mobile number entered (if using text notifications)
- Check notification schedule (are you outside configured hours?)
"Operators don't see downtime categories on tablets"
- Check Machine Groups → Verify downtime categories assigned to machine's group
- Check Downtimes → Verify categories not archived
"OEE seems wrong / Availability too low"
- Check Machine Schedules → Verify shifts configured (without shifts, scheduled time = 24/7)
- Check Downtimes → General Settings → "Exclude planned downtime from production metrics" setting
- See Understanding Your Data Guide
"API key not working"
- Verify correct scope selected when creating key
- Check API key copied correctly (no extra spaces or characters)
- Ensure key not revoked
- Test with simple API call (e.g., list machines)
"SSO login fails"
- Verify Client ID and Client Secret correct
- Check Issuer URL (correct format for your SSO provider?)
- Contact MachineMetrics support for SSO troubleshooting
"Auto Setup not activating"
- Verify APM enabled for machine
- Check machine reporting program headers
- Ensure consistent cycle times (highly variable cycles won't trigger transition to Production)
Before Contacting Support
Gather Information:
- Which setting you're configuring (screenshot helpful)
- What you expected vs. what happened
- User role (do you have permission to edit this setting?)
- Steps to reproduce issue
Try These Steps:
- Refresh page (F5 or Cmd+R)
- Clear browser cache
- Try different browser (Chrome recommended)
- Verify permissions (IT Admin, Manager, or Executive role for most settings)
- Check system status (status.machinemetrics.com)
Contact Support
MachineMetrics Support:
- Email: support@machinemetrics.com
- Include:
- Setting you're trying to configure
- Screenshot of issue or error message
- Your role in MachineMetrics
- Expected behavior vs. actual behavior
For Training:
- Request system settings training session
- Ask about best practices for your industry or use case
- Schedule administrator onboarding for new team members
For SSO Setup:
- SSO setup is complex and provider-specific
- Contact support for detailed setup guide specific to your SSO provider
- Support can provide redirect URLs and configuration assistance
Next Steps:
- Configure your profile: Profile Settings
- Set up users and roles: Users Management
- Organize machines: Machine Groups and Machine Schedules
- Configure downtime and quality: Downtimes and Quality
- Set up integrations: API Keys, Integrations, Single Sign-On
Questions? Contact support@machinemetrics.com