Connectivity Validation Guide
This guide walks you through validating three critical elements of your MachineMetrics connectivity: Execution Signal, Part Count, and Program Headers. Completing these checks ensures your data in MachineMetrics accurately reflects what is happening on the shop floor and gives you confidence that the metrics you are making decisions from are correct.
1. Validating Your Execution Signal
What to Look For
The Execution signal tells MachineMetrics whether the machine is actively running a program (cutting, spinning, moving) or idle. To validate it, navigate to the Timeline view for the machine in question and compare what you see against your knowledge of how that machine has been operating.
A healthy execution signal will show solid green (Active) blocks during periods when the machine was cutting, with idle gaps in between cycles. The pattern should visually match your expectations of the shift.
A suspect execution signal will show only thin slivers of green even when you know the machine was running all day, or the entire timeline will be flat (no active signal at all). If the machine clearly ran a full shift but MachineMetrics shows mostly idle, that is a strong indicator of a configuration issue.
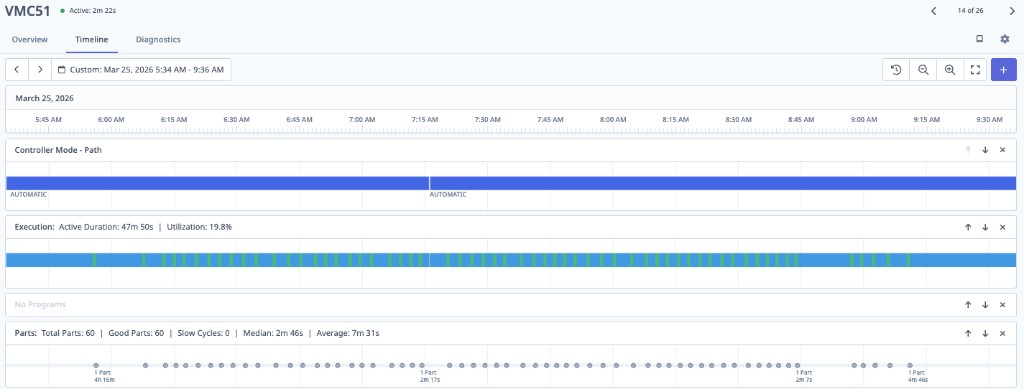
Suspect execution — thin green slivers during what should be active cutting cycles
How to Confirm
The most reliable way to confirm whether your execution signal is correct is to stand in front of the machine with a phone or laptop and compare real-time machine behavior to what MachineMetrics is reporting. Follow these steps:
- Open the machine's Timeline in MachineMetrics on your device.
- Start a program cycle and observe whether the execution bar turns green (Active) within a few seconds.
- The definitive test: press the E-Stop on the machine. MachineMetrics should immediately reflect the machine as stopped/idle. If it does not, the execution signal source needs to be reviewed with your MachineMetrics onboarding engineer.
If you notice the execution shows only small slivers of activity on a machine with multipath (multiple spindles or axes), this can sometimes be expected behavior — however, if you are unsure, contact support@machinemetrics.com and we will investigate.
2. Validating Your Part Count
Reading the Timeline
The Timeline is the fastest way to assess part count health. Look at the Parts row and review the spacing between count events, and compare the Median and Average cycle time values.
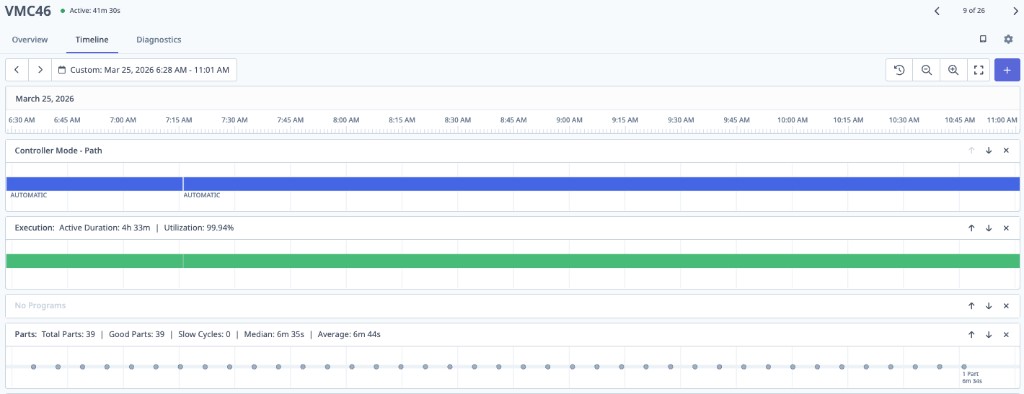
Good part count — evenly spaced count events with closely matching Median and Average cycle times
Signs of a healthy count: Evenly spaced count events across the timeline, with Median and Average cycle times that are close to each other. This indicates the machine is incrementing the counter consistently at end-of-cycle.
Signs of a bad count: Sporadic or clustered count events, very short cycle times (e.g., 0.999s or 1s), and a large gap between Median and Average. This is a telltale sign that the counter source is not behaving as expected.
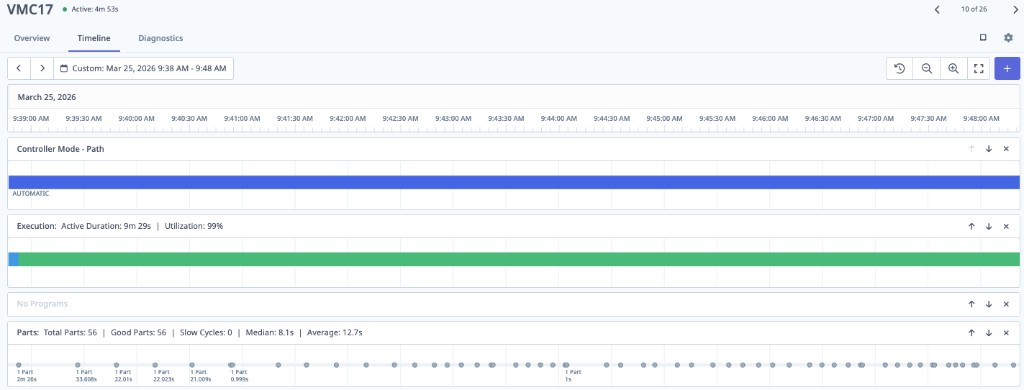
Bad part count — sporadic counts, very short sub-second cycle times, inconsistent spacing
First Step: Check the Source Counter on the Machine
Whenever you suspect a part count issue, always start at the machine controller, not in MachineMetrics. MachineMetrics reads the counter value that the CNC exposes — if that counter is wrong, MachineMetrics will be wrong. Go to the machine and verify that the counter on the control screen is incrementing correctly at end-of-cycle, once per finished part. If operators are manually adjusting the counter value, that must be corrected at the source.
If correcting the machine counter is not feasible, you may need an alternative counting method. The right approach depends on your machine type and connectivity protocol — see below for guidance by machine type.
Part Counting by Machine Type
Haas
MachineMetrics uses the M30 counter by default. Verify on the control that this counter is incrementing correctly at the end of each cycle. If your program uses M99 to loop, make sure Setting 118 is enabled so that M99 loops also increment the counter.
See the Haas Connectivity Guide for full details.
FANUC
MachineMetrics relies on the machine counting at M30, or at the M code defined in Parameter 6710. If your program loops, you will need a dedicated M code and the correct parameter configuration, or you can increment the counter directly using the system variable command:
#3901=#3901+1
See the FOCAS Connectivity Guide for full details.
MTConnect
Because MTConnect operates across many different machine vendors, it is critical that the machine is counting correctly and that the MTConnect agent is outputting the correct part count data element. Verify the counter on the control and confirm it matches what MachineMetrics is reading.
See the MTConnect Connectivity Guide for full details.
OPC-UA
Because OPC-UA works across many vendors, you must ensure you have configured the correct tag that mirrors the machine's part counter. Identify the counter on the CNC screen and verify that the tag configured in MachineMetrics is reading that same value.
See the OPC-UA Connectivity Guide for full details.
Mazak
The counting method depends on whether you are using Mazatrol or ISO programming:
- Mazatrol: There is a parameter on the END line of the program that controls counting. Verify it is set to increment the counter at end-of-cycle.
- ISO programming: Use the macro variable command to increment the counter:
#3901=#3901+1
See the Mazak Connectivity Guide for full details.
Digital I/O
Part counting via Digital I/O requires a signal wired to the MachineMetrics I/O device that goes high once per completed part. To validate, go to Diagnostics in MachineMetrics and monitor the I/O signal in real time. Confirm that it pulses high at the expected moment in the cycle. If the signal is not triggering, investigate the wiring to the I/O device and verify the output signal at the machine's PLC or relay.
See the Digital I/O Connectivity Guide for full details.
3. Validating Program Headers
Program headers are about good CNC programming hygiene. MachineMetrics reads the opening comment of your CNC program and displays it as the active part or operation name on the dashboard. This gives your team real-time visibility into exactly what is running on each machine.
How Program Headers Work
The first comment in your CNC program (following the program number line) is used as the program name displayed in MachineMetrics. Structure it to include the information that is most meaningful to your team — typically the part number and operation.
Example:
%
O1234(R-400147 OP20)
In this example, MachineMetrics would display R-400147 OP20 as the active program name, making it easy to identify the part number and operation at a glance.
Best Practices
- Include the part number and operation (e.g., OP10, OP20) in the opening comment of every program.
- Keep the comment concise — it will be displayed in dashboard tiles and reports.
- Apply this format consistently across all programs to ensure reports and production run data are clean and identifiable.
- If you need to update existing programs, contact support@machinemetrics.com or your Solution Delivery Manager (SDM) for guidance on the best approach for your CNC control type.