Okuma over MTConnect
Protocol: MTConnect · Agent port: 5000 · Verify: http://<machine-ip>:5000/current · Cable: the Ethernet port on the control panel or inside the cabinet.
For where the cable goes and how to set the control's IP, subnet and gateway, see Physical Connection in the MTConnect overview.
Okuma controls expose MTConnect through an on-control agent. The OSP-P500 differs enough from earlier controls to warrant its own section below.
If you want OPC-UA on an OSP-P500 instead, that is a separate licensed option — see Okuma OSP-P500 over OPC-UA.
Enabling MTConnect
Compatibility Check:
-
Determine Control Type
- OSP 300: Best MTConnect support
- OSP 200: Requires THINC API update + MTConnect
- OSP 100-II: Requires THINC API update + MTConnect
- Other OSP 100: NOT supported
-
Use Scout Tool
- Visit MyOkuma.com
- Use Scout tool to verify compatibility
- Tool will indicate if updates are needed
-
Check Compatibility Chart
Accessing Windows:
- Press CTRL + /// to access Windows Start button
- From here you can access File Explorer, applications, etc.
Installing/Updating MTConnect:
-
Check Current Installation
- Press CTRL + ///
- Navigate to Programs → Okuma → MTConnect
- If not present: needs installation
-
Install from THINC App Store
- OSP 300: Install directly from THINC App Store
- Download MTConnect Agent/Adapter
- Follow on-screen installation prompts
-
Update THINC API (if needed)
- OSP 200 and OSP 100-II require THINC API update first
- Must be done by Okuma dealer
- Contact your dealer for this service
Enable Monitoring Tags:
⚠️ Critical Step: Even with MTConnect installed, monitoring must be enabled.
- Press CTRL + /// (access Windows)
- Select Programs → Okuma → Okuma MTConnect Adapter Application
- Enter credentials:
- Username:
Administrator - Password:
okuma+osp
- Username:
- Select Configuration tab
- Click Tags Configuration button
- Check "Enable Monitoring Tags"
- Verify data items you want to monitor are also checked
- Click Save & Close
- Restart machine for changes to take effect
Enabling Macro Variable Monitoring:
The Configurations tab also controls which common (macro) variables the adapter exposes over MTConnect. This is required if you need part counting via common variables or any other program-driven variable data.
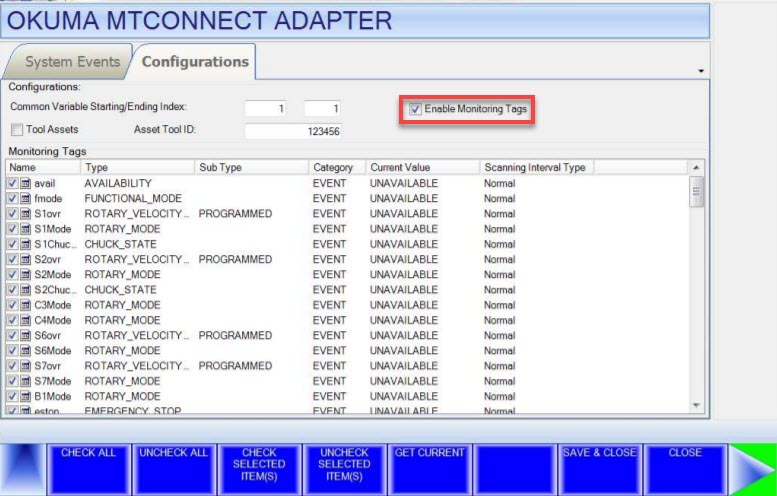
- On the Configuration tab, locate the Common Variable Starting/Ending Index fields at the top of the screen
- Enter the starting index of the variable range you want to monitor (e.g.,
500) - Enter the ending index of the range (e.g.,
520) - Click Save & Close
Set the range as narrow as possible — only include the variables actually used by your programs. A range like 500–520 is typical for part counting setups.
If you are using a common variable for part counting (e.g., VC500), the variable index must fall within this range or MachineMetrics will not be able to read it.
If the Common Variable Starting/Ending Index fields or the Tool Assets checkbox are not visible on the Configurations tab, your version of the Okuma MTConnect Adapter is outdated. Download and install the latest version from MyOkuma.com to access these options.
Port Configuration:
- Okuma typically uses port 5000
- Verify in MTConnect configuration utility
Part Counting:
See Part Counting with Common Variables section for configuring common variables if automatic counting doesn't work.
Okuma OSP-P500
The OSP-P500 is a newer Okuma control with a different navigation path than older OSP controls. MTConnect is built in — no THINC App Store installation needed.
Protocol: MTConnect | Default Port: 5000 | URL: http://<machine_ip>:5000/current
Prerequisites:
- Ethernet cable connected from the machine control to the customer's network
- Network IP address or DHCP information from the customer's IT team
- Machine serial number
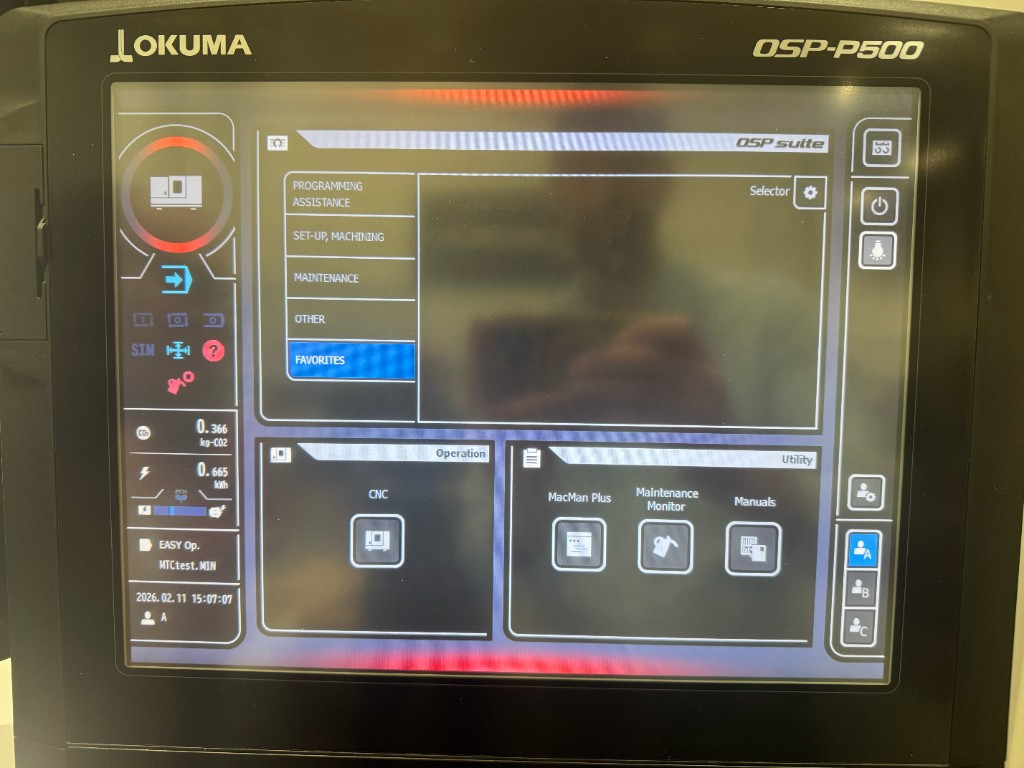
Step 1: Access the CNC Screen
From the machine homepage (OSP Suite), press CNC in the lower-left Operation panel to open the conventional CNC operation screen.
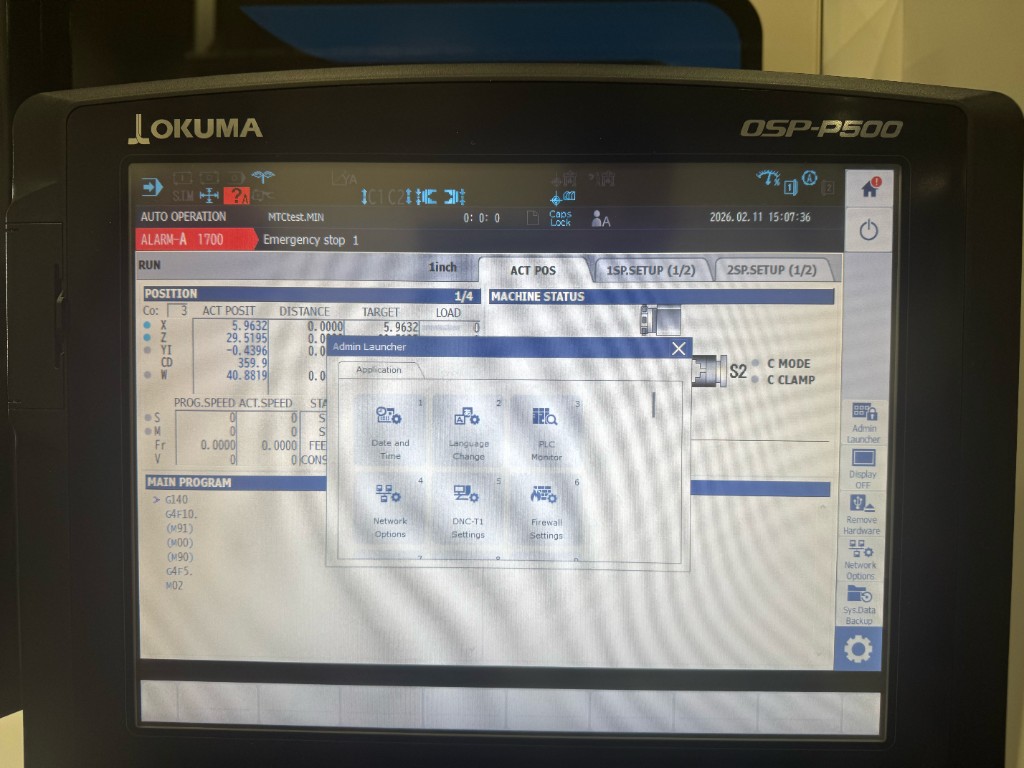
Step 2: Open Admin Launcher
- On the CNC screen, locate the puzzle piece icon in the lower-right sidebar
- Tap it to open the utility menu
- Tap the gear icon (⚙) to open settings
- Select Admin Launcher
The Admin Launcher window will open with configuration options including Date and Time, Language Change, PLC Monitor, Network Options, DNC-T1 Settings, and Firewall Settings.
Step 3: Configure the Network / IP Address
- In the Admin Launcher, select Network Options (item 4)
- Select the Network Interface
- The Windows Internet Protocol (TCP/IP) Settings page will appear
- Configure the IP address:
- DHCP: Select "Obtain an IP address automatically"
- Static IP: Enter the IP address, subnet mask, and default gateway provided by the customer's IT team
- Click OK and close the network settings
The machine must be on the same network/subnet as the MachineMetrics Edge device, or have a route configured between them.
Step 4: Verify Firewall Settings
The OSP-P500 has a built-in firewall (OSP-FIREWALL) that controls which protocols can communicate with the control. MTConnect must be enabled here.
- In the Admin Launcher, select Firewall Settings (item 6)
- The OSP-FIREWALL screen will open showing the list of firewall rules
- Confirm MTConnect-Agent is checked/enabled in the rules list
- If it is not enabled, check the box and press Apply
- Press Quit to close
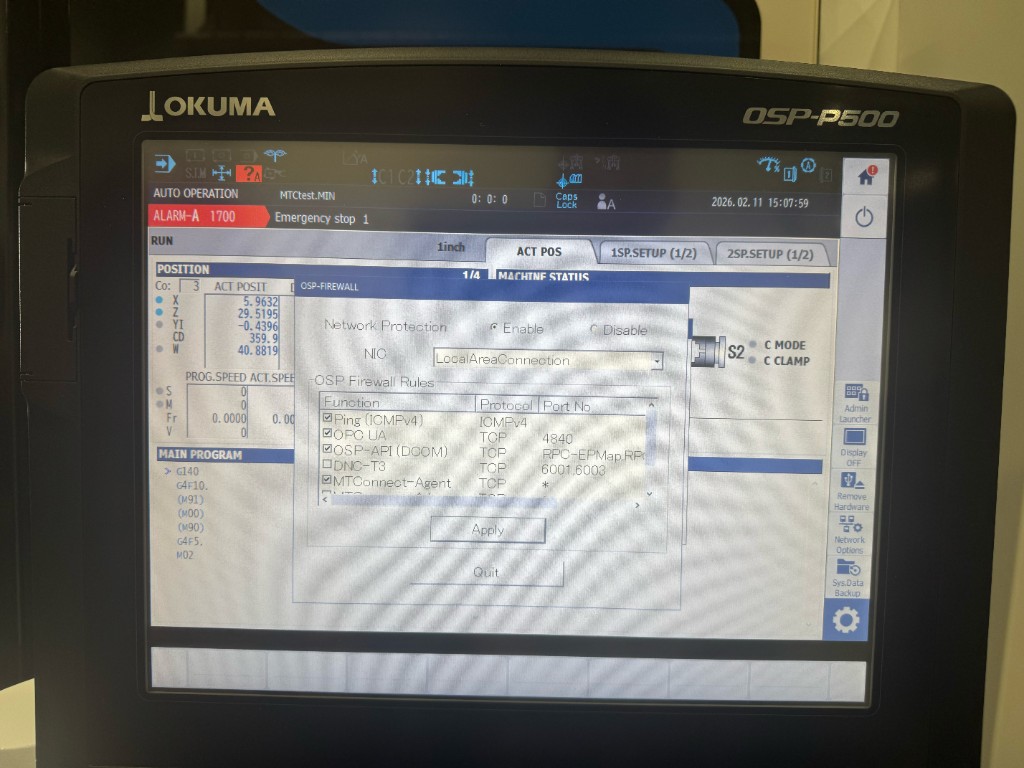
The firewall screen also shows OPC UA (TCP, port 4840) as a separate rule. If you are setting up OPC-UA on the same machine, ensure that rule is also enabled.
Step 5: Open the MTConnect Adapter
- Tap the puzzle piece icon again from the CNC screen
- From the utility menu on the right side, select MTConnect Adapter
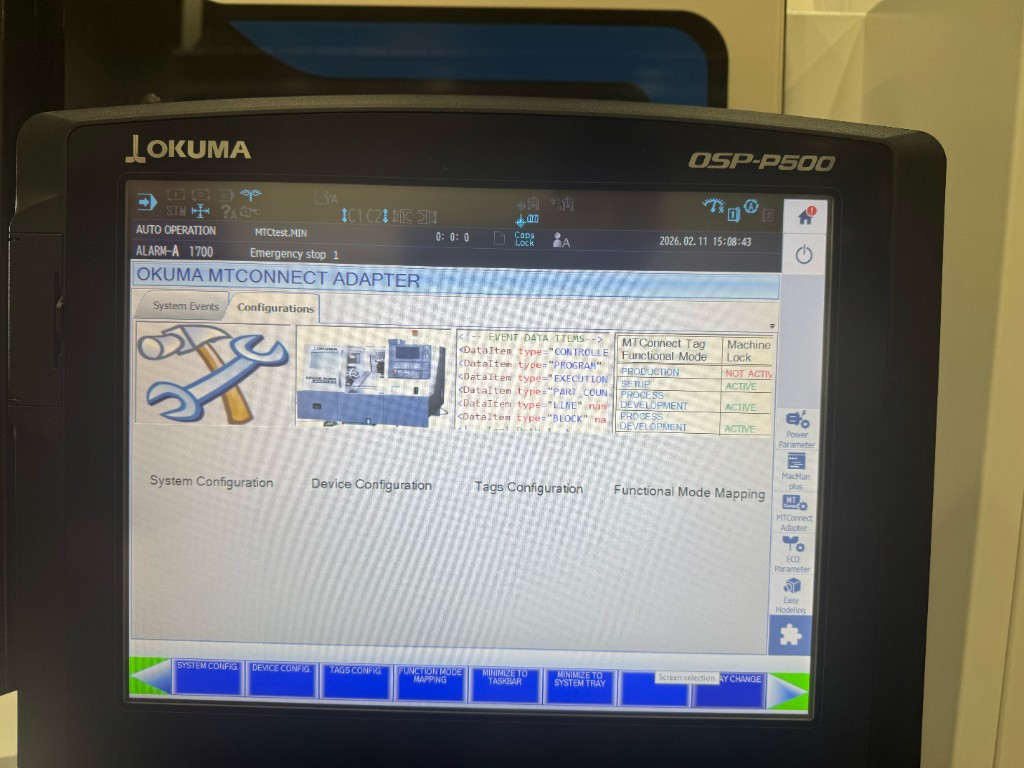
- The Okuma MTConnect Adapter window opens on the Configurations tab, showing four sections:
- System Configuration
- Device Configuration
- Tags Configuration
- Functional Mode Mapping
Step 6: Update Device Configuration
- Select Device Configuration (or press the DEVICE CONFIG. softkey at the bottom)
- Update the following fields:
- Serial Number — Enter the machine's serial number
- Device Name — Enter a name for the machine
- Description — Enter a description that uniquely identifies this machine (e.g., make, model, location)
- Confirm the changes
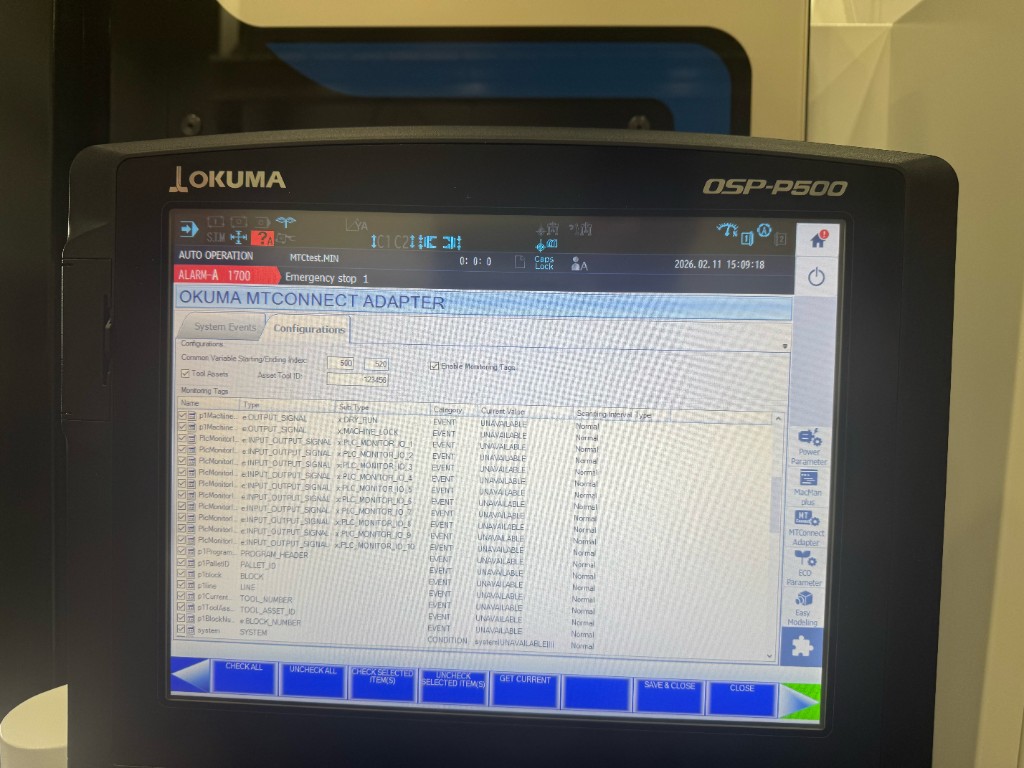
Step 7: Configure Monitoring Tags
Without "Enable Monitoring Tags" checked, all tag values will report as UNAVAILABLE.
- Select Tags Configuration (or press the TAGS CONFIG. softkey)
- ☑ Check Enable Monitoring Tags at the top of the screen
- ☑ Optionally check Tool Assets if tool asset data is required — enter the Asset Tool ID if applicable
- Set the Common Variable Starting/Ending Index range if the customer's programs use common variables (e.g., 500–520)
- Ensure relevant tags are checked. Key tags include:
| Tag | Type | Description |
|---|---|---|
| DRY_RUN | OUTPUT_SIGNAL | Dry run status |
| MACHINE_LOCK | OUTPUT_SIGNAL | Machine lock status |
| PLC_MONITOR_IO_1–10 | INPUT_OUTPUT_SIGNAL | PLC I/O signals |
| PROGRAM_HEADER | PROGRAM_HEADER | Active program info |
| PALLET_ID | PALLET_ID | Pallet identifier |
| BLOCK | BLOCK | Current block |
| LINE | LINE | Current line number |
| TOOL_NUMBER | TOOL_NUMBER | Active tool number |
| TOOL_ASSET_ID | TOOL_ASSET_ID | Tool asset reference |
| BLOCK_NUMBER | BLOCK_NUMBER | Block count |
| SYSTEM | SYSTEM | System condition |
Step 8: Save and Close
- Press SAVE & CLOSE (softkey at the bottom right)
- The MTConnect adapter reinitializes with the new configuration
- Press MINIMIZE TO SYSTEM TRAY — the adapter continues running in the background
Verification
- Open a browser on the machine control
- Navigate to
http://localhost:5000/current - You should see XML output with current machine data items
- From a remote machine on the same network, navigate to
http://<machine_ip>:5000/currentto confirm network accessibility
If all values show as UNAVAILABLE:
- Confirm "Enable Monitoring Tags" is checked
- Restart the MTConnect adapter: on OSP-P500, reopen it via CNC → Puzzle Icon → MTConnect Adapter; on Windows-based controls (OSP 300 / 200 / 100-II), close and reopen from Start → Programs → Okuma → MTConnect Adapter
- If the issue persists, restart the machine control
If the page does not load remotely:
- Check that Windows Firewall allows inbound traffic on port 5000
- Verify network connectivity between the Edge device and the machine
Quick Reference — OSP-P500
| Item | Value |
|---|---|
| Protocol | MTConnect |
| Default Port | 5000 |
| URL Format | http://<ip>:5000/current |
| Admin Launcher Path | CNC → Puzzle Icon → Gear → Admin Launcher |
| MTConnect Adapter Path | CNC → Puzzle Icon → MTConnect Adapter |
| Critical Setting | ☑ Enable Monitoring Tags |
Configuration
Supported Controls:
| Control | MTConnect | Notes |
|---|---|---|
| OSP-P500 | Built-in | See OSP-P500 Setup for full walkthrough |
| OSP 300 | Install from App Store | Best support, easy self-install |
| OSP 200 | Install from App Store (after THINC API update) | Contact Okuma dealer for API update first |
| OSP 100-II | Install from App Store (after THINC API update) | Contact Okuma dealer for API update first |
| Other OSP 100 | Not Available | Use I/O integration instead |
Compatibility Verification:
- Use Scout tool at MyOkuma.com
- Full compatibility chart: MyOkuma MTConnect Page
Installation for OSP 300:
- Access THINC App Store
- Search for "MTConnect"
- Download and install MTConnect Agent/Adapter
- Follow on-screen instructions
- Configuration happens automatically
Installation for OSP 200 / OSP 100-II:
- First: Contact Okuma dealer for THINC API update
- Then: Install MTConnect from THINC App Store
- Both steps required for these controls
Enabling Monitoring Tags:
⚠️ Critical: This step is required even if MTConnect is installed.
- Press CTRL + /// (access Windows)
- Navigate: Programs → Okuma → Okuma MTConnect Adapter Application
- Login:
- Username:
Administrator - Password:
okuma+osp
- Username:
- Click Configuration tab
- Click Tags Configuration button
- Check "Enable Monitoring Tags"
- Select data items to monitor (or select all)
- Click Save & Close
- Restart machine
Part Counting with Common Variables
If part count doesn't increment automatically:
- Open MTConnect application on Okuma
- Go to "Device Configuration"
- Select common variable (e.g., VC1)
- In CNC program, add near the end:
VC1=VC1+1(increment by 1)VC1=VC1+2(increment by 2)
- Contact MachineMetrics with variable number for configuration match
Default Port: 5000
Accessing Windows: Press CTRL + ///
Troubleshooting
Problem: MTConnect installed but not reporting data
Check Monitoring Tags:
This is the most common Okuma issue.
- Access Windows (CTRL + ///)
- Open Okuma MTConnect Adapter Application
- Login (Administrator / okuma+osp)
- Configuration tab → Tags Configuration
- Verify "Enable Monitoring Tags" is checked
- If unchecked: Check it, Save & Close, restart machine
Problem: Part count not incrementing
⚠️ CRITICAL FIRST STEP: Verify Machine is Counting Parts
Before troubleshooting MachineMetrics or MTConnect configuration, verify the machine itself is incrementing its internal part counter.
MTConnect (and MachineMetrics) reads the machine's native part counter. If the machine isn't counting parts, MTConnect cannot report them. Without additional configuration, MachineMetrics relies entirely on the machine's internal part count signal provided by MTConnect.
See the Connectivity Validation Guide for a visual guide to identifying healthy vs. problematic part count patterns — including what sporadic counts and sub-second cycle times look like.
Check Machine Part Counter:
- Look at the machine's control screen
- Find the part counter display (varies by machine/control)
- Run a cycle
- Verify the counter increments on the machine itself
If the machine counter is NOT incrementing:
- This is a machine configuration issue, not a MachineMetrics or MTConnect issue
- Machine is not configured to count parts
- For Okuma: See Part Counting with Common Variables section below
If the machine counter IS incrementing but MachineMetrics shows zero:
- This is a MachineMetrics or MTConnect adapter configuration issue
- Verify MTConnect adapter is reporting the part count
- Access MTConnect stream:
http://[machine-ip]:[port]/current - Look for
<PartCount>or similar data item - If present in MTConnect but not in MachineMetrics: Data mapping issue
Solution for Okuma Machines:
If Okuma part count not incrementing on machine itself, use Common Variables.
See Part Counting with Common Variables section for detailed setup.
Problem: THINC API too old
Solution:
- Contact Okuma dealer for THINC API update
- Required for OSP 200 and OSP 100-II
- Cannot self-install API update
Problem: Control not compatible
Solution:
- Use Scout tool to verify compatibility
- If not compatible: Use Digital I/O integration instead
- Contact MachineMetrics for alternative methods