Tool Life Monitoring
- Overview
- Why Tool Life Monitoring
- Getting Started - Auto vs Manual Mode
- Auto Mode - Mirror CNC Data
- Manual Mode - MachineMetrics Tracking
- Tool Life Monitoring Dashboard
- Display Tool Life on Operator Dashboard
- Adding Tool Life to Custom Dashboards
- Tool Life Alerts and Workflows
- Best Practices
- Troubleshooting
- Getting Help
Overview
What is Tool Life Monitoring?
Tool Life Monitoring surfaces previously hidden or unknown tool information from your CNC controls and transforms it into an easy-to-understand graphical format. Instead of operators navigating complex CNC menus or manually tracking tools on whiteboards, MachineMetrics provides real-time visibility into tool life across all machines in one centralized location.
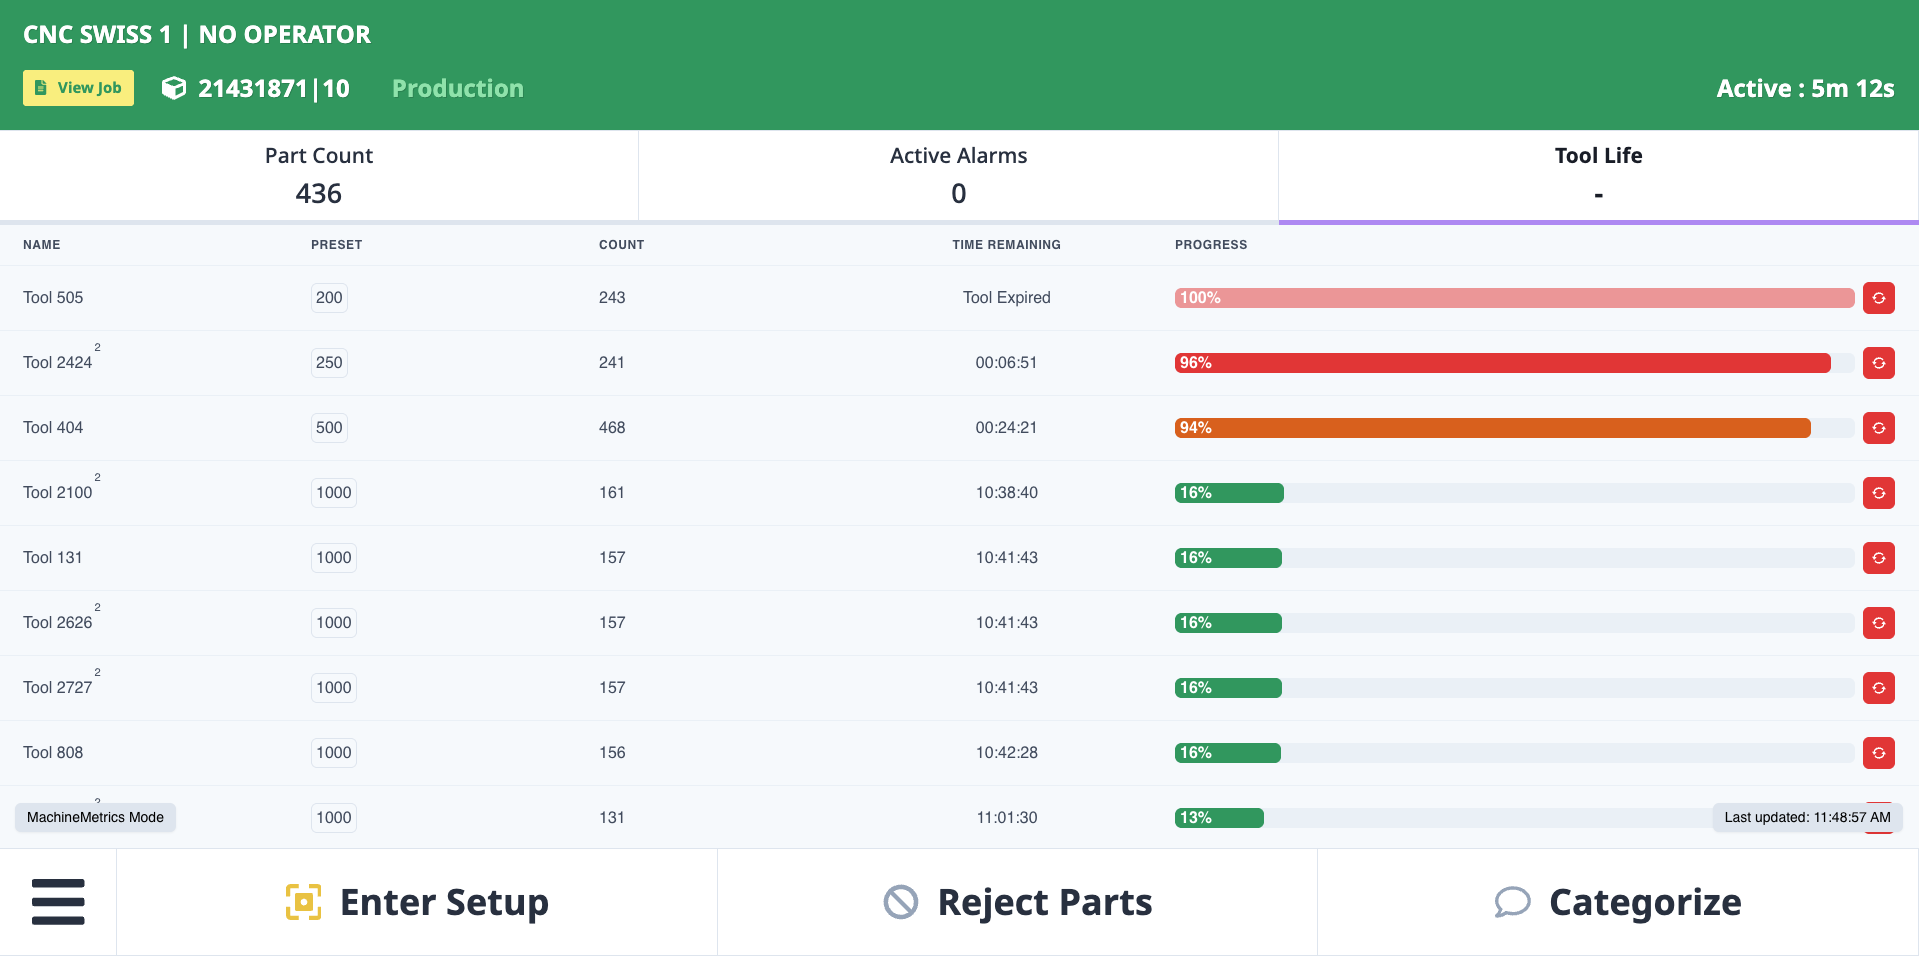
Tool Life Monitoring displayed on the Operator Dashboard tablet at the machine. Operators see tool status in a visual, color-coded format with green indicating tools with plenty of life remaining (>25%), yellow showing tools needing attention soon (10-25%), and red alerting to tools requiring immediate replacement (<10%). Each tool shows its current count, preset limit, and percentage remaining - enabling operators to optimize tool change timing and reduce unplanned downtime.
Key Benefits
For Operators:
- ✅ Optimize tool change timing - See exactly when tools are due to expire
- ✅ Reduce unplanned downtime - Plan tool changes during natural breaks (load/unload, shift change)
- ✅ Prevent scrap - Change tools before they wear out and cause quality issues
- ✅ Reduce cost - Avoid changing tools too early (wasting tool life and money)
- ✅ Eliminate guesswork - No more manually tracking on paper or whiteboards
- ✅ Visual clarity - Color-coded status (green/yellow/red) shows priority at a glance
For Maintenance & Supervisors:
- ✅ Centralized visibility - Monitor all machines from one dashboard
- ✅ Proactive planning - Identify tools needing replacement before shift starts
- ✅ Toolroom optimization - Know which tools to prep in advance
- ✅ Prevent crashes - Avoid catastrophic tool failures that damage parts and machines
- ✅ Data-driven decisions - Track tool usage patterns and optimize tool life limits
Why Tool Life Monitoring
The Problem
Without Tool Life Monitoring, shops face these challenges:
Hidden Information:
- Tool life data buried in CNC menus (5+ button presses to access)
- Different controls have different interfaces (FANUC, Citizen, Haas, etc.)
- Operators don't check tool life until it's too late
- No visibility across multiple machines
Reactive Tooling:
- Tools fail unexpectedly during production (crashes, scrap, downtime)
- Operators change tools too early "to be safe" (wasting money)
- Or change tools too late (causing quality issues and scrap)
- No data-driven decision making
Manual Tracking Fails:
- Whiteboard tracking is error-prone and outdated
- Paper logs get lost or forgotten
- No shift-to-shift communication
- No historical data for optimization
The Solution
Tool Life Monitoring transforms hidden CNC data into actionable information:
Surfaced Information:
- All tool life data in one centralized dashboard
- Color-coded visual status (green/yellow/red)
- Real-time updates as tools are used
- Accessible from anywhere (tablet, phone, desktop)
Proactive Tooling:
- Operators see exactly when tools need changing
- Plan changes during natural breaks (reduce downtime)
- Change tools at optimal time (not too early, not too late)
- Prevent scrap from worn tools
Automatic Tracking:
- No manual data entry required
- Data flows directly from CNC controls
- Historical tracking for analysis and optimization
- Shift handover includes tool status
Getting Started - Auto vs Manual Mode
MachineMetrics Tool Life Monitoring operates in two modes:
| Mode | Description | Best For | Data Source |
|---|---|---|---|
| Auto Mode | Mirrors tool life counts and presets directly from the CNC controller | FANUC, Citizen, machines with native tool life management | CNC P-codes, Macro variables, or OPC-UA |
| Manual Mode | MachineMetrics counts and tracks tool usage automatically | MTConnect machines, legacy machines without tool life data | MachineMetrics production tracking |
Recommendation: Use Auto Mode whenever possible for most accurate data directly from the CNC. Use Manual Mode for machines that don't expose tool life data.
Auto Mode - Mirror CNC Data
Overview
Auto Mode reads tool life data directly from your CNC control's internal memory (P-codes, macro variables, or OPC-UA) and displays it in MachineMetrics. No operator intervention required - the CNC is the source of truth.
How It Works:
- CNC control tracks tool usage (counts or time)
- MachineMetrics adapter reads data via machine connection
- Dashboard displays current tool life in real-time
- Color-coded status alerts when tools need attention
Citizen Machines
For Citizen lathes (including Cincom Swiss-type machines), enable tool life monitoring by adding this JSON configuration to your Citizen machine connection:
{
  "tool-life": {
    "enabled": 1
  }
}
That's it! No additional adapter script or transform script is required. Once you add this configuration and save, tool life data automatically appears in the Tool Life Monitoring Dashboard.
FANUC Machines (Macro B)
For FANUC or Haas machines using Macro B variables, add macro definitions to your adapter script:
{
  "macros": {
    "TLM_1_COUNT": 811,
    "TLM_1_PRESET": 980,
    "TLM_3_COUNT": 821,
    "TLM_3_PRESET": 981,
    "TLM_5_COUNT": 831,
    "TLM_5_PRESET": 982
  }
}
Naming Convention:
TLM_x_COUNT- Current usage count for tool/offset xTLM_x_PRESET- Maximum life limit for tool/offset xx- Tool number or offset number
Example:
TLM_1_COUNT (Macro 811) = Current count for Tool 1
TLM_1_PRESET (Macro 980) = Preset limit for Tool 1

If COUNT = 150 and PRESET = 500:
Tool 1 is at 30% used (70% remaining)
FANUC Machines (P-Codes)
For FANUC machines with native tool life management, use P-code addresses:
{
  "pcodes": {
    "TLM_1_PRESET": 12101,
    "TLM_1_COUNT": 12201,
    "TLM_2_PRESET": 12102,
    "TLM_2_COUNT": 12202,
    "TLM_3_PRESET": 12103,
    "TLM_3_COUNT": 12203
  }
}
Naming Convention:
TLM_x_PRESET- The preset value for tool xTLM_x_COUNT- The count value for tool xx- Tool or offset number
Finding P-Code Addresses on FANUC
If the machine has a tool life management system created by the machine tool builder (most common), the data will be in P-codes. To locate and identify the P-code addresses:
Step-by-Step:
- Turn on Parameter Write Enable (see your FANUC manual for instructions on enabling parameter write access)
- Set parameter 9000#1 (NDP) = 1
- Press OFFSET hard key
- Press MACRO screen soft key
- Press EXEC screen soft key
- Output variables to USB via the OPRT menu
- Set I/O channel to 17 for USB or 4 for MEM Card
- Set param 9000#1 back to 0
- Turn off Parameter Write Enable
- Take a photo of the Tool Life Management screen on the CNC
- On your PC/Mac, open the exported file and search for the values from the photo - you should see all values close together
Tip: For other controls such as Siemens, we can capture tool life data from OPC-UA. See OPC-UA section below.
OPC-UA Tool Life (Siemens, Brother, Others)
For machines with OPC-UA connectivity (such as Siemens and other controls), tool life data can be captured from OPC-UA nodes.
To Configure OPC-UA Tool Life:
- Use Labs → OPC UA Tag Explorer to discover available tool life nodes
- Connect to your machine's OPC-UA server
- Browse for tool-related nodes (often under
Tools,ToolManagement, or similar) - Identify nodes for:
- Tool usage counts (current count for each tool)
- Tool life presets (maximum life for each tool)
- Active tool number
- Map these nodes following the
TLM_x_COUNTandTLM_x_PRESETnaming convention - Contact MachineMetrics support for assistance with adapter script configuration
Important: OPC-UA tool life configuration is machine-specific and requires working with support to map the correct nodes from your specific control. The node paths vary significantly by machine manufacturer and model.
Data Item Naming Convention and MTConnect Mapping
All tool life data items — regardless of connection type — must follow a consistent naming convention so MachineMetrics can identify and display them correctly.
Required format:
TLM_x_COUNT— current usage count for tool numberxTLM_x_PRESET— maximum life limit for tool numberx
Where x is the tool number (e.g., TLM_1_COUNT, TLM_2_PRESET).
Multipath lathes: Append _PATHx to the end of each name to ensure uniqueness:
TLM_1_COUNT_PATH1,TLM_1_COUNT_PATH2TLM_1_PRESET_PATH1,TLM_1_PRESET_PATH2
On multipath lathes, data item names must include the path suffix. Without it, duplicate names will collide and tool life data will not display correctly.
MTConnect data item mapping:
| Field | Value |
|---|---|
| Data type | Sample |
| Sub Type | Custom |
| Component Type | TLM |
| Component | COUNT or PRESET |
| Display Name | Set this to overwrite the default |
Data Mapping in MachineMetrics
After configuring your adapter script, map the tool life data in MachineMetrics:
- Navigate to Machines → Select your machine
- Open Machine Settings
- Go to Data Collection tab
- Find the tool life data items (e.g.,
TLM_1_COUNT,TLM_1_PRESET) - Set Display Name to friendly names (e.g., "T1 - End Mill 1/2"")
- Save
Configure tool life data mapping in Machine Settings to give tools friendly display names that operators can easily understand.
Manual Mode - MachineMetrics Tracking
Overview
Manual Mode is for machines that do not output tool life information (e.g., MTConnect machines, legacy machines). In Manual Mode, MachineMetrics automatically counts tool usage based on production activity and operators reset tools on the Operator Dashboard when physically changed.
Tool Life Monitoring Manual Mode Demonstration
Watch this demonstration video to see Manual Mode in action: setting preset values, tracking tool usage, and resetting tools from the Operator Dashboard.
Requirements
Important: You must have an active job (Production Run or Operation) running in MachineMetrics for Manual Mode to work. This is how MachineMetrics learns which tools have been used.
Enabling Manual Mode
By default, all machines are set to Auto Mode. To change to Manual Mode:
- Navigate to Labs → Tool Life Monitoring
- Click the gear icon (settings)
- Select the machine
- Check "MachineMetrics tracks tool life"
- Click Save
Enable Manual Mode by checking "MachineMetrics tracks tool life" in the Tool Life Monitoring settings for machines that don't output native tool life data.
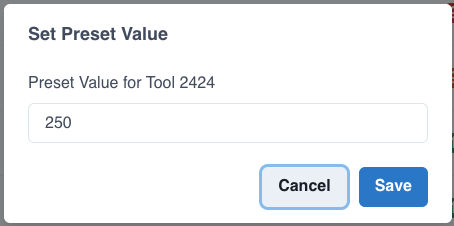
Setting Preset Values
In Manual Mode, you define the maximum life for each tool:
- Open Tool Life Monitoring dashboard
- Click on the preset value for any tool
- Enter the maximum life (e.g., 500 parts or 1000 cycles)
- Click Save
Example:
Tool T1 - End Mill 1/2"
Preset: 500 parts
Current: 0 parts
Remaining: 100%
As the machine runs, MachineMetrics automatically increments the count based on tool usage detected from the active job.
Resetting Tools After Physical Change
When an operator physically changes a tool on the machine, they must reset the tool count in MachineMetrics:
From Tool Life Dashboard:
- Locate the tool that was changed
- Click the red reset icon next to the tool
- Confirm reset
- Tool count returns to 0 (100% life remaining)
From Operator Dashboard:
- Operators see tool life on the tablet
- Tap the tool that was changed
- Tap Reset Tool Life
- Confirm reset
- Tool life returns to 100%
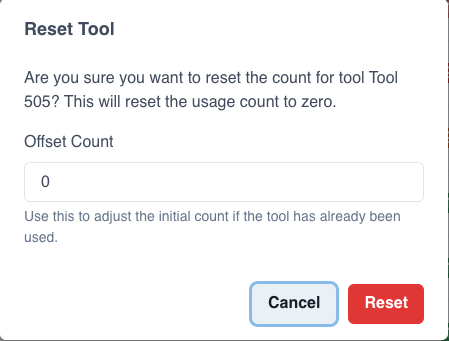
Offset Count (Forgot to Reset)
If an operator forgets to reset the tool life on the Operator Dashboard at the same time the tool was physically changed, you can use the offset count feature:
Example:
Scenario: Tool T5 was physically changed 5 parts ago,
but operator forgot to reset the count in MachineMetrics.

Action:
1. Click on the tool's progress bar
2. Set "Offset Count" to 5
3. Save

Result: MachineMetrics adjusts the count to start from 5 parts used.
Tool Analytics
Click any tool's progress bar to see detailed analytics:
- Change history (when tool was last reset)
- Usage patterns (how many parts per tool change)
- Tool life trend over time
- Export to PDF for analysis
Tool Life Monitoring Dashboard
Accessing the Dashboard
Option 1: From Labs
- Navigate to Labs in the main menu
- Select Tool Life Monitoring
Option 2: Direct URL
- Navigate to: https://custom-dashboards.svc.machinemetrics.com/tool-monitoring
- Bookmark for quick access
Option 3: From Toolroom Display
- Open full-screen display in your toolroom or maintenance area
- Use the direct URL on a dedicated monitor
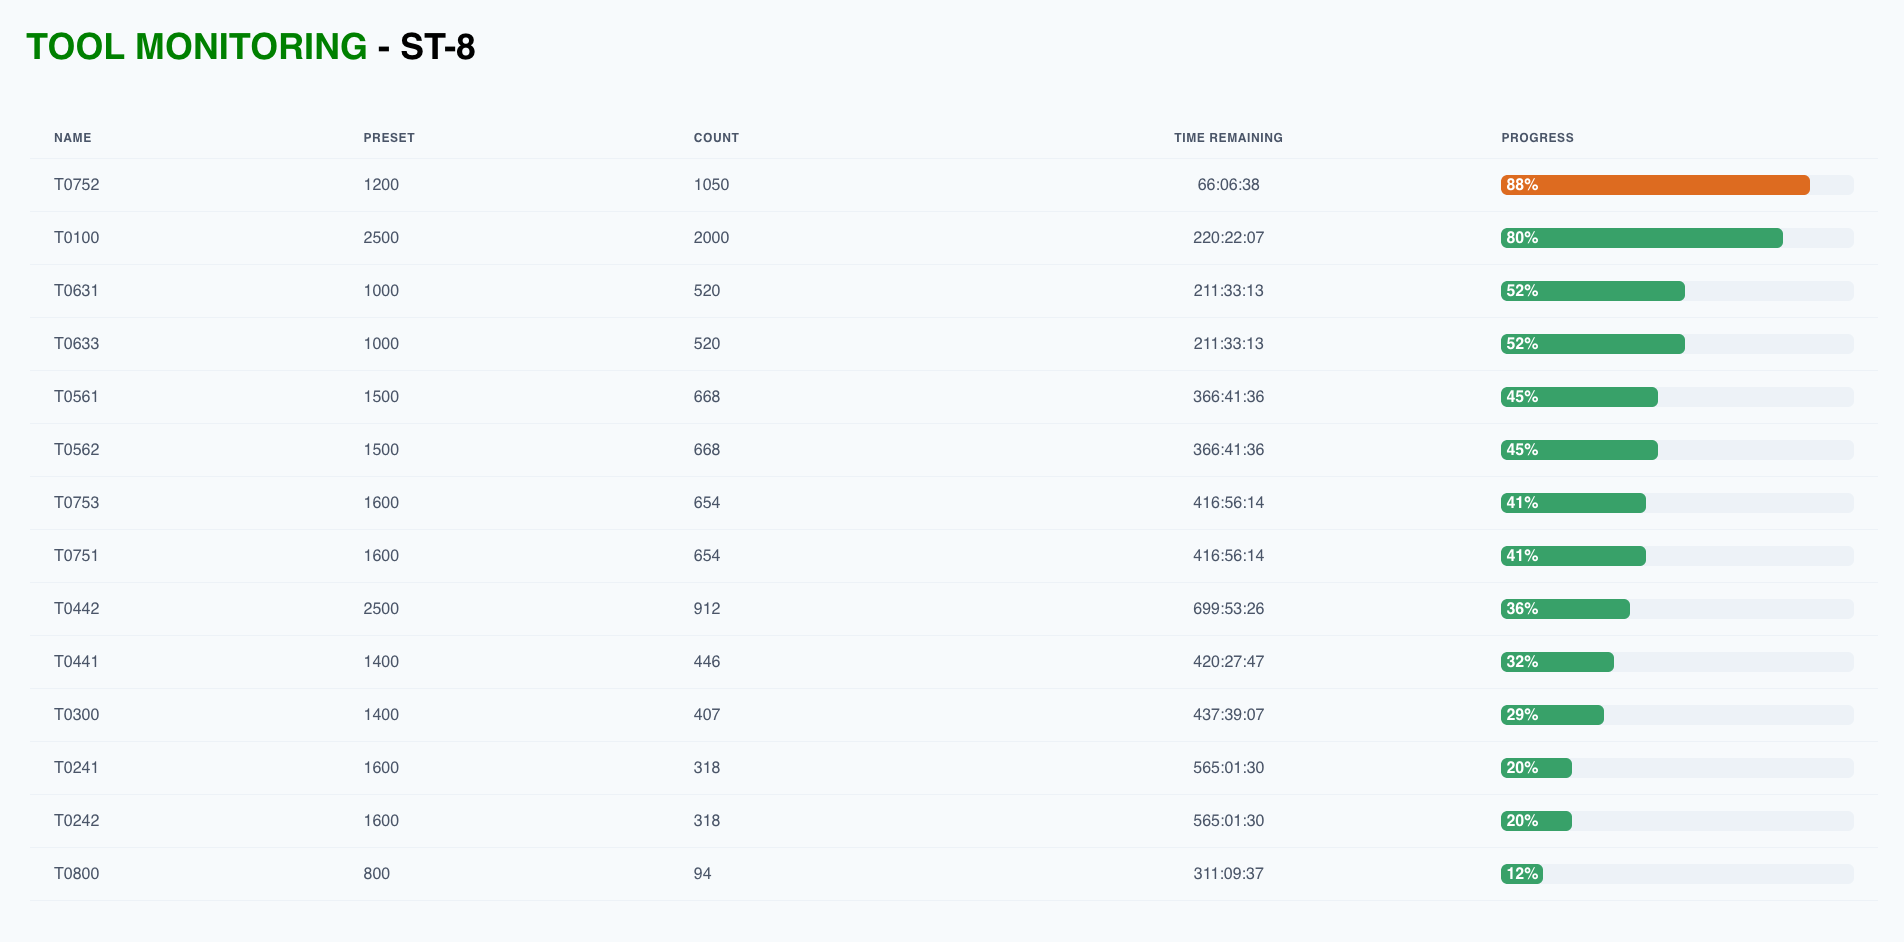
The Tool Life Monitoring Dashboard provides a comprehensive view of all tools across all machines, with color-coded status indicators and real-time updates. Use filters to narrow down by machine, machine group, or tool status.
Dashboard Features
Machine Selector:
- Filter by specific machine
- Filter by machine group
- View all machines at once
Tool Status Colors:
| Color | Life Remaining | Status | Action |
|---|---|---|---|
| Green | > 25% | Good | Continue production |
| Yellow | 10-25% | Caution | Plan tool change soon |
| Red | < 10% | Critical | Change tool soon |
| Red (Flashing) | 0% or Expired | Urgent | Change immediately |
Tool Information Displayed:
- Tool number (T1, T2, etc.)
- Tool description (if configured)
- Current count / Preset limit
- Percentage remaining
- Visual progress bar
Interactive Actions:
- Click preset value to change tool life limit
- Click reset icon to reset tool after change
- Click progress bar to view detailed analytics and history
Filters and Search
Filter by Status:
- Show all tools
- Show only green tools (>25%)
- Show only yellow tools (10-25%)
- Show only red tools (<10%)
Filter by Machine:
- Select specific machine from dropdown
- Or select machine group to view all machines in group
Search:
- Search by tool number
- Search by tool description
- Quick navigation to specific tools
Display Tool Life on Operator Dashboard
Overview
Operators benefit most when they can see tool life right at the machine on their Operator Dashboard tablet. This enables them to optimize tool change timing during natural production breaks.
Tool life displayed on the Operator Dashboard tablet shows only the tools for that specific machine in a simplified, touch-friendly interface. Operators can see which tools need attention and reset tools after changing them without leaving the machine.
Benefits for Operators
When tool life is visible on the Operator Dashboard:
✅ Optimize Tool Change Timing:
- See tool life during load/unload operations
- Plan changes during shift breaks or natural pauses
- Avoid mid-cycle interruptions
✅ Reduce Unplanned Downtime:
- No surprise tool failures
- Change tools proactively, not reactively
- Keep production running smoothly
✅ Prevent Scrap:
- Change tools before they cause quality issues
- Avoid worn tools that produce out-of-spec parts
- Reduce rework and waste
✅ Reduce Cost:
- Don't change tools too early (waste money)
- Don't change tools too late (cause scrap)
- Use tools to their full life potential
✅ Eliminate Guesswork:
- No manual tracking on whiteboards
- No need to access complex CNC menus
- Clear visual indicator of tool status
Adding Tool Life Tab to Operator Dashboard
Option 1: Machine-Specific Tab (Recommended)
Add tool life as a custom tab on the Operator Dashboard:
- Navigate to Settings → Operator Dashboard → Custom Tabs
- Click Add Custom Tab
- Configure:
- Tab Name: "Tool Life"
- URL:
https://tool-life-monitoring.svc.machinemetrics.com/machine?includeMachineInfo=true - Icon: Tool icon
- Assign to machines
- Save
URL with includeMachineInfo:
https://tool-life-monitoring.svc.machinemetrics.com/machine?includeMachineInfo=true
This URL automatically selects the correct machine based on the tablet's machine assignment. The machine selector dropdown is hidden, providing a clean, simplified view.
Option 2: Lock to Specific Machine (Large Screens)
For large screens or dedicated displays, lock the view to a specific machine:
https://tool-life-monitoring.svc.machinemetrics.com/machine?machineId=12345678-2900-4f2c-ba26-01c81f429126
Replace 12345678-2900-4f2c-ba26-01c81f429126 with your machine's ID (found in Machine Settings → General).
What Operators See
Tool Life Tab on Tablet:
Tool Life - Mill #3
──────────────────────────────────────
T1  | End Mill 1/2"     | ████████░░ 82%  | 410 / 500
T2  | Drill 0.25"       | ██████░░░░ 58%  | 290 / 500
T3  | Chamfer Tool      | ██░░░░░░░░ 18%  | 90 / 500   ⚠️ Plan Change
T4  | Face Mill 2"      | █░░░░░░░░░ 8%   | 40 / 500   🔴 Change Soon
T5  | Tap M8            | ████████░░ 78%  | 390 / 500
──────────────────────────────────────
[Reset T3] [Reset T4]
Color Indicators:
- Green bar: Tool has plenty of life remaining
- Yellow bar: Tool needs planning for change
- Red bar: Tool should be changed soon
Actionable Information:
- Operator sees T4 at 8% (red)
- Plans to change T4 during next shift break or long cycle
- Changes tool proactively (not during breakdown)
- Taps Reset T4 button after physical change
- Production continues with minimal interruption
Adding Tool Life to Custom Dashboards
Overview
Add Tool Life Monitoring to any custom dashboard for toolroom displays, management offices, or maintenance areas.
Step-by-Step
- Navigate to Dashboards → My Dashboards
- Create a new dashboard or edit existing
- Click Add Widget
- Select Custom URL widget type
- Configure widget:
- Widget Title: "Tool Life Monitoring"
- URL:
https://custom-dashboards.svc.machinemetrics.com/tool-monitoring - Refresh Interval: 60 seconds (or desired interval)
- Resize and position widget on dashboard
- Save dashboard
Use Cases
Toolroom Dashboard:
- Display all tool life across shop floor
- Identify which tools need prep in advance
- Monitor tool usage patterns
Maintenance Office:
- Proactive visibility into tool status
- Plan maintenance and tool orders
- Track tool life trends over time
Management Display:
- High-level overview of tool management
- Ensure tools are being changed appropriately
- Monitor cost optimization (tools used to full life)
Multi-Machine Cell:
- Show tool life for all machines in work cell
- Operator can monitor multiple machines at once
- Plan tool changes across cell
Tool Life Alerts and Workflows
Overview
Create automated alerts to notify operators, supervisors, or maintenance teams when tools reach critical thresholds.
Creating Tool Life Alerts
- Navigate to Automations → Workflows
- Click Create Workflow
- Configure:
Trigger:
- Type: Condition Monitor
- Data Item: Tool life data item (e.g.,
TLM_1_COUNT) - Condition: Calculate percentage and compare to threshold
Action:
- Type: Notification
- Recipients: Operators, Maintenance Team, Supervisor
- Message: "Tool life low on ${machine_name} - Tool ${tool_number} at ${percentage}%"
Example Workflows
Workflow 1: Yellow Alert (Tool Life < 25%)
Trigger: Tool life drops below 25%
Action: Display notification on Operator Dashboard
Message: "⚠️ Tool ${tool_number} at 25% life - plan replacement soon"
Workflow 2: Red Alert (Tool Life < 10%)
Trigger: Tool life drops below 10%
Action: Send email to supervisor + display on tablet
Message: "🔴 URGENT: Tool ${tool_number} at ${percentage}% - change immediately"
Workflow 3: Tool Expired (Tool Life = 0%)
Trigger: Tool life reaches 0%
Action: Pause machine + alert operator + create MaintainX work order
Message: "Tool ${tool_number} has expired - production paused"
Workflow 4: Tool Changed (Manual Mode)
Trigger: Tool life reset event detected
Action: Log to CMMS, send confirmation to supervisor
Message: "Tool ${tool_number} changed on ${machine_name} by ${operator_name}"
Integration with MaintainX
Create automatic work orders when tools need changing:
Trigger: Tool life < 5%
Action: Create MaintainX work order
Work Order:
  Title: "Tool Change Required - ${machine_name}"
  Description: "Tool ${tool_number} has reached end of life"
  Priority: High
  Assigned To: Toolroom Team
Best Practices
Configuration Best Practices
Set Conservative Thresholds:
- Define preset values based on manufacturer recommendations
- Add 10-20% safety margin to prevent failures
- Example: If manufacturer says 1000 parts, set preset to 800-900
Use Descriptive Tool Names:
- Not just "T1" - use "T1 - End Mill 1/2" Carbide"
- Operators immediately know which physical tool to change
- Reduces confusion and errors
Configure Alerts Appropriately:
- Yellow alert at 25% (plan change)
- Red alert at 10% (change soon)
- Critical alert at 5% (change immediately)
Document Tool Life Limits:
- Create reference sheet for operators
- Post near machines with tool life limits
- Include part numbers and specs
Operational Best Practices
Check Tool Life at Shift Start:
- Operators review tool life dashboard at beginning of shift
- Identify tools that will need changing during shift
- Plan timing (breaks, long cycles, shift handover)
Reset Tools Immediately After Change:
- Physical change + digital reset must happen together
- Prevents data mismatch
- Maintains accurate tracking
Review Tool Life Reports Weekly:
- Analyze tool usage patterns
- Identify tools wearing faster than expected
- Investigate root causes (speeds/feeds, material issues)
Optimize Tool Change Timing:
- Change multiple tools at once when convenient
- Plan changes during natural production pauses:
- Load/unload operations
- Shift breaks
- End of shift handover
- Long cycle times (while machine is running)
Cost Optimization Best Practices
Use Tools to Full Life:
- Don't change tools "just to be safe" at 50% life
- Follow data-driven thresholds (25% yellow, 10% red)
- Maximize ROI on expensive tooling
Track Cost of Premature Changes:
- If operator changes tool at 30% life, that's 30% wasted
- Example: $200 tool changed at 30% = $60 wasted per change
- Across 100 tools per year = $6,000 wasted
Prevent Scrap from Worn Tools:
- Worn tools cause out-of-spec parts (scrap)
- Example: 10 scrap parts @ $50 each = $500 lost
- Tool Life Monitoring prevents this by alerting before failure
Calculate ROI:
Without Tool Life Monitoring:
- 10 tool failures per year (crashes, scrap) = $5,000 lost
- 20 premature tool changes per year (30% life remaining) = $1,200 wasted
- Total loss: $6,200/year

With Tool Life Monitoring:
- Zero tool failures (proactive changes)
- Zero premature changes (data-driven timing)
- Net savings: $6,200/year
- ROI: Immediate
Troubleshooting
Auto Mode Issues
Issue: Tool life data not appearing
Possible Causes:
- Tool life not enabled on CNC control
- Incorrect P-code or macro addresses
- Connection issue between MachineMetrics and machine
Solution:
- Verify tool life management is configured on CNC
- Check adapter script for correct addresses (P-codes/macros)
- Go to Machines → Select machine → Diagnostics tab
- Look for tool life data items (e.g.,
TLM_1_COUNT,TLM_1_PRESET) - Verify values update when tools are used
Issue: Tool life shows UNAVAILABLE
Solution:
- Check machine connection status (red = disconnected)
- Verify adapter script is running (restart if needed)
- Confirm data items are mapped in Machine Settings → Data Collection
Issue: Tool life values are wrong
Solution:
- Verify P-code/macro addresses match CNC configuration
- Check display names in data mapping (may be reversed COUNT/PRESET)
- Use OPC UA Tag Explorer to confirm node paths (for OPC-UA machines)
Manual Mode Issues
Issue: Tool counts not incrementing
Possible Causes:
- No active job running in MachineMetrics
- Machine not set to Manual Mode
Solution:
- Verify an Operation or Production Run is active
- Go to Labs → Tool Life Monitoring → Settings
- Confirm "MachineMetrics tracks tool life" is checked
- Start a job on the Operator Dashboard
Issue: Operator can't reset tool life
Solution:
- Verify Operator Dashboard has Tool Life tab enabled
- Check operator permissions (need tool reset permission)
- Ensure tablet is connected to network
Issue: Preset values reset unexpectedly
Solution:
- Check for automation workflows that might modify preset values
- Verify only authorized users have access to Tool Life settings
- Review audit log for tool life changes
General Issues
Issue: Tool Life Dashboard not loading
Solution:
- Check internet connection
- Clear browser cache
- Try different browser
- Verify URL is correct
- Contact support if issue persists
Issue: Tool life data delayed
Solution:
- Check adapter script polling interval (increase frequency)
- Verify machine connection is stable
- Check network latency
Getting Help
Before Contacting Support
Common Questions:
"How do I find P-code addresses on FANUC?"
- Follow the P-code discovery process in Auto Mode - FANUC section
- Use the 10-step process to export and identify addresses
"Tool life not appearing on Citizen machine"
- Verify
{"tool-life": {"enabled": 1}}is in adapter script - Check machine connection status
- Review data items in Diagnostics tab
"Should I use Auto Mode or Manual Mode?"
- Use Auto Mode if machine has native tool life management (FANUC, Citizen, OPC-UA)
- Use Manual Mode for MTConnect or legacy machines without tool life data
"How do I add tool life to Operator Dashboard?"
- Use custom tab with URL:
https://tool-life-monitoring.svc.machinemetrics.com/machine?includeMachineInfo=true - See Display Tool Life on Operator Dashboard section
Contact Support
MachineMetrics Support:
- Email: support@machinemetrics.com
- In-App: Use Max AI to ask "How do I set up tool life monitoring?"
- Labs: Use OPC UA Tag Explorer for discovering tool life nodes
Include in Support Request:
- Machine name and type
- Connection type (FOCAS, Citizen, OPC-UA, MTConnect)
- Mode (Auto or Manual)
- Screenshot of Tool Life Dashboard
- Screenshot of Diagnostics tab showing tool life data items
- Specific issue or unexpected behavior
Related Articles
- FANUC FOCAS Connectivity Guide - FANUC machine setup
- Citizen Connectivity Guide - Citizen machine configuration
- Mitsubishi Connectivity Guide - Mitsubishi machine configuration
- OPC-UA Connectivity Guide - OPC-UA configuration
- Machine Settings Guide - Data mapping configuration
- Automations & Workflows Guide - Alert configuration
- Dashboards Guide - Dashboard widgets
- Operator Dashboard Guide - Tablet configuration
Ready to get started?
- Determine if your machines support Auto Mode or need Manual Mode
- Configure adapter script for Auto Mode (or enable Manual Mode in Labs)
- Map tool life data items in Machine Settings
- Add Tool Life tab to Operator Dashboard
- Set up alerts for critical thresholds
Questions? Contact support@machinemetrics.com or use Max AI in the app.