Operator Dashboard (OpDash) Guide
Overview
What is the Operator Dashboard?
Operator Dashboard (OpDash) is MachineMetrics' tablet interface for operators on the shop floor.
Key Capabilities:
- View real-time performance: OEE, utilization, cycle times, parts goal
- Add contextual data: Categorize downtime, log quality issues
- Manage operations: Start/stop production runs, switch activities
- Track parts: View parts produced, reject parts with reasons
- Trigger workflows: Request help, materials, or maintenance
- Access documentation: View work instructions, drawings, videos
Access:
- URL:
operator.machinemetrics.com - Or: Navigate from Machines Page → Click Operator Dashboard icon (top right)
- Device: Tablets at each machine (customer-sourced)
Who Uses Operator Dashboard:
- Machine Operators: Primary users, interact daily
- Setup Personnel: Start operations, input setup data
- Quality Inspectors: Review and reject parts
Version: Operator Dashboard 2.0 (current version). Note: OpDash 2.0 does not currently support Setup Stages; companies tracking Setup Stages should use the legacy version.
Tablet Setup
Hardware Requirements
Recommended Tablets:
- Samsung Galaxy Tab A (most common)
- Any tablet with:
- 10" screen or larger
- Android or iOS
- Modern web browser (Chrome recommended)
- Wi-Fi connectivity
Customer-Sourced:
- Tablets are purchased by customer
- MachineMetrics does not provide tablets
- See Hardware Buying Guide
Tablet Placement
Location Considerations:
- Easily accessible without interrupting workflow
- Protected from chips, coolant, and debris
- Visible from operator's normal working position
- Secure (prevent theft or damage)
Mounting Options:
- Magnetic mounts
- Articulating arms
- Wall mounts near machine
- Mobile carts (for roving operators)
Provisioning Tablets
Progressive Web App (PWA): MachineMetrics Operator Dashboard is a Progressive Web App, providing app-like experience in the browser.
Setup Steps:
- Connect tablet to shop floor Wi-Fi
- Open Chrome browser (or preferred browser)
- Navigate to
operator.machinemetrics.com - Log in with MachineMetrics credentials (or kiosk account)
- Add to Home Screen (create app icon):
- Chrome: Menu (⋮) → "Add to Home Screen"
- Safari: Share → "Add to Home Screen"
- App icon appears on tablet home screen
- Operators launch from app icon (full-screen experience)
Kiosk Accounts:
- Create dedicated account for each tablet (e.g., "Mill3-Tablet")
- Role: Operator or Viewer
- No personal email/password needed for operators
- See User Management Guide
Keeping Tablets Active
Prevent Sleep:
- Android: Settings → Display → Sleep → "Never"
- iOS: Settings → Display & Brightness → Auto-Lock → "Never"
- Or use keep-awake app
Keep Charged:
- USB charging cable to outlet
- Or use battery packs with trickle charge
Keep Connected:
- Strong Wi-Fi signal at machine
- If Wi-Fi drops: Edge Device continues collecting data (operator input delayed until reconnection)
Interface Anatomy
Operator Dashboard Layout
Four Main Sections:
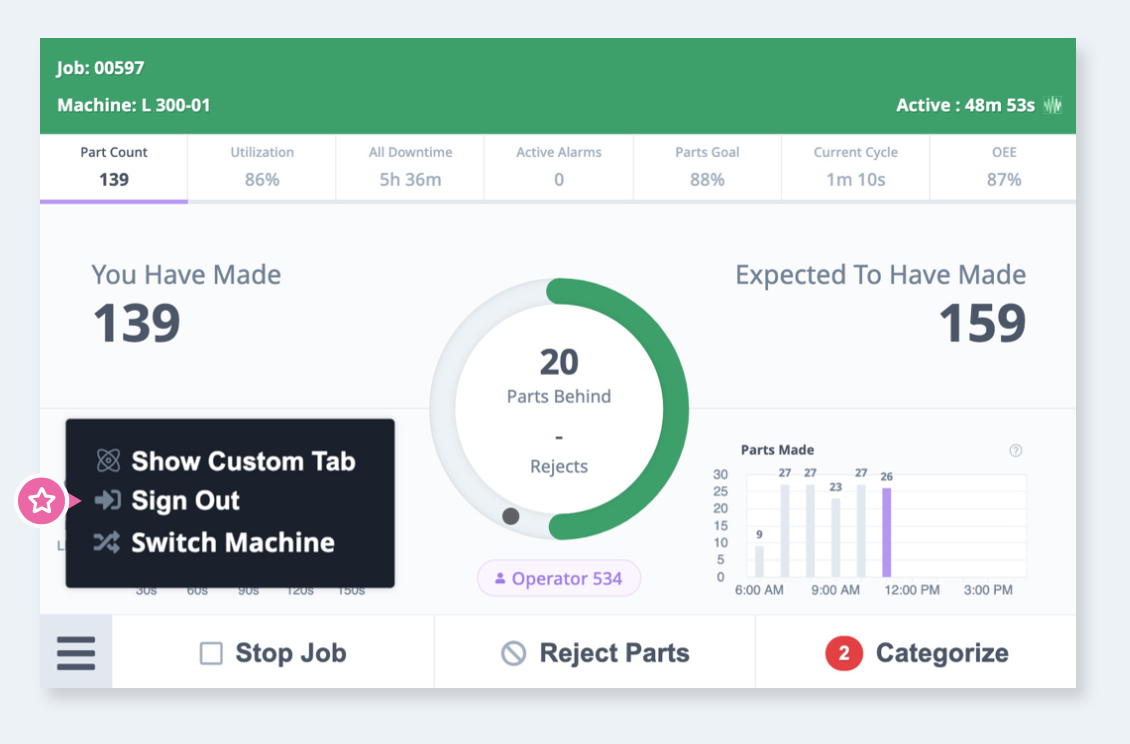
1. Machine Operating Status Bar (top)
- Color-coded status indicator
- Current machine status (Active, Inactive, Disconnected, Setup)
- Time counter showing duration in current status
- Example: "Active - 2h 35m" (machine has been active for 2 hours 35 minutes)
2. Tabs Section (below status bar)
- Multiple tabs with different metrics and data
- Swipe or tap to switch between tabs
- Customizable via settings (add, remove, reorder)
- Default tabs: Part Count, Utilization, All Downtime, Active Alarms, Parts Goal, Current Cycle Time, OEE
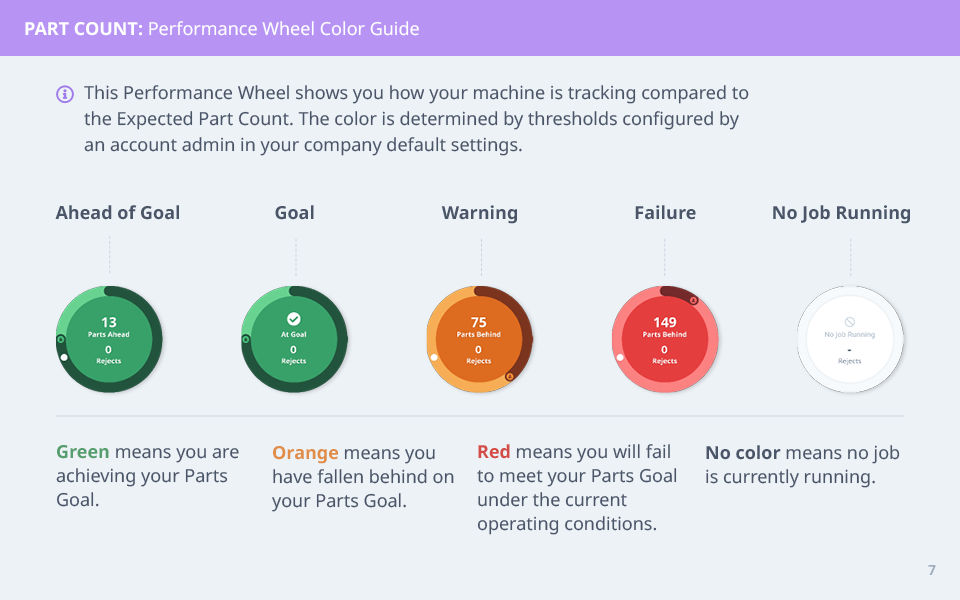
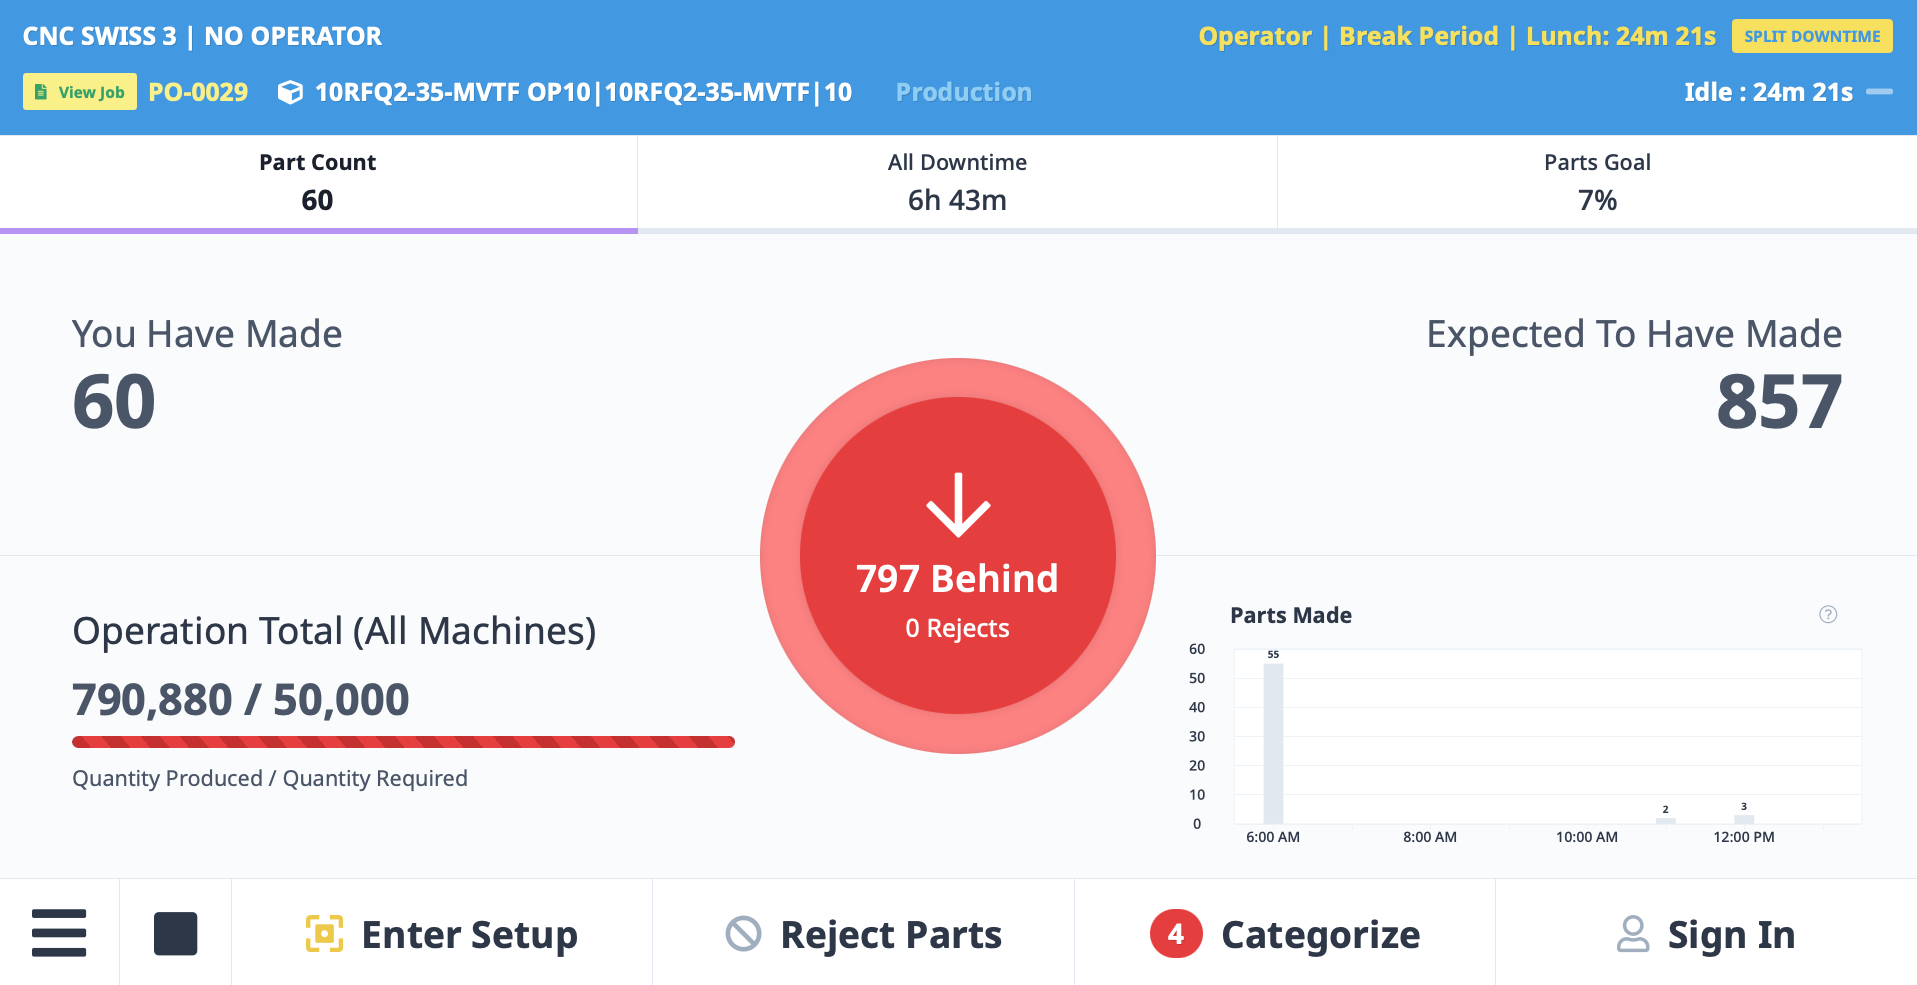
3. Performance Wheel (center of each tab)
- Visual indicator of performance vs. thresholds
- Ring represents "Scope of Time" (since shift start, job change, or activity change)
- Color-coded based on goals:
- Green: Meeting or exceeding target
- Yellow: Below target
- Red: Significantly below target
- Metric displayed in center (e.g., "78%" for OEE)
4. Navigation Button Bar (bottom)
- Action buttons for operator tasks
- Varies based on company configuration:
- Start/Stop Operation buttons
- Reject Parts button
- Categorize button (with red badge if uncategorized events)
- Work Order button
- Manual workflow trigger buttons
- Always visible regardless of tab
Status Bar Colors
Color-Coded Machine Status:
- Green: Active (in-cycle, producing)
- Yellow: Inactive (idle, between cycles)
- Red: Alarm or error state
- Blue: Setup mode
- Purple: Production mode (if activity tracking enabled)
- Gray: Disconnected (no data from machine)
Time Counter:
- Shows how long machine has been in current status
- Resets when status changes
- Helps operators and supervisors quickly understand machine state
Operator Login
Why Use Operator Login?
Benefits:
- Track individual operator performance
- Identify training needs
- Recognize top performers
- Accountability and ownership
Optional Feature:
- Not required for Operator Dashboard to function
- Must be enabled: Settings → Company Settings → Operator Insight
- See Operators in Production & Analytics Guide
Logging In
Step-by-Step:
- Tap menu icon (☰) in bottom left corner
- Select "Select User" or "Login"
- Choose your name from list
- Select login time:
- "Start of Shift": Backdates login to shift start time (if you forgot to log in)
- "Now": Sets login time to current time
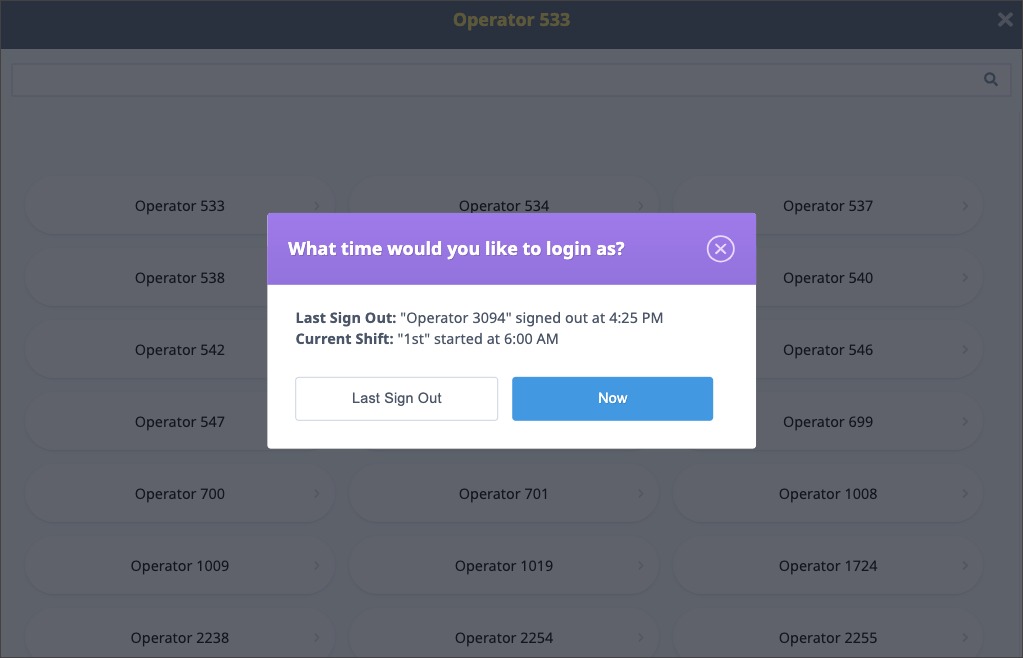
If Another User Was Logged In:
- If another operator was logged in since shift start, you'll see:
- "Last Sign Out": Log in from when previous operator logged out
- "Now": Log in from current time
Switching Users
Switching Without Logging Out:
- Tap menu icon (☰)
- Select "Switch User"
- Choose different operator name
- Select login time
- Previous operator automatically logged out, new operator logged in
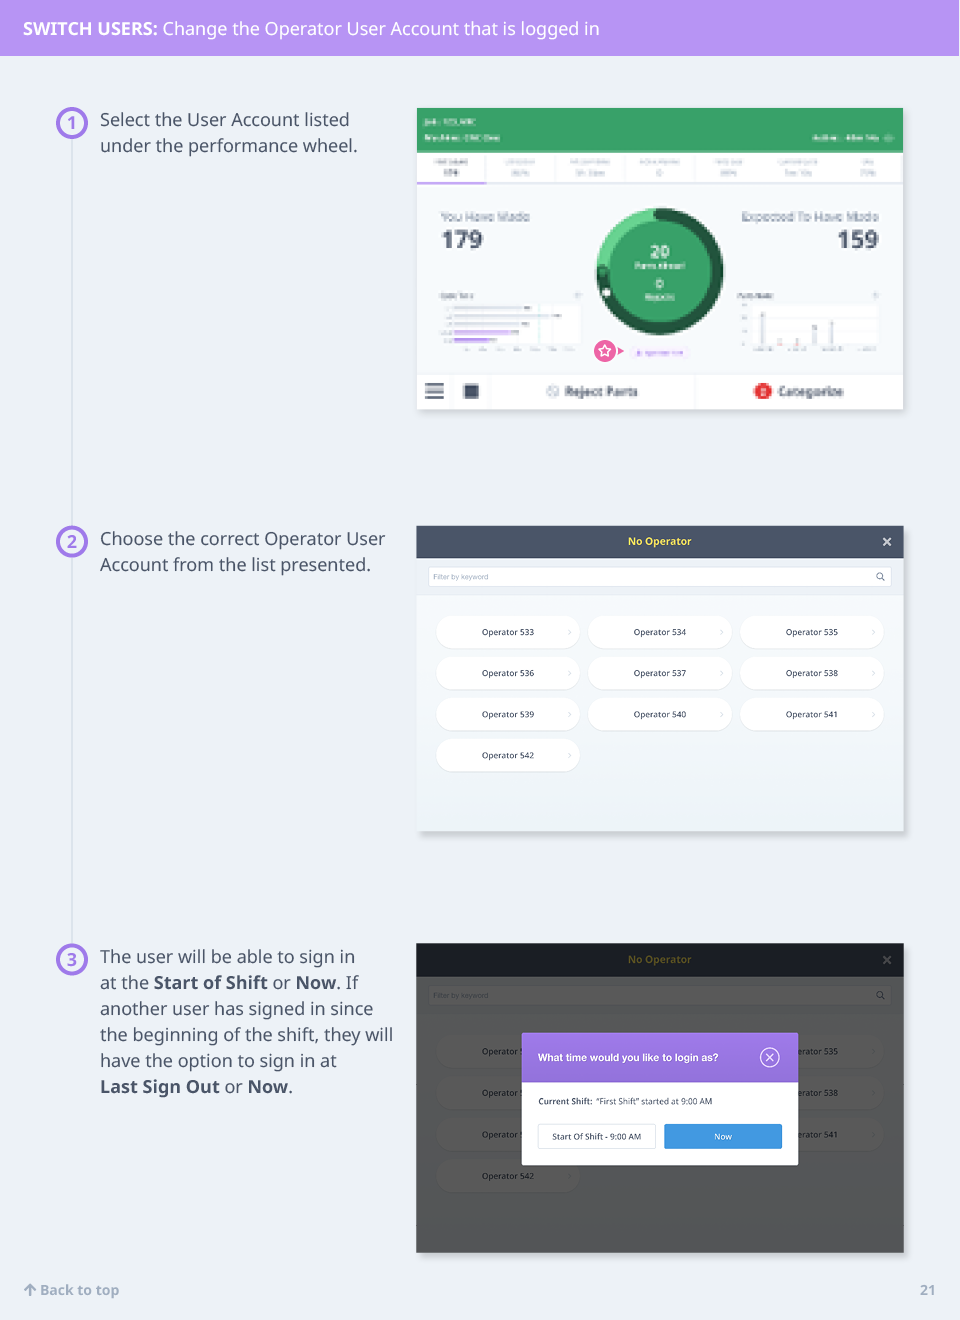
Use Case: Shift change, operator swap mid-shift, or operator covering break.
Logging Out
Step-by-Step:
- Tap menu icon (☰) in bottom left corner
- Select "Sign Out"
- Confirm logout
- Operator session ends
Automatic Logout:
- Operators are automatically logged out at end of shift (based on shift schedule)
- No manual logout required if leaving at scheduled shift end
Language Selection
Changing Display Language:
- Tap menu icon (☰)
- Select "Language"
- Choose language from list
- Interface immediately updates to selected language
Supported Languages:
- English
- Spanish
- (Additional languages may be available depending on version)
Starting and Stopping Operations
Manual Operations Mode
When Machine Operations are Manual: Operators manually start and stop Production Runs from the tablet.
Starting a Production Run
Step 1: Select "Start Run"
- Tap "Start Run" button in Navigation Bar
- Operation selection screen appears
Step 2: Select the Operation
- Choose operation from list of available operations
- Operations shown based on:
- Machine-specific operations
- Machine group operations
- "All Machines" operations
- Search box available if many operations
Step 3: Enter Work Order (if applicable)
- If Work Order fields enabled:
- Enter work order number/name
- Or select "No Work Order" to proceed without
- If Work Order fields not enabled, this step is skipped
Step 4: Review Operation Overview
- Operation details displayed:
- Operation name
- Part number
- Expected cycle time
- Quantity required (if set)
- Review and confirm
Step 5: Select Activity
- Choose activity type:
- Setup: Pre-production setup (fixtures, tools, first article)
- Production: Active part production
- Production Run begins
During a Production Run
Switching Activities:
- Tap current activity in Navigation Bar
- Select new activity:
- Setup: Switch from Production to Setup
- Production: Switch from Setup to Production
- Pause: Temporarily pause production
- Activity changes immediately, tracked separately in reports
Pausing Production:
- Tap "Pause" button (if available)
- Production Run paused (timer stops)
- Resume by tapping "Resume" button
Stopping Production:
- Tap "Stop" icon in Navigation Bar
- Confirm stop
- Production Run ends
- Return to Step 1 (Select Operation)
Automatic Operations Mode
When APM (Automatic Production Monitoring) Enabled: Machine automatically creates and starts Production Runs based on program data.
Operator Capabilities:
- Cannot manually start/stop Production Runs (automatic)
- Can switch activities (Setup ↔ Production)
- Can categorize downtime, reject parts, manage work orders
Switching Activities (Automatic Mode):
- Tap current activity in Navigation Bar
- Select new activity (Setup or Production)
- Production Run continues, activity tracked separately
Benefits of Automatic Mode:
- No operator input required to track production
- Reduces operator burden
- Ensures all runs are tracked
- See Automated Production Monitoring
Categorizing Downtime
Why Categorize Downtime?
Benefits:
- Understand root causes of downtime
- Identify improvement opportunities
- Enable automated workflows (notify maintenance, material handlers)
- Track downtime reduction initiatives
Goal: Categorize downtime as it occurs (not retroactively).
Downtime Categories
Common Categories:
- Setup/Changeover
- Waiting for Material
- Waiting for Operator
- Tooling Issues
- Maintenance
- Quality Issues
- Operator Break
- Other
Custom Categories:
- Configured by IT Admin or Manager
- Can have parent categories and subcategories
- Example: Tooling → Tool Change, Tool Break, Lack of Tooling
Methods for Categorizing Downtime
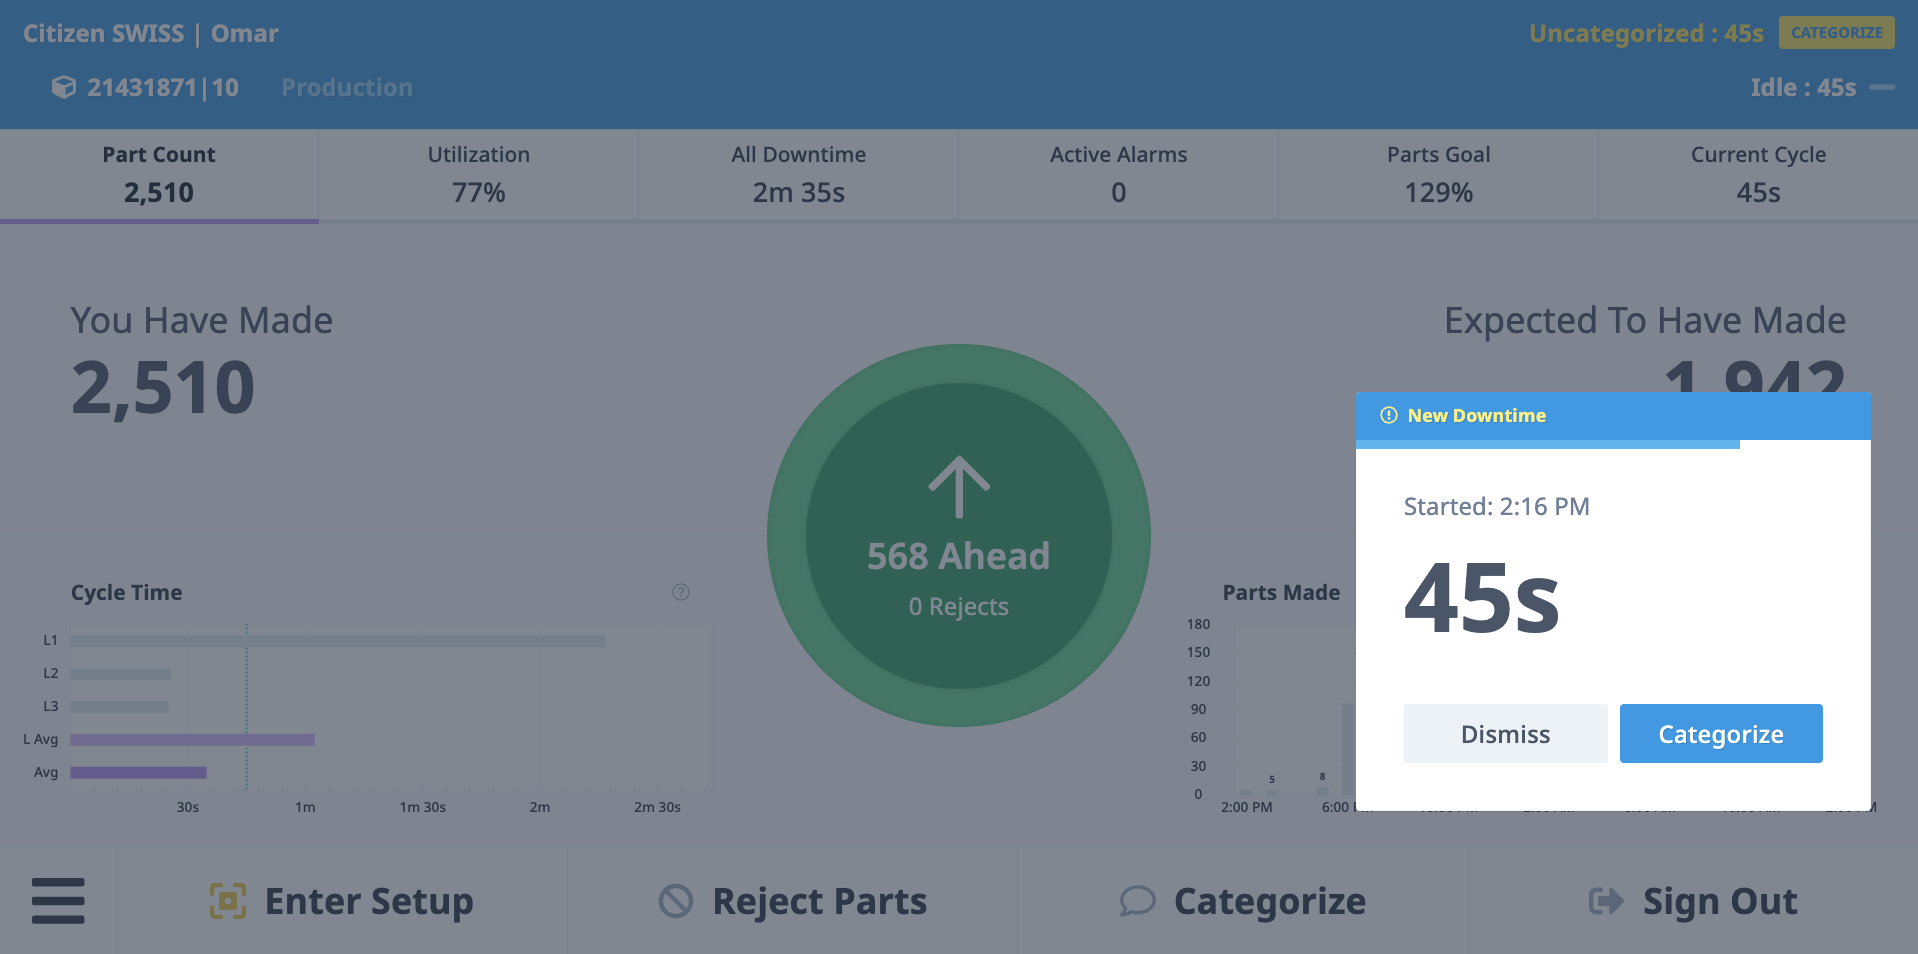
Method 1: Current Downtime Event (Immediate)
Most Common Method:
- Pop-up appears in bottom right of tablet interface
- Prompts operator to categorize immediately
- "Categorize this downtime event?"
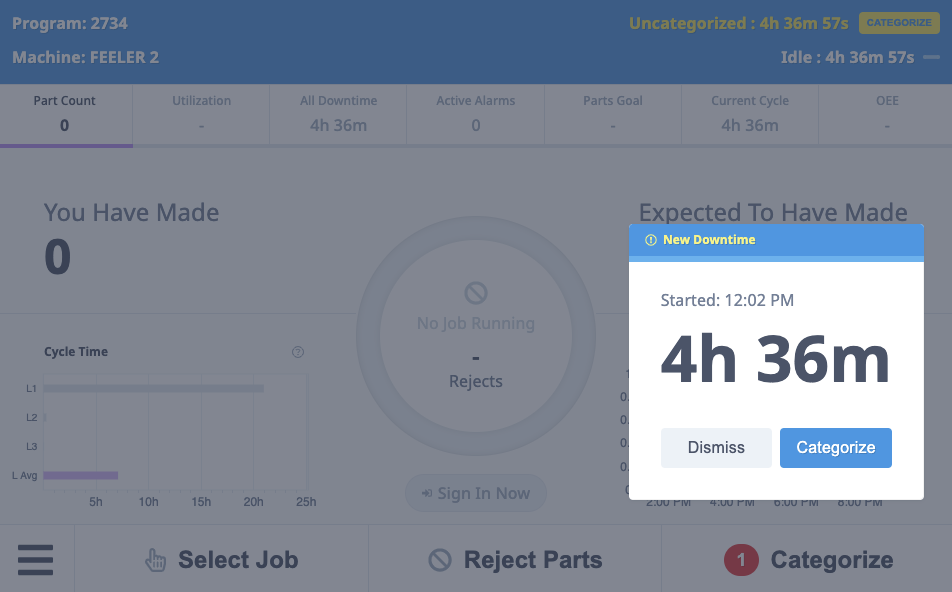
Steps:
- Pop-up appears when downtime occurs
- Tap "Categorize" button
- Select downtime reason from list
- Add note (optional)
- Tap "Save"
Benefits:
- Captures reason while fresh in operator's mind
- Most accurate categorization
- Reduces uncategorized downtime
Method 2: On-Demand Categorization
Categorize Button in Navigation Bar:
- "Categorize" button with red badge showing count of uncategorized events
- Available from any tab
- Tap to enter categorization flow
Steps:
- Tap "Categorize" button (bottom navigation)
- List of uncategorized downtime events appears
- Select event to categorize
- Choose downtime reason
- Add note (optional)
- Tap "Save"
Use Case:
- Operator dismissed pop-up during event (was busy)
- Reviewing downtime at end of shift
Method 3: All Downtime Tab
Comprehensive Downtime View:
- Navigate to "All Downtime" tab
- Shows all downtime events for shift (categorized and uncategorized)
- Filter by:
- Status: Categorized, Uncategorized, All
- Type: Downtime category
- Time: Time range
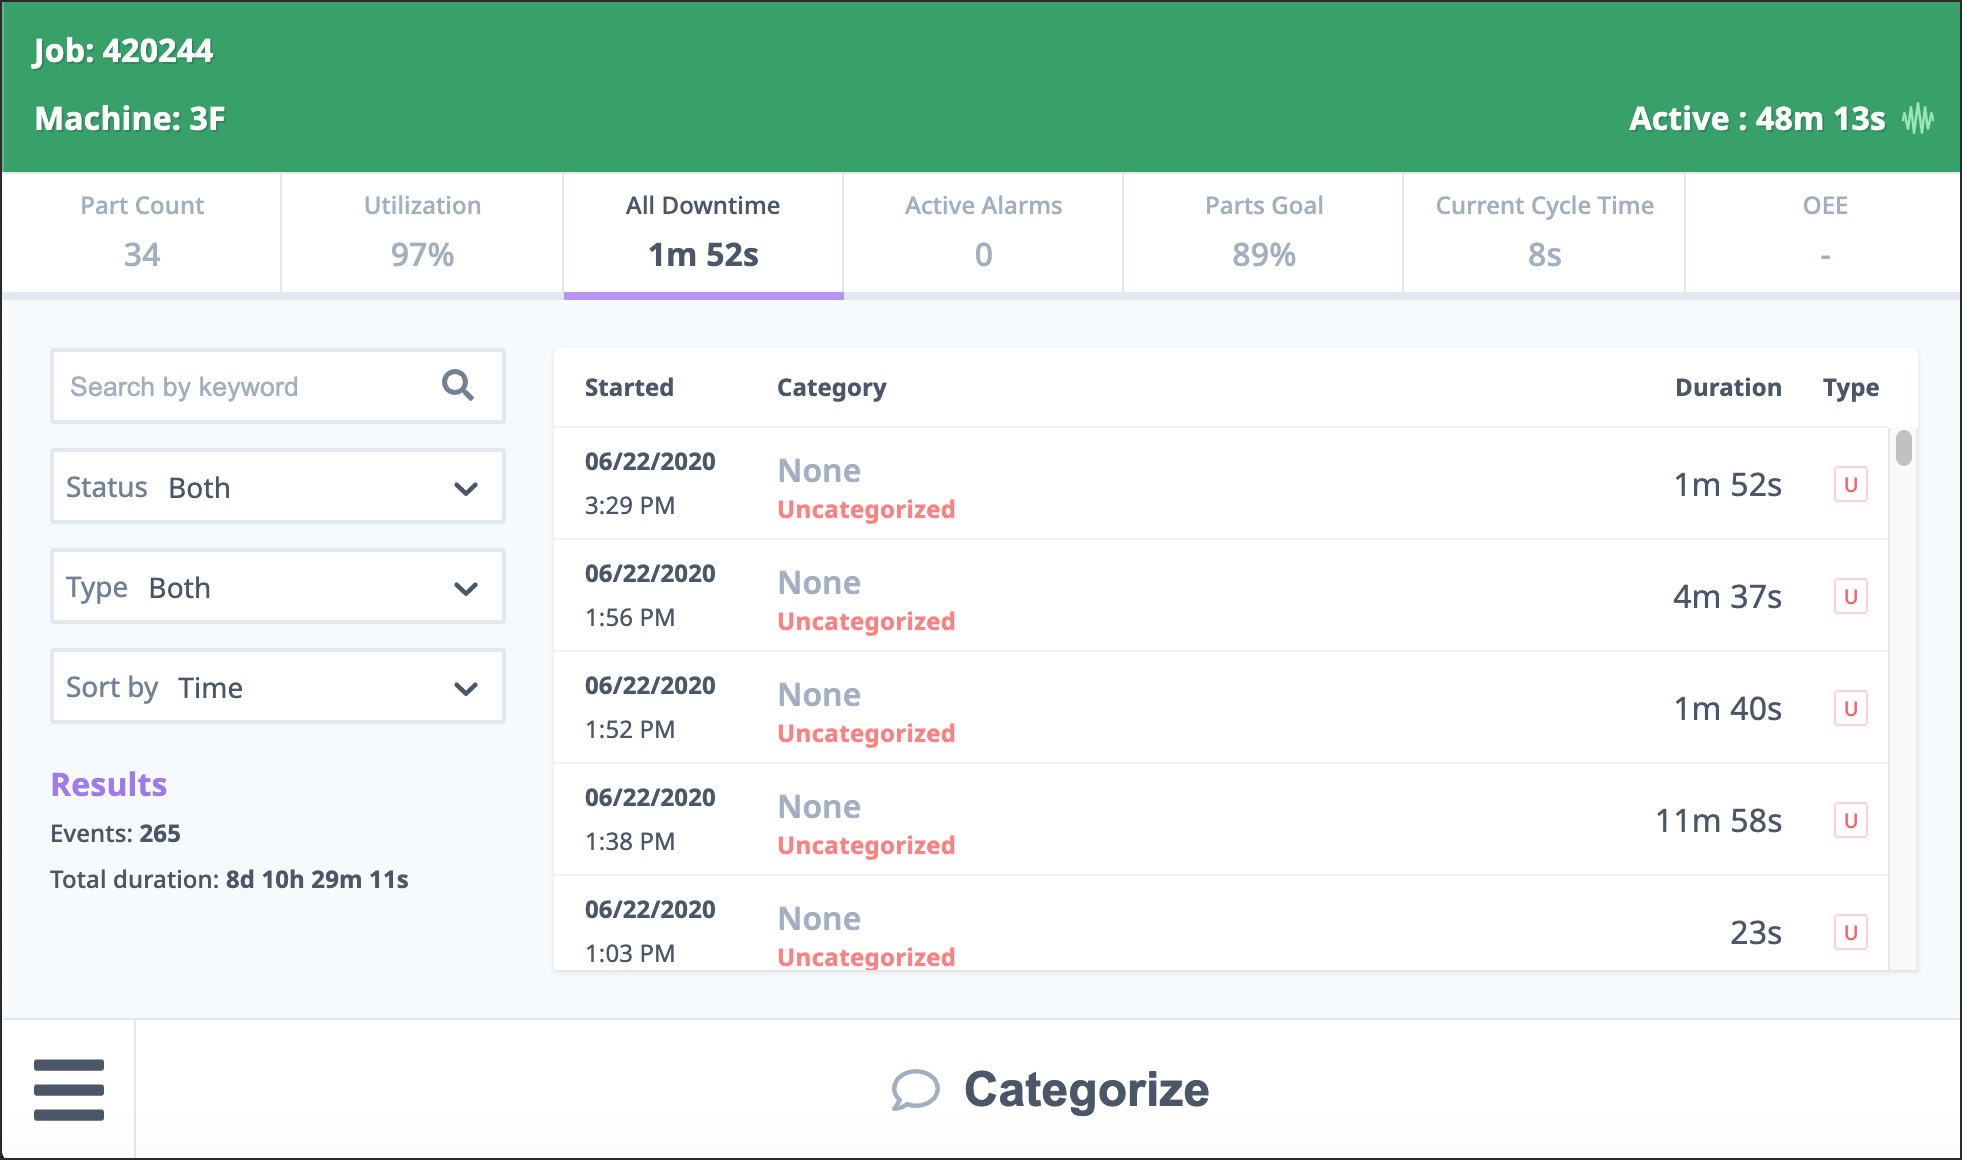
Categorizing from All Downtime Tab:
- Open "All Downtime" tab
- Find uncategorized event (marked with indicator)
- Tap event
- Select downtime reason
- Add note (optional)
- Tap "Save"
Use Case:
- Reviewing all downtime for shift
- Identifying patterns (multiple events of same type)
Method 4: Retroactive Categorization (Managers/Executives)
For Uncategorized Events:
- Managers and Executives can categorize downtime after the fact
- Available in:
- Operator Dashboard tablet interface
- Timelines Dashboard (web interface)
- See Timelines Dashboard
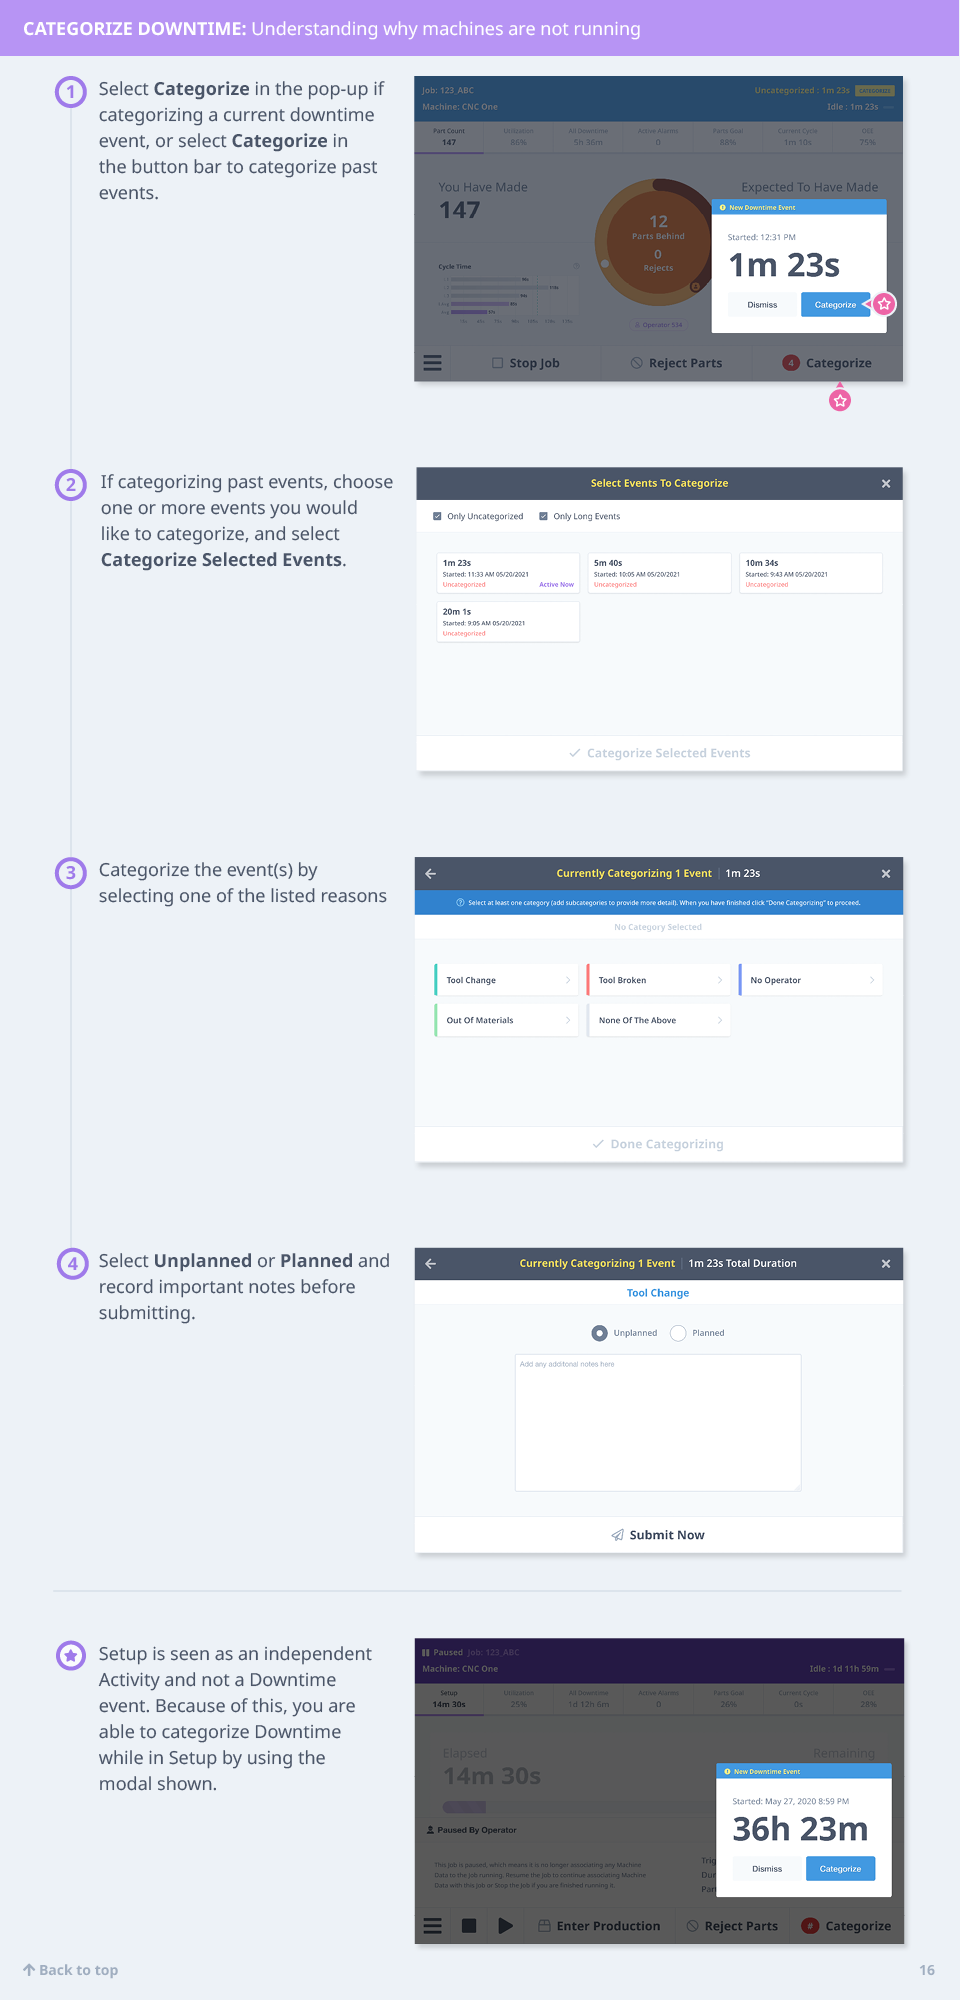
Categorization Flow
Typical Flow:
- Downtime event occurs (machine goes inactive)
- Pop-up appears on tablet
- Operator selects category from list
- (Optional) Operator can search or filter categories
- (Optional) Operator adds note for additional context
- Operator taps "Save"
- Downtime categorized, pop-up dismissed
Adding Notes:
- Text field for additional details
- Examples:
- "Waiting for bar stock delivery"
- "Tool #3 broke at 2:30 PM"
- "Setup taking longer due to complex fixture"
- Notes appear in reports and downtime analysis
Splitting a Downtime Event
If the reason for a downtime changes while the machine is still idle, operators can split the current downtime event into two separately categorized events without waiting for the machine to return to active.
The SPLIT DOWNTIME button only appears after the current downtime event has been categorized. If no category has been selected yet, the button is hidden.
Steps
- From the ShopPulse downtime screen, select a category for the current downtime so the event is no longer uncategorized.
- Tap SPLIT DOWNTIME in the upper right of the screen.
- Choose the new category for the time going forward.
- Repeat as needed if the reason changes again during the same idle period.
What happens at the split point:
- The original downtime event closes immediately under the first category.
- A new downtime event begins under the newly selected category.
An operator begins a part changeover, then goes on a scheduled break before the changeover is complete. Splitting allows the changeover time and the break time to be tracked as two separate, accurately categorized events instead of one combined block.
Parts Produced and Rejected
Parts Produced
Automatic Tracking:
- Machine signals automatically track parts produced
- No operator input required (unless manual entry enabled)
- Displayed in real-time on Operator Dashboard
Part Count Tab:
- Shows parts made vs. expected parts made
- Uses Expected Part Count calculation (based on time and expected cycle time)
- Performance Wheel shows visual comparison:
- Green: Meeting or exceeding expected
- Yellow: Behind expected
- Red: Significantly behind expected
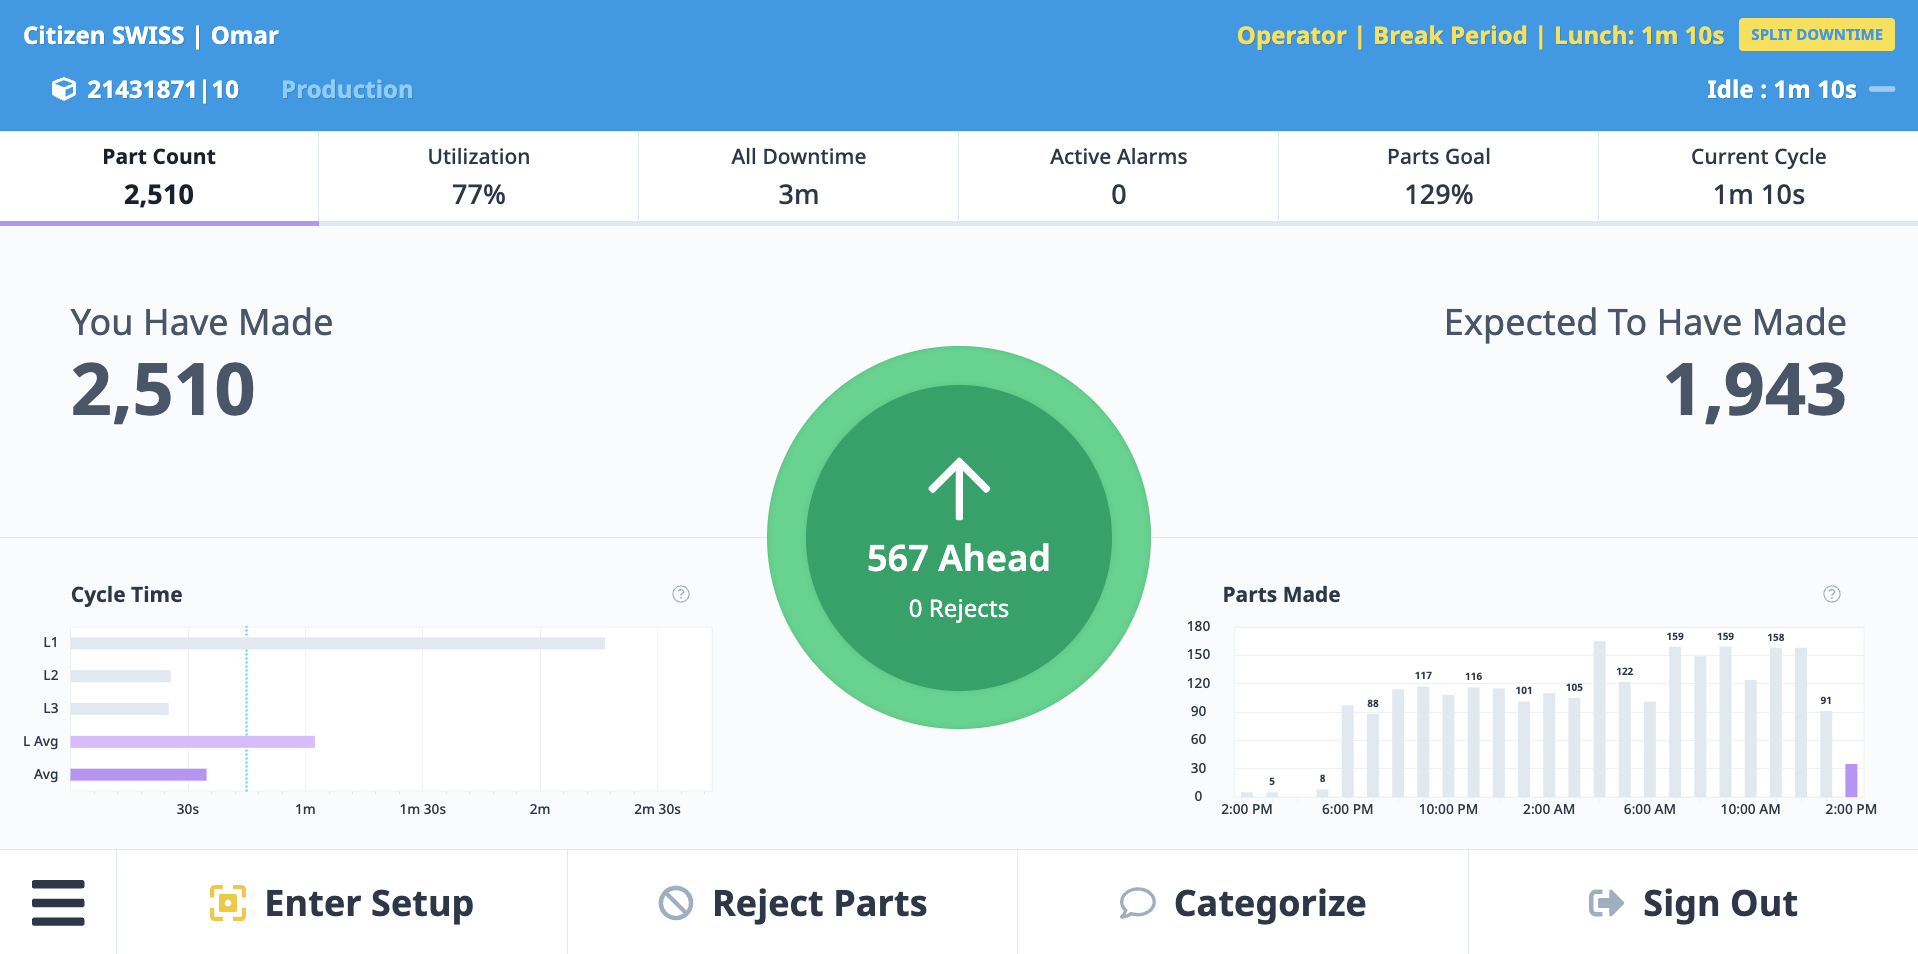
Parts Goal Tab:
- Compares actual parts made to expected parts (from operation definition)
- Uses Expected Part Rate (from Job Performance Standards)
- Shows burn-up chart (cumulative parts over time)
- Target line shows expected production
- Actual line shows real production
- Gap indicates ahead/behind schedule
Rejecting Parts
When to Reject:
- Part fails quality check
- Part needs rework
- Part is scrap
Method 1: During Job Run
Step-by-Step:
- Tap "Reject Parts" button in Navigation Bar
- Available from any tab at any time
- Reject parts flow opens
Reject Parts Flow:
- Select Quantity: Enter number of parts to reject
- Select Reason: Choose from reject reason hierarchy
- Parent categories (e.g., "Tooling Issues")
- Subcategories (e.g., "Dull Tool", "Tool Break")
- Add Note (optional): Additional details
- Tap "Save"
Example:
Quantity: 3
Reason: Quality Issues → Out of Tolerance → Dimension A Oversize
Note: "Measured 1.005", spec is 1.000" ±0.002""
Method 2: During Setup
Setup Scrap:
- If company tracks Setup, operators can input scrapped parts during setup process
- Setup scrap tracked separately from production scrap
- Affects Quality calculation
Quality Tracking
Who Can Reject Parts:
- Operators: Reject at machine during production
- Quality Management Team: Reject after job completion (post-production inspection)
Rejected Parts Include:
- Scrap (unusable)
- Rework (needs additional work)
Impact on OEE:
- Quality % = (Good Parts / Total Parts) × 100%
- Rejected parts reduce Quality score
- Quality is one of three OEE components (Availability, Performance, Quality)
- 100% Quality = no rejects
Reject Reason Hierarchy:
- Configured by IT Admin or Manager in Settings
- Parent categories and subcategories
- More specific reasons enable better root cause analysis
Example Hierarchy:
Quality Issues
  ├─ Out of Tolerance
  │   ├─ Dimension A Oversize
  │   ├─ Dimension B Undersize
  │   └─ Dimension C Out of Spec
  ├─ Surface Finish
  └─ Cosmetic Defects

Tooling Issues
  ├─ Dull Tool
  ├─ Tool Break
  └─ Wrong Tool
Work Order Management
What are Work Orders?
Work Orders link Production Runs to ERP/MES systems.
Purpose:
- Associate MachineMetrics data with ERP work orders
- Track production against specific customer orders
- Enable data sync between systems
Prerequisites:
- Must be enabled: Settings → Operator Dashboard → General → Enable Work Order Fields
Adding Work Orders
During Operation Start:
- When starting a production run (see Starting Operations)
- Step 3: "Enter Work Order"
- Enter work order number/name
- Or select "No Work Order" to proceed without
After Operation Started:
- Tap "No Work Order" button in Navigation Bar
- Enter work order name/number
- Tap "Submit"
- Work order activated (doesn't interrupt current run)
Editing Work Orders
Modifying Current Work Order:
- Tap current Work Order button in Navigation Bar
- Select "Edit Work Order"
- Modify name/number
- Tap "Submit"
- Work order updated
Use Case:
- Typo in original entry
- Work order number changed by planning department
Starting New Work Order
Closing Current and Starting New:
- Tap current Work Order button in Navigation Bar
- Select "Start New Work Order"
- Enter new work order name/number
- Tap "Submit"
What Happens:
- Current work order closes
- Current Production Run ends
- New Production Run starts automatically
- Same Operation continues
- New work order associated with new Production Run
Use Case:
- Producing same part for different customer orders
- Sequential work orders for same operation
Tabs and Metrics
Default Tabs
Part Count Tab:
- Most commonly used tab
- Shows parts made vs. expected parts made
- Performance Wheel with percentage
- Large numeric display
- Updates in real-time
Utilization Tab:
- Utilization percentage (in-cycle time / total time)
- Performance Wheel with color coding
- Time breakdown (active, inactive, disconnected)
All Downtime Tab:
- List of all downtime events for shift
- Filter by status, type, time
- Categorize uncategorized events
- Review downtime history
Active Alarms Tab:
- Current active alarms
- Alarm code and message
- Duration of alarm
- Alarm history (recent cleared alarms)
Parts Goal Tab:
- Burn-up chart (actual vs. target)
- Parts produced vs. parts goal (from operation)
- Progress toward target
- Ahead/behind indicator
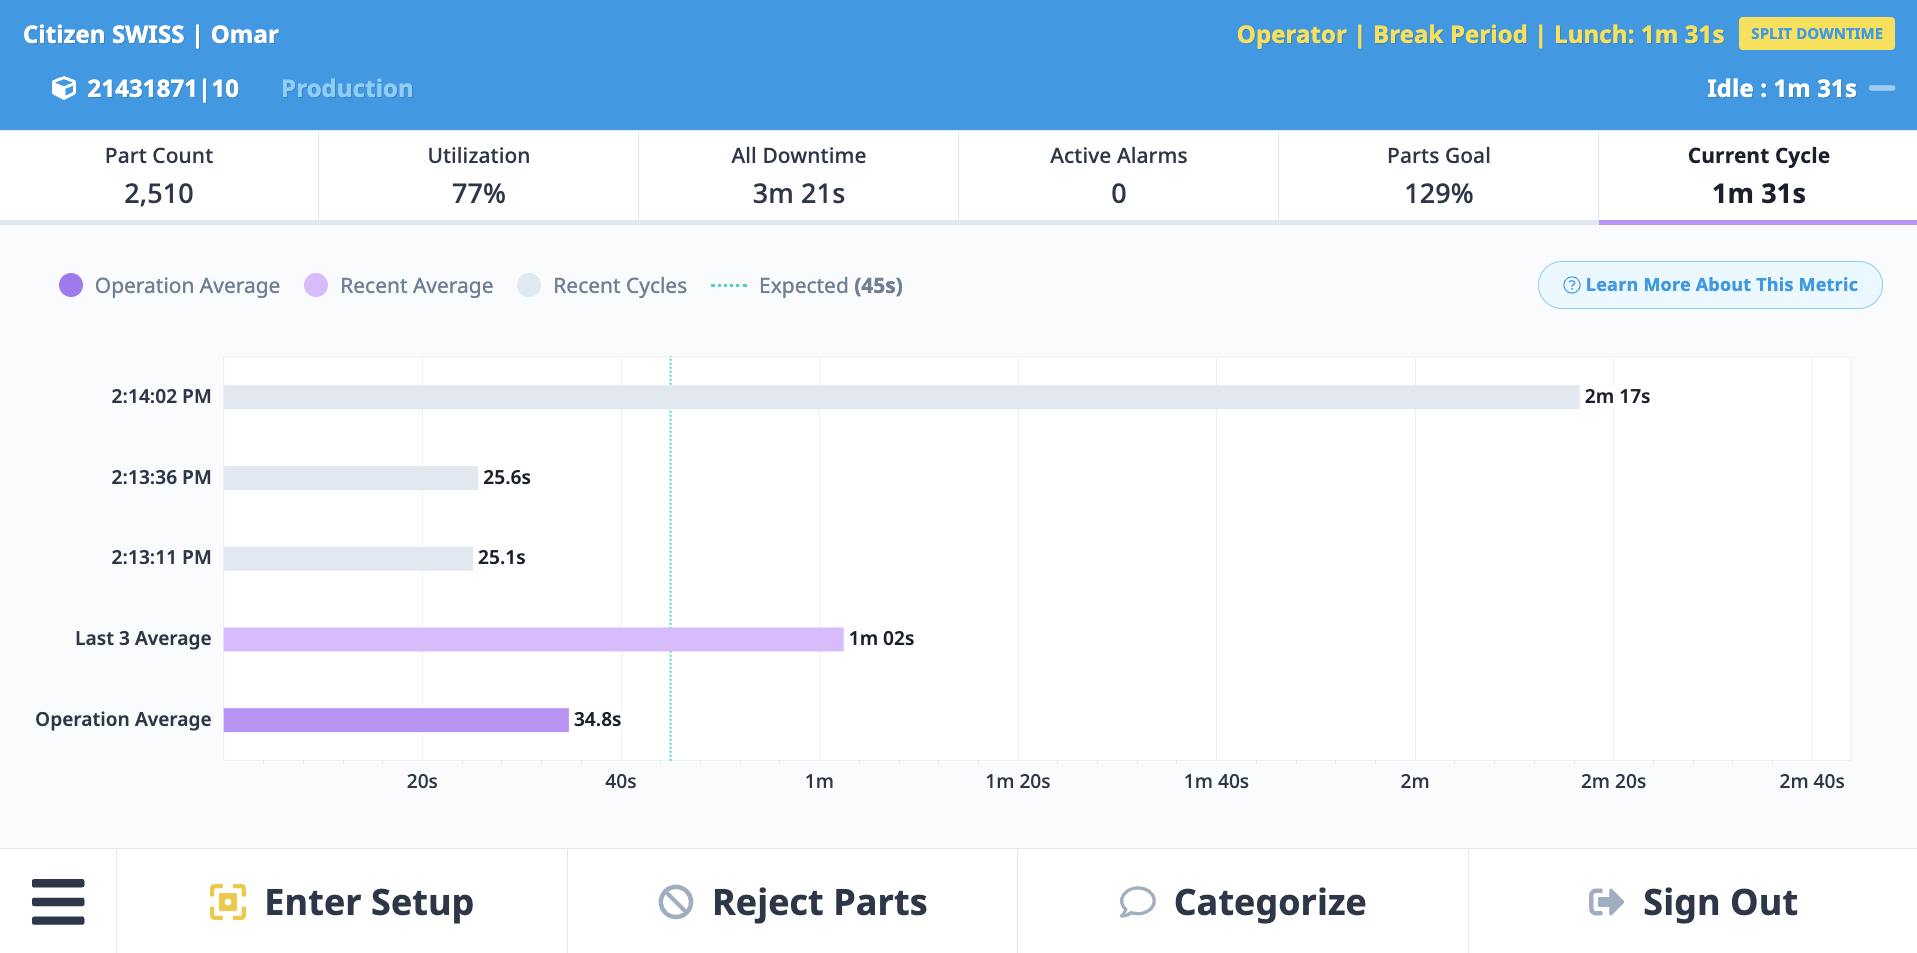
Current Cycle Time Tab:
- Current cycle time vs. expected cycle time
- Cycle time trend (last 10-20 cycles)
- Average cycle time
- Variability indicator
OEE Tab:
- Overall Equipment Effectiveness percentage
- Performance Wheel with color coding
- Breakdown:
- Availability %
- Performance %
- Quality %
Tab Customization
Managing Tabs:
- Settings → Operator Dashboard → Manage Tabs
- Add custom tabs
- Reorder tabs (drag and drop)
- Hide default tabs (if not needed)
- Customize per machine or company-wide
Custom Tab Types:
- Websites (external)
- Web apps
- Google Drive documents
- Videos (embedded)
- Forms (Google Forms, surveys)
- Any iframe-compatible content
Custom Tabs
What are Custom Tabs?
Custom Tabs allow you to embed external content into the Operator Dashboard.
Use Cases:
- Work instructions (Google Docs)
- Drawings and specifications (PDFs in Google Drive)
- CNC calculators or reference tools
- Training videos
- Quality inspection checklists (Google Forms)
- Trello boards for task tracking
- Company intranet pages
Adding Custom Tabs
Step-by-Step:
- Navigate to Settings → Operator Dashboard → Manage Tabs
- Click "Add Custom Tab"
- Configure tab:
- Tab Name: Display name (e.g., "Work Instructions")
- URL: Full URL to content (e.g., https://docs.google.com/document/d/...)
- Icon (optional): Select icon for tab
- Machines: Apply to all machines or specific machines
- Click "Save"
- Custom tab appears on Operator Dashboard
Custom Tab Examples
Example 1: Work Instructions
- Tab Name: "Work Instructions"
- URL: Google Docs link with setup procedures
- Use Case: Operators reference during setup
Example 2: CNC Calculator
- Tab Name: "Feeds & Speeds"
- URL: https://www.cnccookbook.com/feeds-speeds-calculator/
- Use Case: Operators look up optimal cutting parameters
Example 3: Quality Checklist
- Tab Name: "Quality Check"
- URL: Google Forms link with inspection checklist
- Use Case: Operators complete first article inspection form
Example 4: Training Video
- Tab Name: "Setup Video"
- URL: YouTube or Vimeo embed link
- Use Case: New operators watch setup video
Restrictions and Limitations
Sites that Block iframes:
- Some websites prevent embedding in iframes (security policy)
- If site doesn't load, it likely blocks iframes
- Solution: Use alternative site or direct link (opens in separate tab)
Adblockers:
- Browser adblockers can interfere with custom tabs
- If content doesn't load, try disabling adblockers
- Or whitelist MachineMetrics domain
Authentication:
- If content requires login (e.g., Google Docs), operator must be logged into that account on the tablet
- Or use public/shared links that don't require authentication
Automatic Document Viewer (Beta)
What is Automatic Document Viewer?
Automatic Document Viewer displays documents or Google Forms corresponding to the active Operation, automatically changing when the operation changes.
Key Feature:
- No operator input required
- Document switches automatically when operation starts
- Each operation can have its own document (work instructions, drawings, etc.)
Prerequisites:
- Beta feature (must be enabled in Labs page)
- Google Drive authentication required
- Documents stored in Google Drive
Setting Up Automatic Document Viewer
Step 1: Enable in Labs
- Navigate to Settings → Labs
- Find Automatic Document Viewer
- Toggle Enable
- Authenticate with Google Drive account
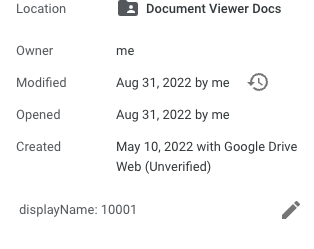
Step 2: Configure Documents
Linking Documents to Operations:
- Add operation name to Google Drive file description
- Format options:
displayName: Operation Display NameName: Operation Name
Example:
Google Drive File: "Part 1077280 Setup Instructions.pdf"
Description: "displayName: 1077280-OP10"

When operator starts operation "1077280-OP10", this PDF automatically displays
Step 3: Add Document Viewer Tab
- Navigate to Settings → Operator Dashboard → Manage Tabs
- Click "Add Custom Tab"
- Select "Automatic Document Viewer"
- Click "Save"
Using Automatic Document Viewer
Operator Experience:
- Operator starts operation (e.g., "1077280-OP10")
- Document Viewer tab automatically loads corresponding document
- Operator reviews work instructions, drawings, etc.
- When operator starts different operation (e.g., "2055443-OP20"), document automatically switches
Benefits:
- Ensures operators always have correct documentation
- Reduces errors from using outdated or wrong documents
- No operator input required (automatic)
Settings and Configuration
Operator Dashboard Settings Location
Access:
- Navigate to Settings → Operator Dashboard
Settings Categories:
- General: Work order fields, language, display options
- Manage Tabs: Add, remove, reorder tabs
- Goal Thresholds: Performance targets for color coding
- Activity Tracking: Setup/Production mode settings
General Settings
Enable Work Order Fields:
- Toggle to enable work order input on tablets
- When enabled, operators can add/edit work orders
- See Work Order Management
Default Language:
- Set company-wide default language for Operator Dashboard
- Operators can override per tablet
Display Options:
- Show/hide specific elements
- Customize information density
Goal Thresholds
Setting Performance Goals: Goals determine Performance Wheel colors (green, yellow, red).
Three Levels:
- System Settings: Company-wide defaults
- Machine Level: Override for specific machine
- Job Level: Override for specific operation
Most Specific Wins: Job > Machine > System
Configurable Goals:
- Utilization Goal: Target utilization percentage
- Example: Green ≥ 85%, Yellow 70-85%, Red < 70%
- OEE Goal: Target OEE percentage
- Example: Green ≥ 70%, Yellow 50-70%, Red < 50%
- Parts Performance Goal: Target parts production rate
- Example: Green ≥ 100% of expected, Yellow 85-100%, Red < 85%
Setting Goals:
- Navigate to Settings → Operator Dashboard → Goal Thresholds
- Set system-wide defaults
- Or navigate to Settings → Machines → Select Machine → Set machine-specific goals
- Or set in operation definition (Job Performance Standards)
Manual vs. Automatic Operations
Machine Setting:
- Navigate to Settings → Machines → Select Machine
- Find Production Settings
- Select:
- Manual Operations: Operators manually start/stop runs
- Automatic Operations: APM automatically creates runs
Impact:
- Manual: Full operator control, requires operator input
- Automatic: No operator input needed, APM handles start/stop
See Also: Starting and Stopping Operations
Activity Tracking
Setup vs. Production Mode:
- Navigate to Settings → Machines → Select Machine
- Find Activity Tracking
- Toggle Enable Activity Tracking
When Enabled:
- Operators can select Setup or Production mode
- Setup time tracked separately
- Setup scrap tracked separately
- Enables planned setup exclusion from OEE
When Disabled:
- All time considered "Production"
- No distinction between setup and production
Job Performance Standards
Expected Part Rate:
- Configured in operation definition
- Includes "button-to-button" production time (setup, teardown, processing)
- Used for Parts Goal calculation
Best Practice:
- Use MachineMetrics data to validate ERP standards
- Update standards over time based on actual data
- More accurate standards = more meaningful goals
Best Practices
Operator Training
Initial Training (30 minutes):
- Overview: What is MachineMetrics, why we use it (10 min)
- Login: How to log in, switch users, log out (5 min)
- Starting Operations: How to start/stop production runs (5 min)
- Categorizing Downtime: Why it matters, how to categorize (5 min)
- Parts and Quality: Rejecting parts, quality impact (5 min)
Ongoing Reinforcement:
- Daily reminders about downtime categorization
- Weekly review of operator data (recognize good practices)
- Visual aids posted at machines (quick reference cards)
Key Messages:
- "Your input helps us improve and makes your job easier"
- "Categorize downtime as it happens (not at end of shift)"
- "It's okay to request help using workflows (we want you to)"
Encouraging Operator Adoption
1. Show Value
- Share how data is used (improvement projects)
- Show reports with operator data (they contributed to this)
- Celebrate wins (downtime reduced, cycle times improved)
2. Make It Easy
- Place tablets where easily accessible
- Keep interfaces simple (hide unused tabs)
- Provide quick reference cards
3. Build Habits
- Daily reminders at shift start
- Recognition for operators who consistently categorize downtime
- Gamification (leaderboards, competitions)
4. Address Concerns
- "Is this tracking me?" → No, it's tracking the machine and process
- "Will I get in trouble for downtime?" → No, we want to understand and fix root causes
- "This is extra work" → Categorizing downtime takes 5 seconds, saves hours of lost production
Data Quality Best Practices
For Accurate Reports:
1. Categorize Downtime as It Occurs
- Most accurate reason when fresh
- Use immediate pop-up (Method 1)
- Review uncategorized at end of shift
2. Sign In at Shift Start
- Enables operator performance tracking
- Use "Start of Shift" option if you forget (backdate)
3. Switch Activities Appropriately
- Setup mode for setup (fixtures, tools, first article)
- Production mode for production
- Don't stay in Setup if producing parts
4. Reject Parts with Specific Reasons
- Use subcategories (not just "Quality Issues")
- Add notes for additional context
- Helps identify root causes
5. Review Data Weekly
- Spot-check for accuracy
- Correct mistakes promptly
- Adjust processes if needed
Tablet Maintenance
Daily:
- Wipe screen clean (chips, coolant, grease)
- Check battery level
- Verify Wi-Fi connection
Weekly:
- Restart tablet (clear memory)
- Check for software updates
- Verify apps are up to date
Monthly:
- Deep clean tablet and mount
- Check mounting hardware (tighten screws)
- Test backup tablets (if available)
Workflow Integration
Operator-Triggered Workflows:
- Configure manual workflow triggers
- Examples:
- "Call Maintenance" button
- "Need Material" button
- "Quality Issue" button
- Reduces unplanned downtime (operators don't leave machines)
- See Automations & Workflows Guide
Downtime Category Workflows:
- Automate notifications based on downtime categories
- Example: "Out of Material" → Notify material handler
- Operators categorize, workflows handle the rest
Getting Help
Common Questions
"Tablet won't load Operator Dashboard"
- Check Wi-Fi connection (connected to correct network?)
- Check browser (use Chrome)
- Clear browser cache and reload
- Verify URL:
operator.machinemetrics.com
"Operator Dashboard not showing correct machine"
- Check machine selection in top right
- Verify logged into correct kiosk account (if using machine-specific accounts)
- Contact IT Admin to verify machine configuration
"Performance Wheel always red"
- Check goal thresholds (are they realistic?)
- Review actual performance (is machine underperforming?)
- Adjust thresholds if needed: Settings → Operator Dashboard → Goal Thresholds
"Categorize button shows large number"
- Many uncategorized downtime events
- Open "Categorize" or "All Downtime" tab
- Categorize events (can batch categorize if same reason)
- Number clears as events categorized
"Custom tab not loading"
- Site may block iframes (try alternative site)
- Check URL (correct and accessible?)
- Disable adblockers
- Authenticate with required account (e.g., Google)
"Work Order fields not showing"
- Feature not enabled
- Navigate to Settings → Operator Dashboard → General
- Toggle "Enable Work Order Fields"
- Contact IT Admin if setting not available
Before Contacting Support
Gather Information:
- Tablet model and OS version
- Browser type and version
- Screenshot of issue
- Steps to reproduce
- When issue started
Try These Steps:
- Refresh page (swipe down or reload)
- Clear browser cache and reload
- Restart tablet
- Try different browser
- Check Wi-Fi connection (strong signal?)
Contact Support
MachineMetrics Support:
- Email: support@machinemetrics.com
- Include:
- Machine name
- Tablet location/identifier
- Screenshot of issue
- Expected behavior vs. actual behavior
- Steps to reproduce
For Training:
- Request operator training session
- Ask about best practices for operator adoption
- Schedule refresher training for existing operators
Next Steps:
- Set up tablets: Tablet Setup
- Configure tabs and settings: Settings and Configuration
- Train operators: Best Practices
- Set up workflows for operators: Automations & Workflows Guide
Questions? Contact support@machinemetrics.com