FOCAS Connectivity Guide
- Overview
- Compatible Machines
- Prerequisites
- Physical Connection
- Network Configuration on the Control
- Adding the Machine in MachineMetrics
- Configuring Data Collection
- Part Counting Methods
- Adapter Script Configuration
- OEM-Specific Notes
- Parameter Management
- Troubleshooting
- Best Practices
- Getting Help
- FOCAS1 vs FOCAS2: What to Expect on Older Controls
Overview
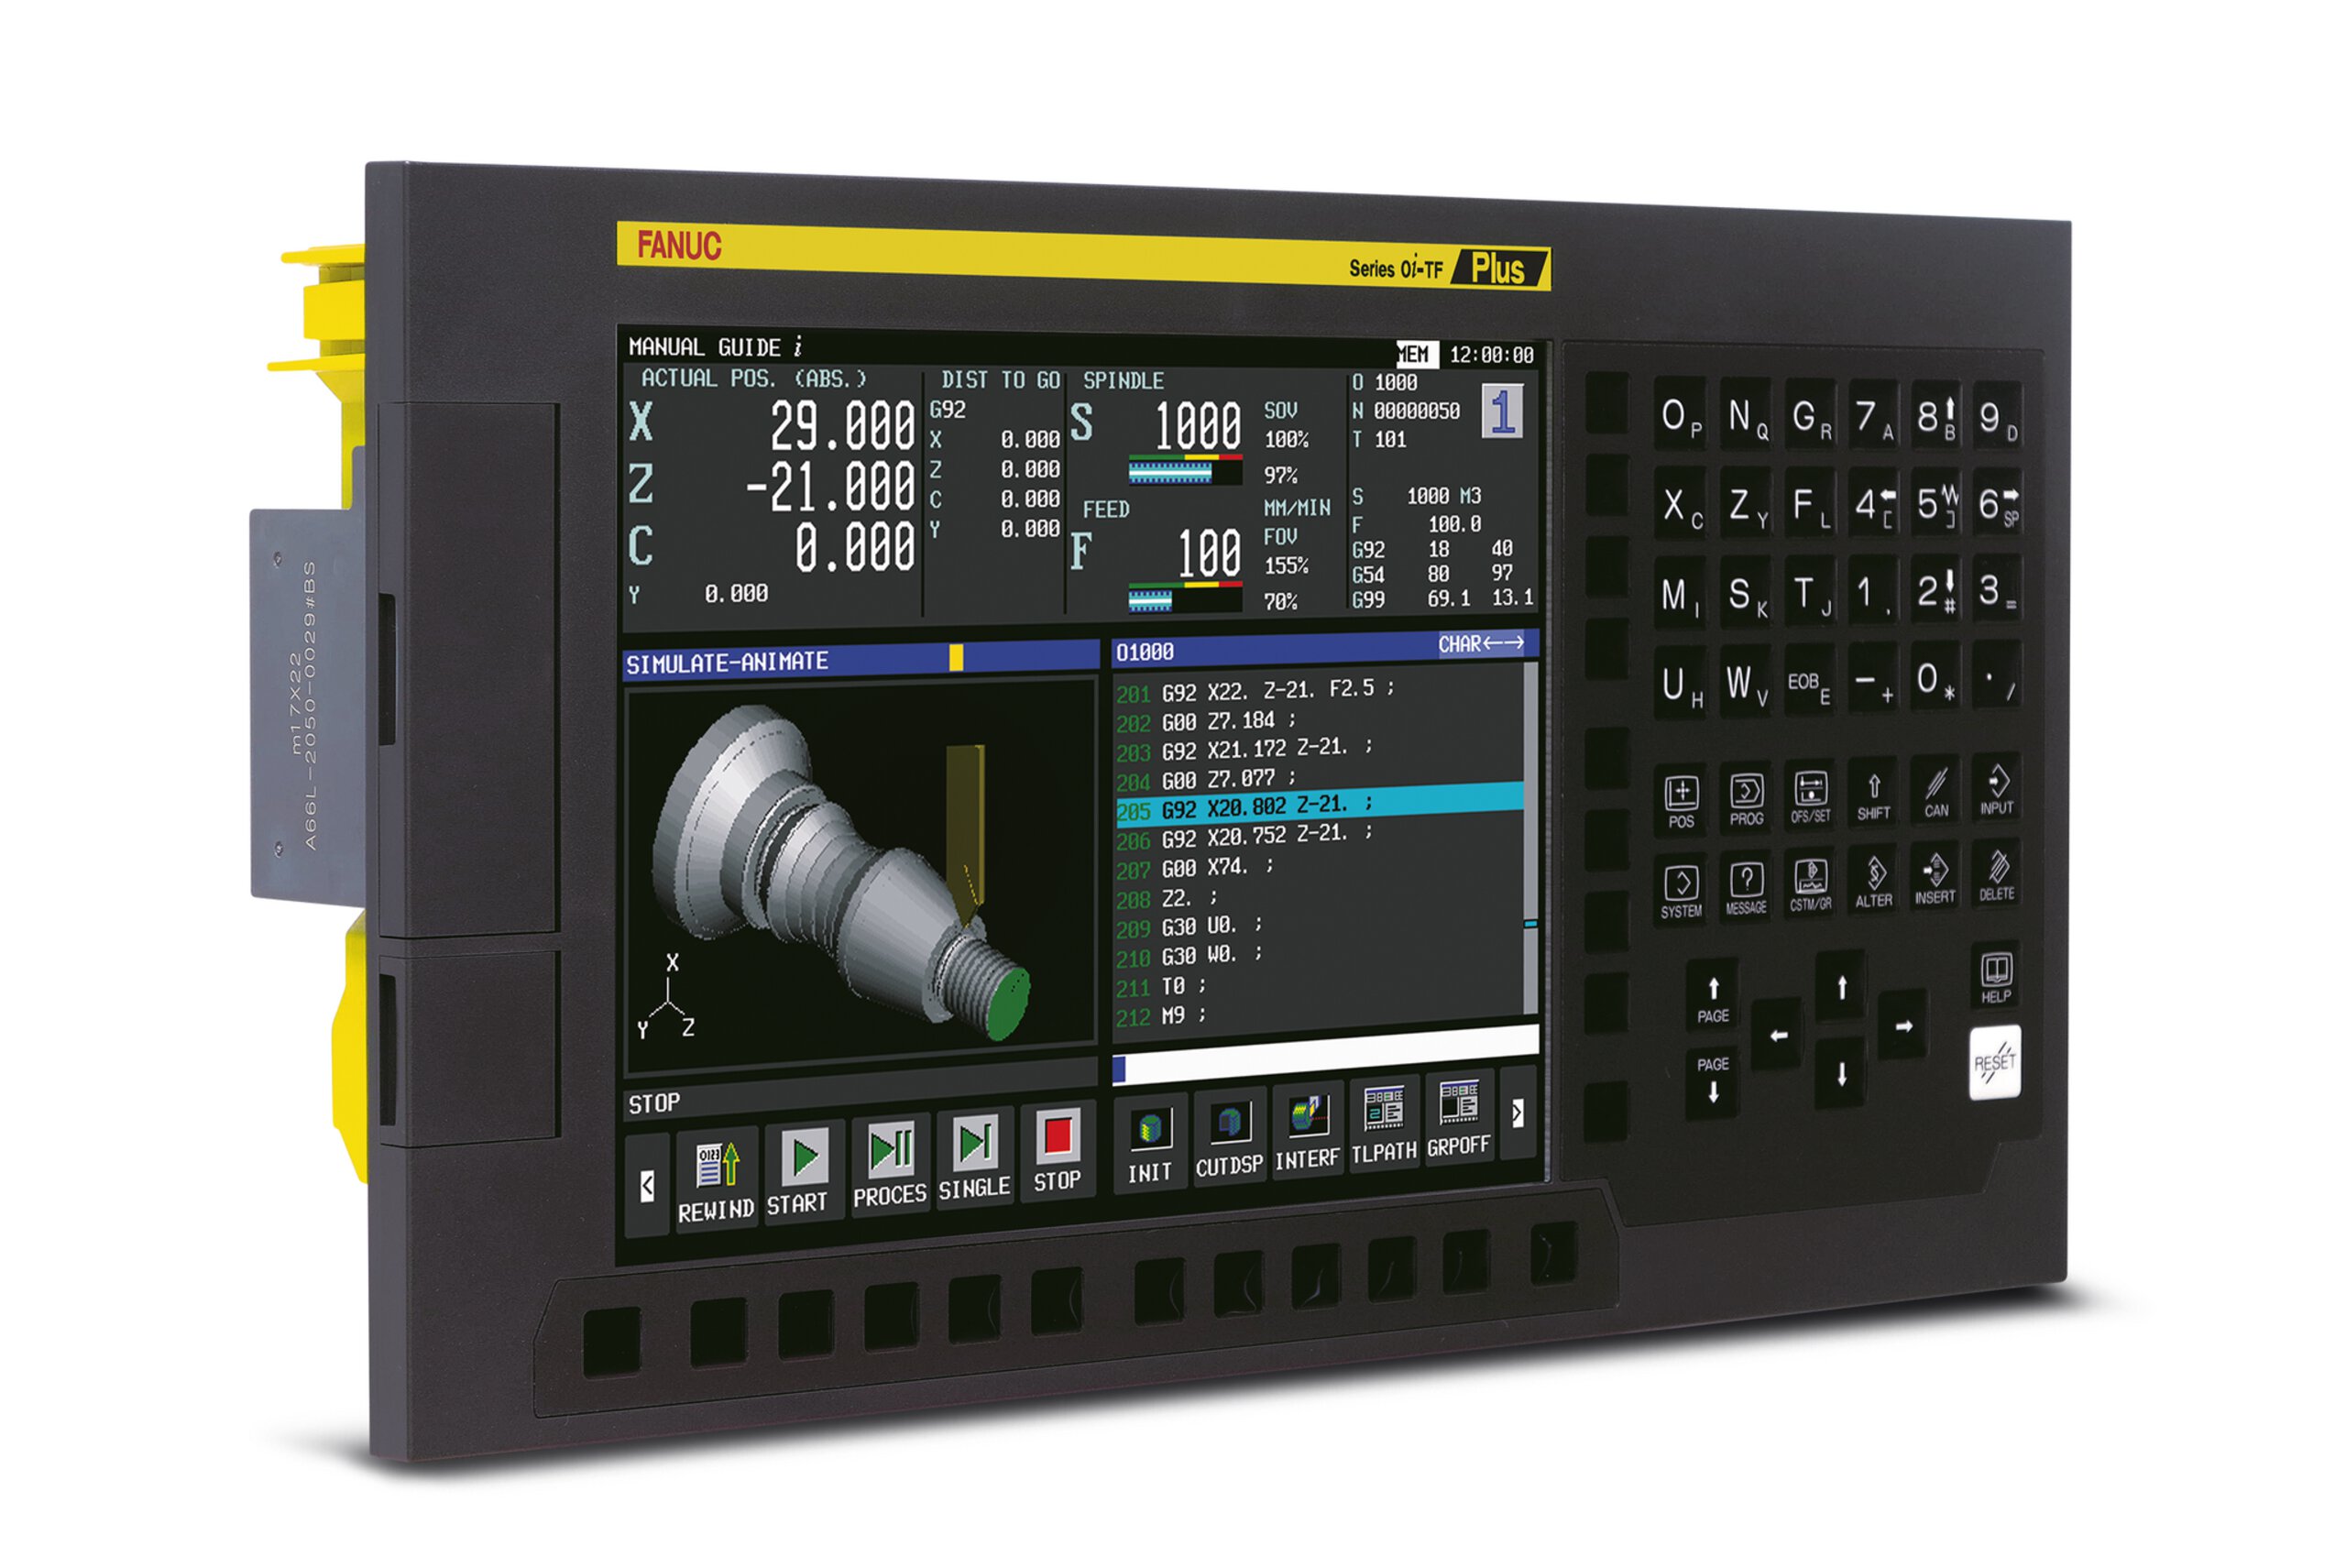
FANUC CNC control panel. FANUC controls use the FOCAS protocol for direct Ethernet connectivity to MachineMetrics, providing real-time machine data including status, programs, tools, and production information.
What is FANUC FOCAS?
FOCAS (FANUC Open CNC API Specification) is a set of library files that enable direct access to nearly all information inside a FANUC CNC control. MachineMetrics uses these libraries to retrieve data from the control via Ethernet, providing comprehensive real-time visibility into machine status, production metrics, and diagnostic information.
Key Benefits:
- Direct, high-speed data access
- No additional hardware adapters required
- Rich data set including alarms, diagnostics, and program information
- Widely supported across FANUC control generations
- Reliable and proven technology
Why FOCAS is Preferred
When a machine is equipped with a modern, FOCAS-enabled FANUC control, it is MachineMetrics' preferred method for data collection because:
- Simple Setup: Often requires only an Ethernet cable
- Comprehensive Data: Access to status, alarms, programs, cycles, and more
- No Additional Hardware: No serial converters or I/O modules needed
- Fast Deployment: Can typically connect in 15-30 minutes
- Reliable: Direct connection to control with minimal points of failure
Who This Guide is For
This guide is for:
- Manufacturing engineers connecting FANUC-controlled equipment
- Maintenance staff configuring machine connectivity
- IT personnel supporting MachineMetrics deployment
- Anyone responsible for connecting machines with FANUC controls
Video: How to connect FANUC FOCAS
Step-by-step video walkthrough for FOCAS connectivity.
Compatible Machines
FOCAS-Enabled Controls
FANUC controls that are approximately 10-15 years old or newer typically support FOCAS.
Controls with FOCAS by default:
- 0i-D/F series
- 16i-B / 18i-B series
- 30i / 31i / 32i / 35i series
FANUC Control Compatibility Table:
| Does NOT have Ethernet/FOCAS | Could have Ethernet (Check) | Has Ethernet as Standard |
|---|---|---|
| O Series | 0i-C* | 0i-D/F |
| 3 / 6 Series | 21i-B* | 16i / 18i B |
| 16 / 15 / 18 / 21 (non-i) | 15i-A/B | 30/31/32/35i Series |
| 16i / 18i / 21i A* |
* Can be upgraded by FANUC to include FOCAS
"i-Series" Designation: Controls with an "i" in the model number (e.g., 0i, 16i, 18i, 31i) may support FOCAS. Most i-Series controls that don't include FOCAS can have it added as an option by FANUC.
Machine Tool Builders Using FANUC
FANUC controls are used worldwide by many machine tool manufacturers. Common brands using FANUC controls include:
- Amada
- DN Solutions (formerly Doosan)
- FANUC Roboshot (injection molding machines)
- Feeler (FFG)
- Makino
- Matsuura
- DMG MORI / Mori Seiki
- Nakamura-Tome
- OKK
- Quaser
- Star Micronics
- Tornos
- Toyoda
- Tsugami
- Yasda
- Many others
How to Check if Your Control Supports FOCAS
Follow these steps on the machine control to verify FOCAS capability:
Step 1: Access System Menu
- Press the SYSTEM hard key on the control panel
- Scroll using the right arrow soft key until you see ETHPRM, EMBED PORT, EMBDD, or ETHER-BOARD
Step 2: Check for Embedded Ethernet Settings
- If you see ETHPRM, EMBDD (embedded), EMBED PORT (embedded port), or ETHER BOARD, your control has embedded Ethernet and likely supports FOCAS
- If you don't see these options, your control may not have embedded Ethernet/FOCAS capability
For 16i/18i/21i and 160i/180i/210i Series (B-models): These controls (16i-B, 18i-B, 21i-B, 160i-B, 180i-B, 210i-B, 160is-B, 180is-B, 210is-B) may have embedded Ethernet as an option. Look for:
- EMBDD or EMBED PORT menu when pressing SYSTEM and scrolling through soft keys
- If these menus don't appear, the control may not have the embedded Ethernet option installed
- These controls can be upgraded by FANUC to include embedded Ethernet/FOCAS if not currently available
Step 3: Verify FOCAS Settings
- Select the Ethernet/Embedded Port menu (EMBDD or EMBED PORT)
- Look for FOCAS 2 and COMMON settings
- If these appear, FOCAS is available
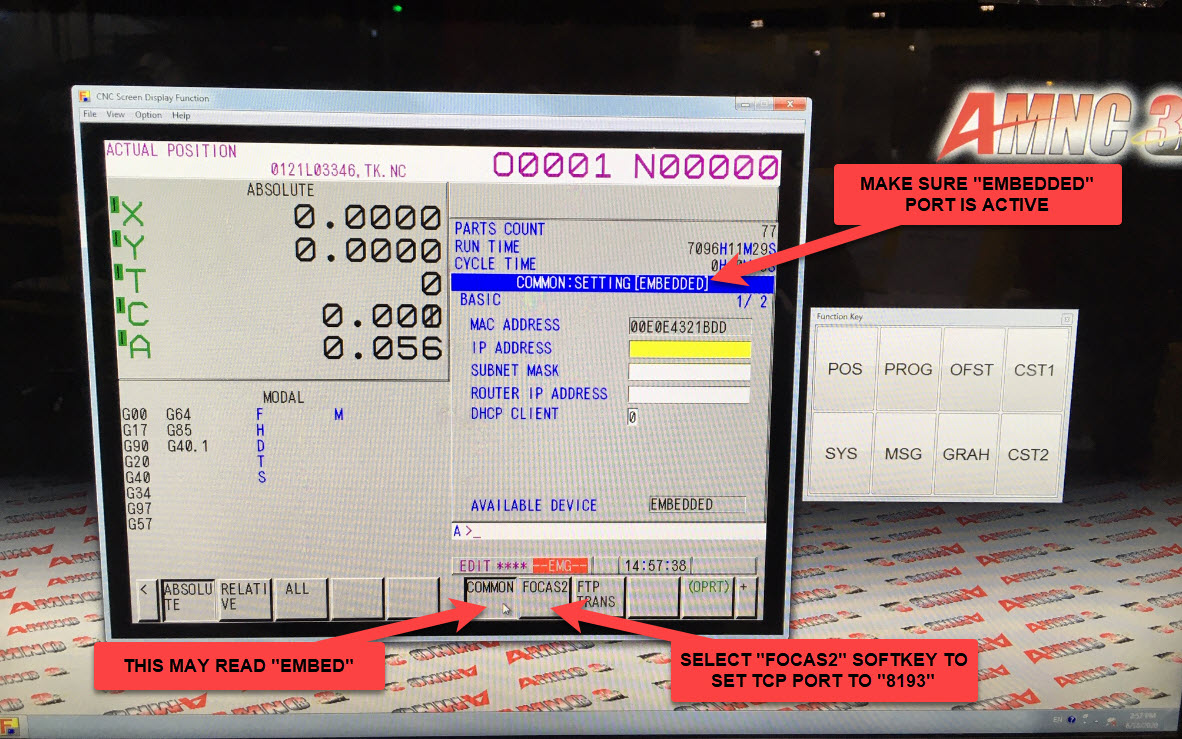
Alternative for Windows-Based Controls:
- Some controls have a Windows backend
- Search for the "CNC Screen Display" program
- Access embedded port settings through this program
Still Unsure?
- Contact your machine tool builder with control model and serial number
- Contact MachineMetrics support with control information
- A MachineMetrics representative can typically confirm FOCAS capability with the control model and year of manufacture
Prerequisites
Before connecting your FANUC machine, ensure you have:
Hardware:
- FANUC-controlled machine with FOCAS capability
- MachineMetrics Edge device (deployed and activated)
- Ethernet cable (CAT5/CAT6)
- Keyboard, monitor, mouse (for control configuration)
Network:
- IP address for the machine (static or DHCP)
- Network access between machine and Edge device
- Subnet and gateway information (if static IP)
Access:
- Physical access to machine control and electrical cabinet
- Permission to modify machine network settings
- Parameter write access (if configuring part counting or advanced features)
Information:
- Machine make and model
- Control model and version
- Current network configuration (if any)
Physical Connection
FANUC Ethernet Port Types (CD38 Variants)
FANUC CNC controls can have multiple Ethernet interfaces, each identified by a CD38 designation. Understanding which port your machine has — and which one to use for FOCAS — is important for successful connectivity.
| Port | Name | Speed | FOCAS Connections | Location | Menu Key | Notes |
|---|---|---|---|---|---|---|
| CD38A | Embedded Ethernet | 10 Mbps | 1 | On the NCU board (main electrical cabinet) or behind the HMI screen | EMBDD or EMBED PORT | Most common port for FOCAS. Standard on 0i-D/F, 16i-B/18i-B, 30i/31i/32i. |
| CD38S | Display Unit Ethernet | 10 Mbps | 1 | Rear of the display unit (operator side) | EMBDD (parameter setting 2) | Same embedded Ethernet function as CD38A, just a different physical location. Common on 0i series controls where the Ethernet connector is routed to the back of the screen instead of the NCU. |
| CD38R | Fast Ethernet (Data Server) | 100 Mbps | 10 | On the optional Ethernet board inside the control cabinet | ETHER BOARD | Add-on option board with a dedicated sub-processor, bypassing the main control bus. Sometimes called "Fast Ethernet" or "Data Server." Preferred when multiple applications need simultaneous FOCAS access. |
| PCMCIA | PCMCIA Ethernet Card | 10 Mbps | 1 | Card slot on the side of the display unit | PCMCIA | Older method using a FANUC-designated PCMCIA Ethernet card inserted into the card slot. Must be a FANUC-approved card — generic cards will not work. Rarely seen on modern controls. |
Which Port Supports FOCAS?
All of the above interfaces can support FOCAS communication. MachineMetrics recommends CD38A or CD38R for FOCAS connectivity. Use CD38S only when CD38A and CD38R are not available. Each interface has its own FOCAS2 configuration page in the control settings with independent IP address and port assignments.
- Embedded + Fast Ethernet (CD38R): If a control has both an embedded port (CD38A or CD38S) and a Fast Ethernet option board (CD38R), both can run FOCAS simultaneously — they are independent interfaces with separate settings under EMBDD and ETHER BOARD respectively.
- Embedded vs PCMCIA: The embedded port and PCMCIA card share the same embedded Ethernet function, so only one can be active at a time.
Finding the Embedded Ethernet Port
The FANUC embedded Ethernet port (labeled CD38A or CD38S) is typically located in one of two places, depending on whether your machine has an LCD-mounted control or a standalone control.
LCD-Mounted Control — Port on Back of CNC Screen
On machines with an LCD-mounted control, the Ethernet port is located on the back of the CNC screen/display unit. Look for the RJ45 port (often labeled CD38A or EMBEDDED PORT) on the rear of the operator display.
Ethernet port (CD38A) on the back of the CNC screen — LCD-mounted control.
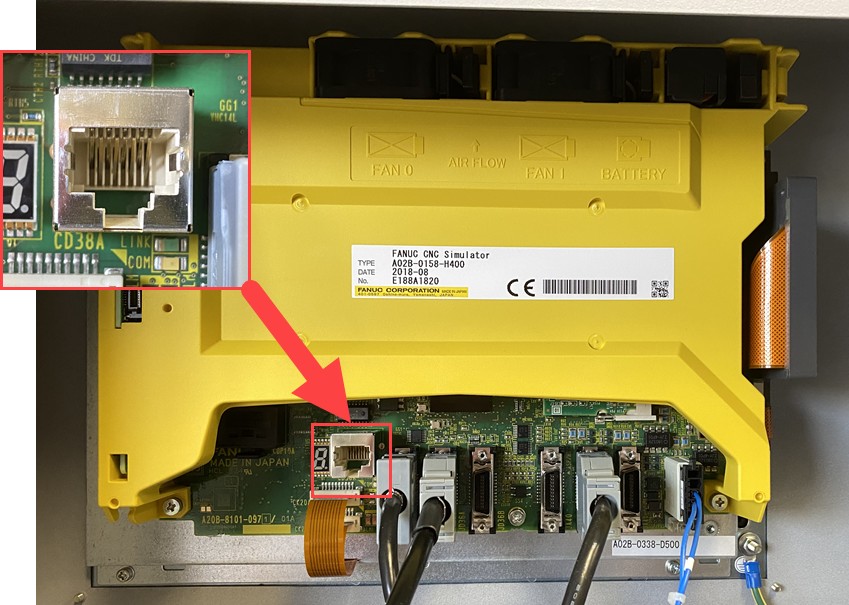
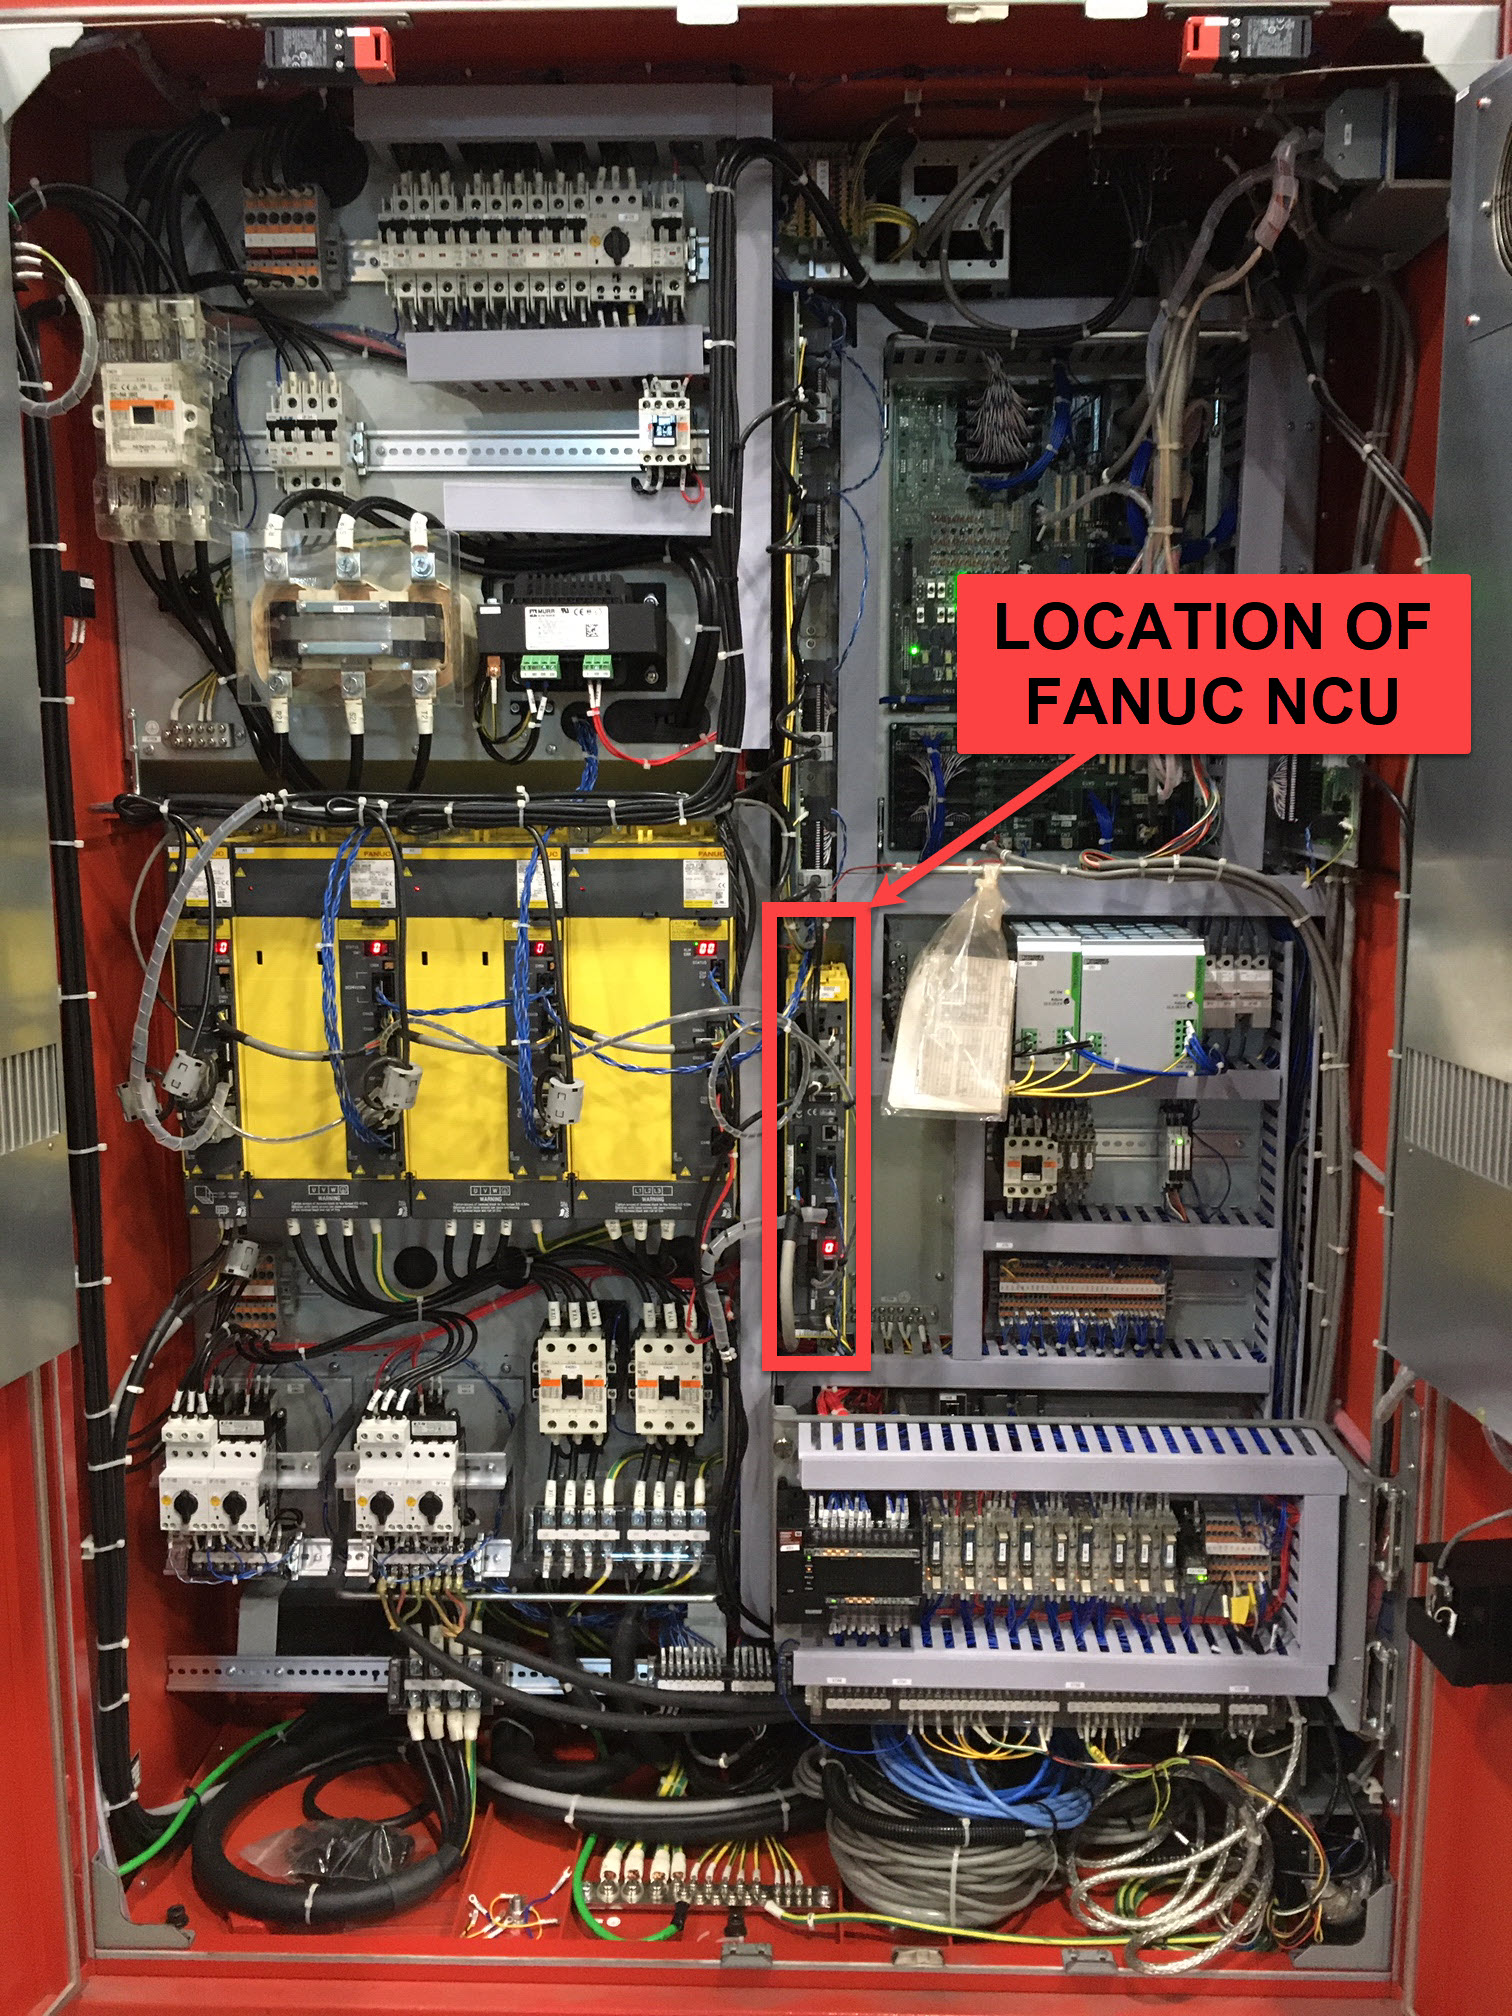
Standalone Control — NCU in Electrical Cabinet
On machines with a standalone control, the FANUC NCU (Numerical Control Unit) is located inside the electrical cabinet. Open the cabinet and locate the yellow FANUC NCU module. The embedded Ethernet port is on the NCU board.
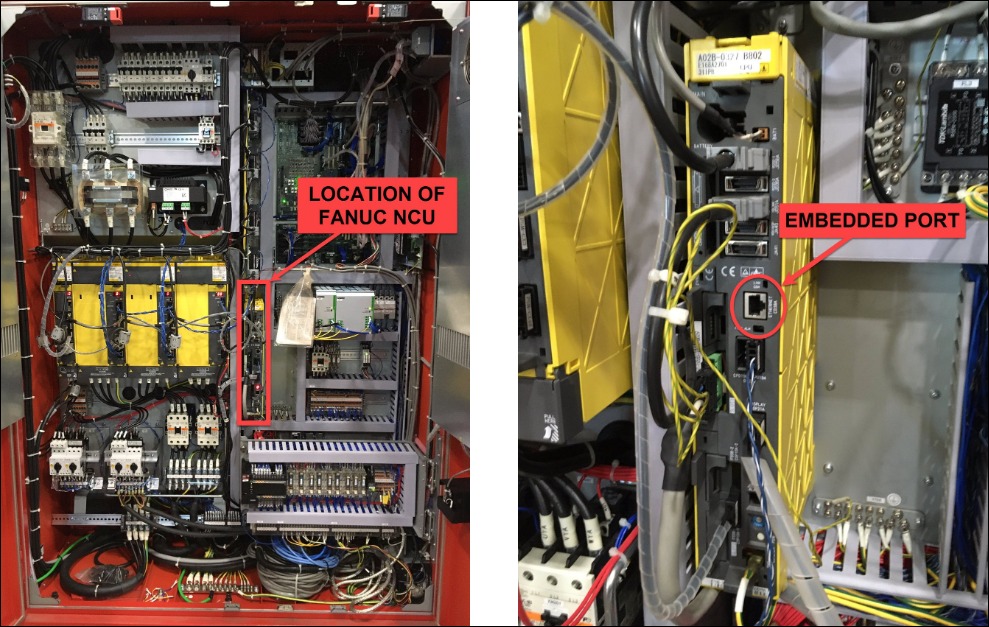
Location of the FANUC NCU and embedded Ethernet port inside the electrical cabinet — standalone control.

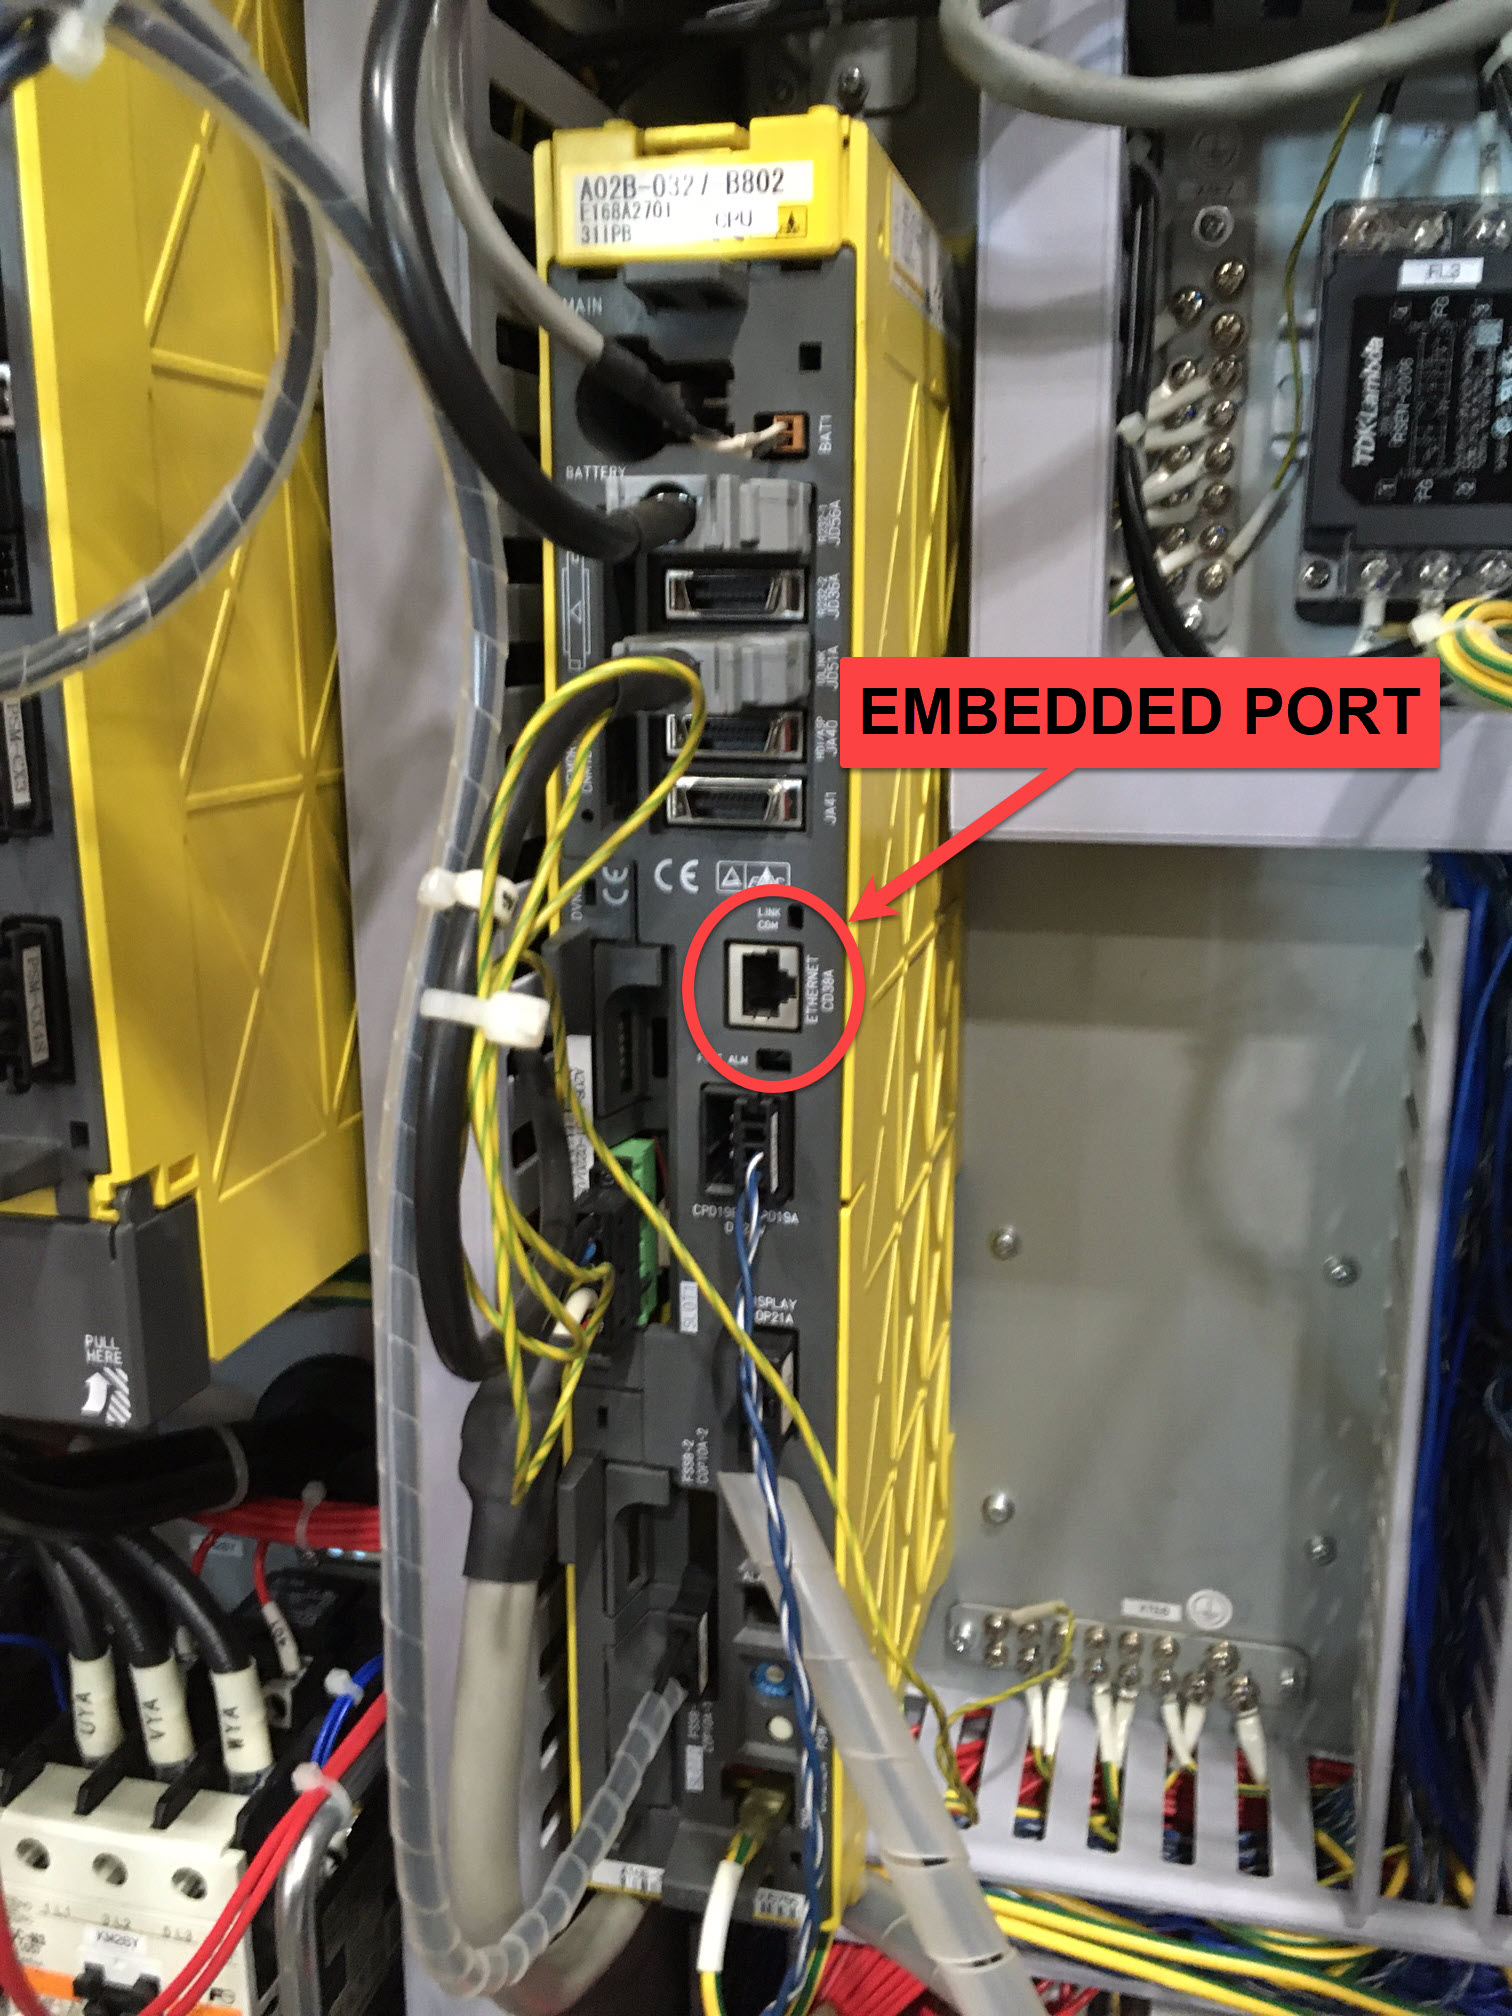
Close-up of the embedded Ethernet port on the FANUC NCU — standalone control.
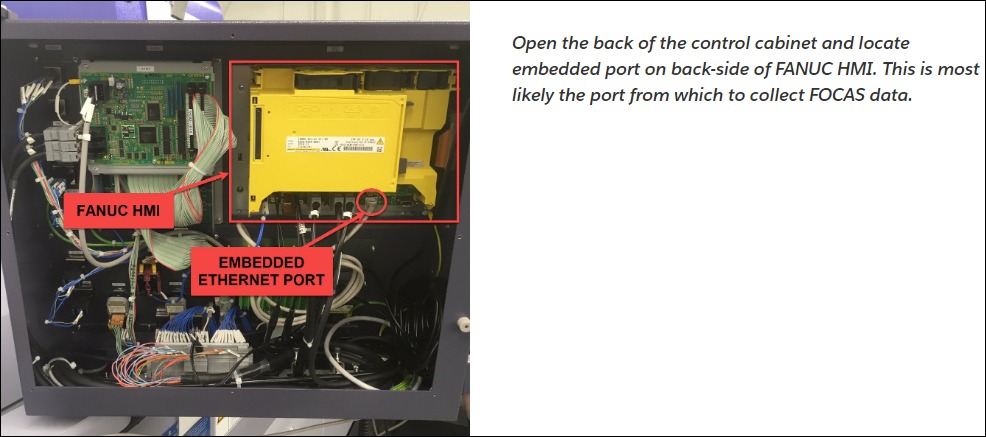
Open the control cabinet and locate the embedded port on the back side of the FANUC HMI. On most machines this is the preferred FOCAS connection point.

Left: FANUC NCU (yellow module) location in the electrical cabinet. Right: Close-up of the embedded Ethernet port — the RJ45 connector used for FOCAS communication.
Port Identification:
- Standard RJ45 Ethernet port
- Usually has a green/yellow status LED (LINK/ACT indicators)
- May be recessed or behind a protective cover
Wired Network Connection
For hardwired installations (Edge in server room, Ethernet drops to machines):
- Run Ethernet cable from network switch to machine
- Plug cable into the FANUC embedded port (CD38A)
- Verify LED lights indicate link
- Configure machine IP address (see Network Configuration section)
- Ensure IP is in same subnet as Edge device
Network Requirements:
- Machine and Edge must be on same subnet or have proper routing
- Typical configuration: Edge device connects to network switch, machines connect to same switch
- Bandwidth: Minimal (< 1 Mbps per machine)
Wireless Network Connection
For wireless installations (Edge device in each machine electrical cabinet):
- Mount Edge device in machine's electrical cabinet or HMI enclosure
- Connect WiFi antennas to Edge device
- Mount antennas outside electrical enclosure for best signal
- Connect Ethernet cable from Edge device (outer NIC port) to FANUC embedded port
- Configure machine IP to match Edge device subnet
Key Points:
- Edge device's external Ethernet port connects to FANUC port
- WiFi antennas must be outside metal enclosure
- Machine and Edge communicate over Ethernet, Edge communicates to cloud over WiFi
Sharing the Embedded Port
If the FANUC embedded port is already in use (for DNC, program transfer, or other equipment), you can share the port using an unmanaged Ethernet switch:
Setup:
- Install small unmanaged switch (e.g., Brainbox, Netgear)
- Connect FANUC embedded port to switch
- Connect MachineMetrics Edge/cable to switch
- Connect existing equipment to switch
Important: Use an unmanaged switch only. Managed switches can interfere with communication.
Machine with Internal Network
If the machine already has its own internal network (communicating with peripheral devices, robots, PC front end, or PLC), then you need to use an Edge device to join the machine LAN to the company network.
Setup:
- Connect Edge device to the machine's internal network switch
- The Edge device bridges the machine's LAN to your company network
- Machine, peripherals, and robots remain on their isolated network
- Edge provides secure connection to MachineMetrics cloud
Why this is needed:
- Preserves the machine's isolated network for control devices
- Prevents network conflicts between machine devices and company network
- Edge acts as a secure gateway without disrupting machine operations
Network Configuration on the Control
The video below uses a Mori Seiki machine with a FANUC MSX control. Softkey locations and menu names may differ by control model and serial number — use this as a general reference.
Accessing Network Settings
Standard Access Path:
- Press SYSTEM hard key
- Press right scroll soft key until you see EMBDD or EMBED PORT
- Select EMBDD or EMBED PORT
- You'll see network configuration fields
Alternative Path (some controls):
- Press SYSTEM hard key
- Navigate to ETHPRM or ETHER-BOARD
- Select to enter settings
For Windows-Based Controls:
- Access Windows backend
- Search for "CNC Screen Display" program
- Access embedded port settings through this interface
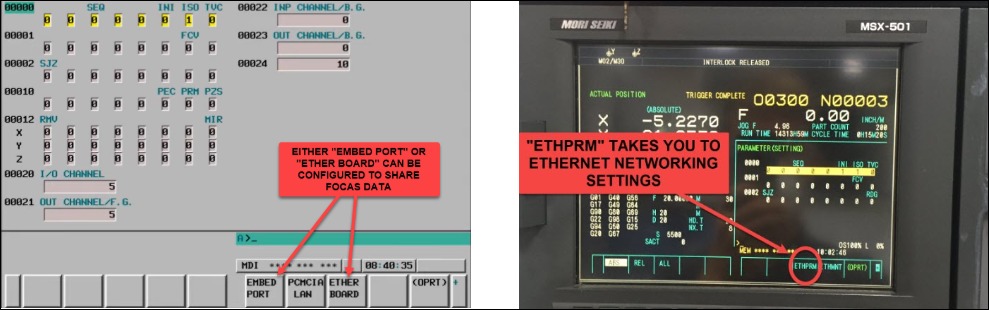
On the control, you'll see softkeys along the bottom for selecting the port type: EMBED PORT, PCMCIA LAN, and ETHER BOARD. On machines like the MSX-501, the key labeled ETHPRM navigates directly to the Ethernet networking settings.
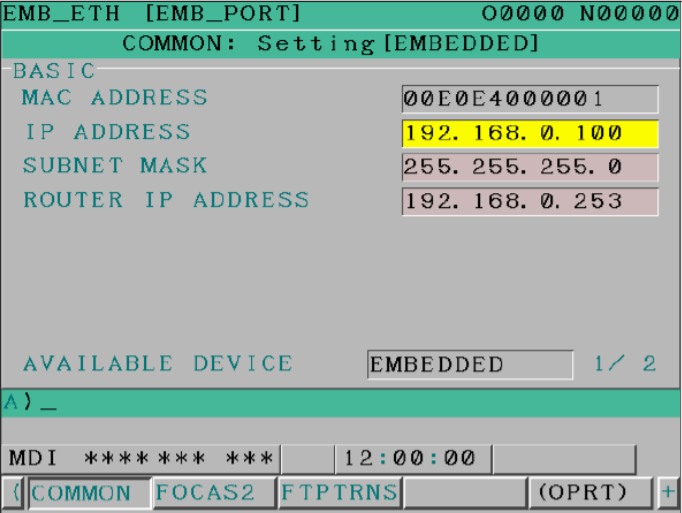
Setting IP Address
Step 1: Enter Network Parameters
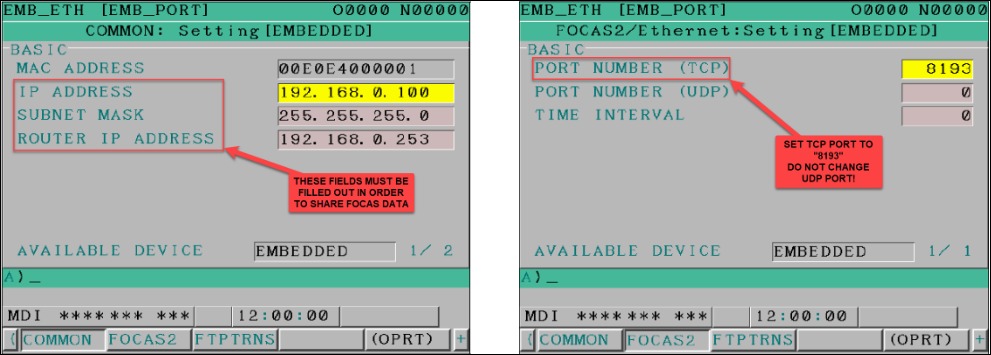
In the EMBDD or EMBED PORT screen, you'll see fields for:
- IP Address: Machine's IP address
- Subnet Mask: Network subnet (typically 255.255.255.0)
- Gateway: Network gateway (may be optional)
Enter all values — these fields must be filled in for FOCAS data collection to work.
Step 2: Configure IP Settings
For wired connection:
- IP must be in same subnet as Edge device and network
- Example: Machine 192.168.1.100, Edge 192.168.1.50, Subnet 255.255.255.0
For wireless connection:
- IP must match Edge device's external NIC subnet
- Example: Machine 192.168.100.10, Edge NIC 192.168.100.1, Subnet 255.255.255.0
Step 3: Verify Port Selection
- Check COMMON SETTING field
- Should show EMBEDDED (most common) or BOARD
- This indicates which physical port is used for FOCAS
Step 4: Verify Available Device
- Press OPRT soft key
- Ensure "AVAILABLE DEVICE" is set to EMBEDDED PORT (not PCMCIA)
- If set to PCMCIA, press PCMCIA/EMBDD soft key to switch
- Press EXECUTE
Enabling FOCAS Protocol
Step 1: Access FOCAS Settings
- In EMBDD menu, look for FOCAS2 soft key
- If not visible, press PAGE DOWN key
- Select FOCAS2 or FOCAS SETTINGS
Step 2: Configure FOCAS Port
- Set FOCAS TCP port to 8193 (standard)
- Leave UDP blank or at 0
- Set Timeout to 0
- Some controls may show this as "FOCAS PORT" or "TCP PORT"
The COMMON tab determines which physical Ethernet port FOCAS uses:
- EMBEDDED → connect to the RJ45 port on the back of the HMI (behind the display)
- BOARD → connect to the Ethernet port directly on the FANUC NCU board in the electrical cabinet
![FANUC FOCAS2 Ethernet setting — left shows "AVAILABLE DEVICE: EMBEDDED" with note "IF COMMON SETTING IS SET TO EMBEDDED, CONNECT ETHERNET PORT BEHIND HMI"; right shows "COMMON: Setting[BOARD]" with IP 192.168.82.15 and note "IF COMMON SETTING IS SET TO BOARD, CONNECT ETHERNET PORT ON FANUC NCU"](/assets/images/focas-embedded-vs-board-port-options-7b139bb1c763125a142e3a027fea4ef2.png)
Step 3: Restart or Reboot
- Look for RESTART soft key
- Select and press EXECUTE
- If not available, power cycle the machine
- This applies the network settings
Verifying Configuration
After restart, verify:
-
Check IP Settings
- Return to EMBDD menu
- Confirm IP address, subnet, gateway are correct
-
Test Network Connectivity
- From Edge device or computer on same network
- Ping the machine's IP address
- Should receive replies
-
Check FOCAS Port
- Verify port 8193 TCP is configured
- Ensure it wasn't changed to another value
If machine doesn't respond to ping:
- Verify physical cable connection
- Check that "AVAILABLE DEVICE" is set to EMBEDDED (not PCMCIA)
- Press OPRT soft key → PCMCIA/EMBDD → EXECUTE
- Reboot machine again
Adding the Machine in MachineMetrics
Once the physical connection and network configuration are complete:
Step 1: Log into MachineMetrics
- Navigate to Assets → Machines
- Click Add Machine
Step 2: Enter Machine Details
- Machine Name: Descriptive name (e.g., "Mill-3-Fanuc")
- Make: Manufacturer (e.g., "Makino")
- Model: Machine model
- Select Edge Device: Choose your Edge from dropdown
Step 3: Configure Adapter
- Adapter Type: Select FANUC FOCAS
- IP Address: Enter the machine's IP address (from control)
- Port: 8193 (default FOCAS port)
- Click Test Connection
Step 4: Verify Connection
- Test should return "Connected" or similar success message
- If test fails, verify IP address and network connectivity
- Click Save when test succeeds
Step 5: Configure Data Collection
- Machine will appear in your Machines list
- Initial data items will be collected automatically
- Proceed to configure part counting and additional data items
Configuring Data Collection
Available Data Items
FANUC FOCAS provides access to a rich set of data:
Status & Mode:
- Machine status (running, idle, stopped, alarm)
- Controller mode (AUTO, MDI, EDIT, etc.)
- Operation mode
- Emergency stop status
Program Information:
- Program number
- Program name
- Active block/line
- Sequence number
Production Metrics:
- Part count (multiple methods)
- Cycle time
- Run time / idle time
- Parts per hour
Machine Parameters:
- Spindle speed (actual and commanded)
- Spindle load
- Feed rate (actual and commanded)
- Feed override percentage
- Rapid override percentage
Axis Information:
- Axis positions (absolute, relative, machine)
- Axis loads
- Axis velocities
Alarms & Warnings:
- Active alarms with codes and messages
- Alarm history
- Warning messages
Tool Data:
- Active tool number
- Tool life data
- Tool offsets
Diagnostics:
- Servo motor temperature
- Spindle temperature
- Pulsecoder temperature
- Many other diagnostic codes (300+)
Custom Data:
- Macro variables (common variables)
- PMC (ladder) variables
- P-codes (tool life management)
- Custom registers
💡 For adapter script examples using macros, PMC, and P-codes, see Adapter Script Configuration section below.
Setting Up Part Counting
Part counting configuration is one of the most important setup steps. See the Part Counting Methods section below for detailed instructions.
Configuring Macro Variables
Macro variables (common variables) can be used to access custom data stored by the machine program.
Step 1: Identify Macro Variable
- Determine which macro variable register contains your data
- Common example: Register 510 for custom part count
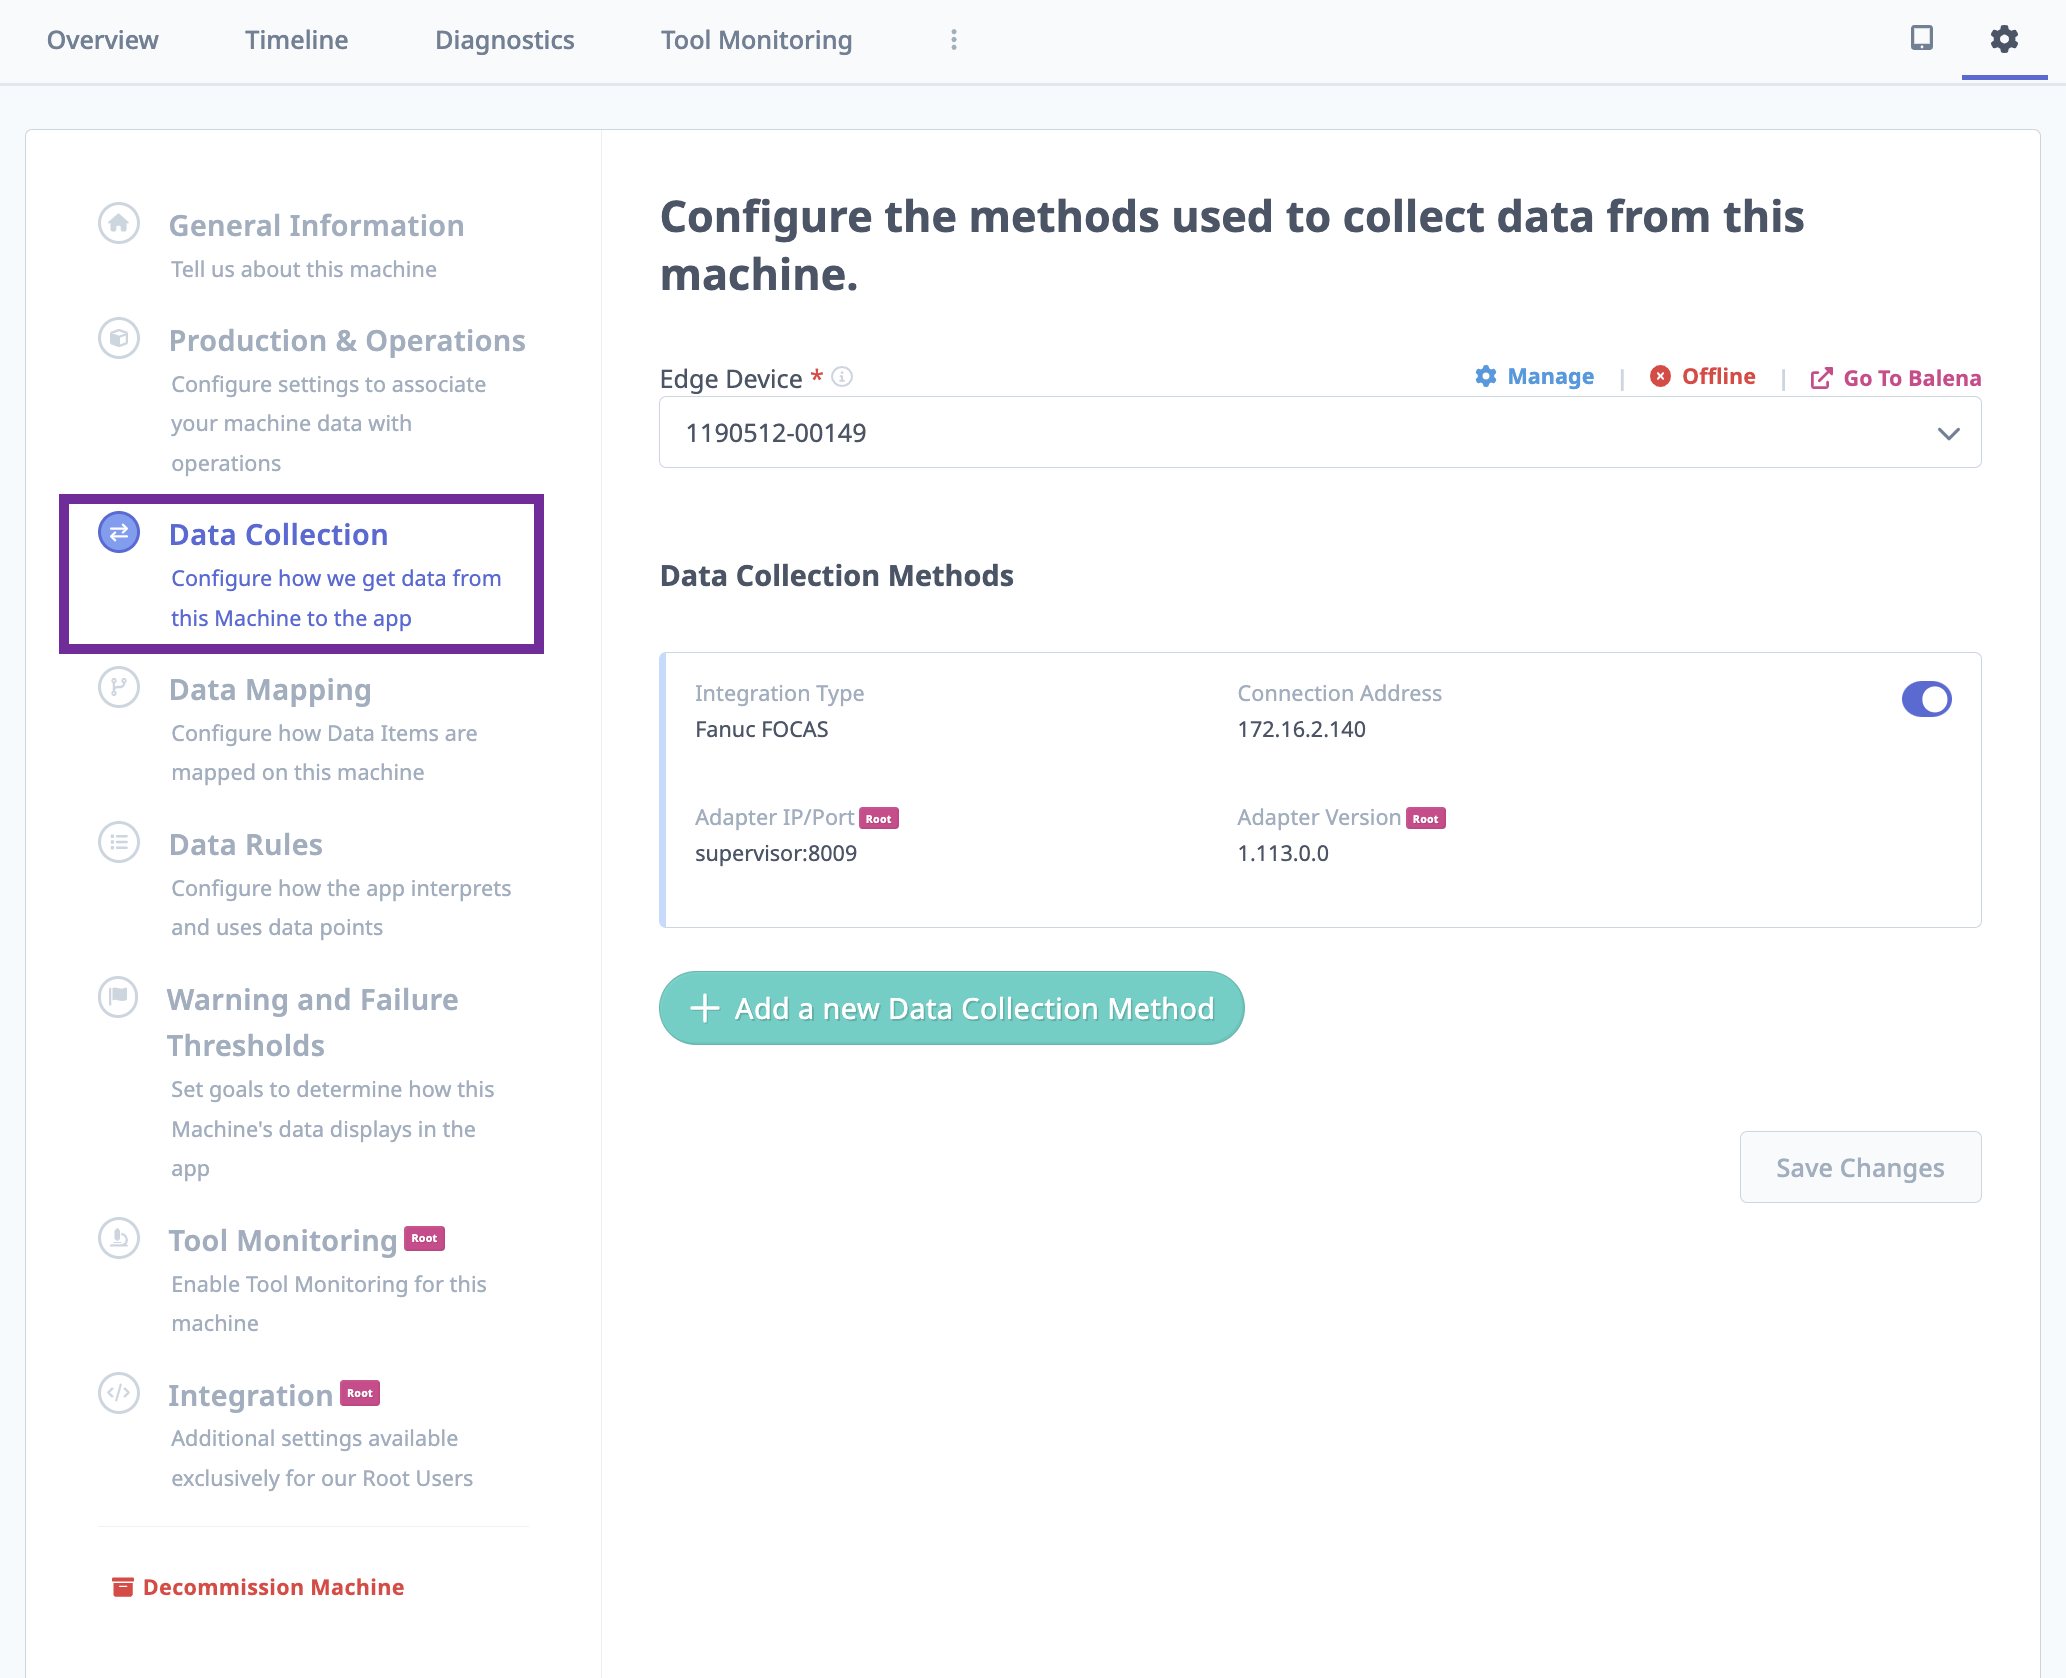
Step 2: Edit Machine Configuration
- Go to Assets → Machines
- Select your machine
- Click Data Collection
- Click Edit on the adapter configuration
Step 3: Add Macro Configuration
{
  "macros": {
    "variable_name": 510
  }
}
Replace variable_name with a descriptive name and 510 with your register number.
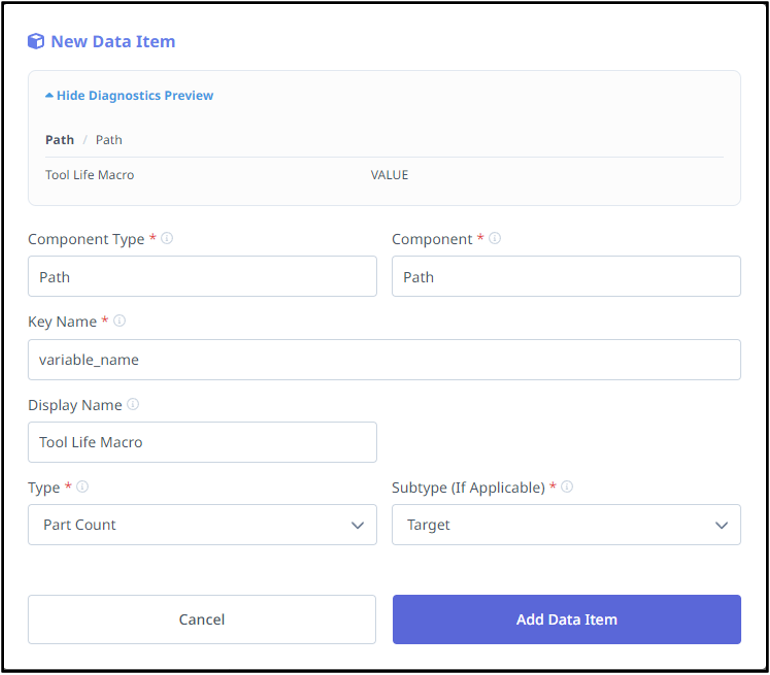
Step 4: Map the Data
- Go to Data Mapping tab
- Find the new macro variable data item
- Map to appropriate Type and Subtype
- Example: Type = "Part Count", Subtype = "Target"
Multi-Path Macro Configuration:
{
  "macros": {
    "path1_macro": 101,
    "all_paths_macro": { "addr": 500, "path": [-1] },
    "specific_paths_macro": { "addr": 501, "path": [1,3] }
  }
}
- Path -1 = All paths
- Path [1,3] = Specific paths only
💡 For additional adapter script examples including PMC, P-codes, and tool wear tracking, see Adapter Script Configuration section.
Configuring Diagnostics
FOCAS provides access to hundreds of diagnostic codes for monitoring machine health.
Default Diagnostics (enabled automatically):
- 308: Servo Motor Temperature
- 309: Pulsecoder Temperature
- 403: Spindle Temperature
To add additional diagnostics:
Use descriptive names as keys with diagnostic code numbers as values:
{
  "diagnostics": {
    "servo_motor_temp": 308,
    "pulse_temp": 309,
    "sp_temp": 403
  }
}
- Use descriptive names for keys (e.g.,
servo_motor_temp,coolant_level) - Set the diagnostic code number as the value
- The default diagnostics (308, 309, 403) are included automatically, but you can configure them explicitly to customize names or add additional codes
Data Mapping:
- Refresh data items list
- Filter for "Diag" prefix or your custom names
- Map each diagnostic to appropriate Component and Type
- Add descriptive display names
- Example: servo_motor_temp → Component "Linear/Z", Type "Sample/Temperature", Name "Z-Axis Servo Temp"
See Adapter Script Configuration section for more details.
Part Counting Methods
Accurate part counting is critical for production tracking. FANUC machines support several methods.
Once part counting is configured, use the Connectivity Validation Guide to confirm it is working correctly — including how to identify bad counts on the Timeline before they affect production reporting.
Standard Cycle (M30/M02)
For manually loaded parts with programs ending in M30 or M02:
The machine should count automatically when the program reaches M30 or M02. However, some machine tool builders use custom M-codes.
Step 1: Check Current Configuration
- Press SYSTEM hard key → Parameters
- Navigate to parameter 6700
- Look at bit 0 (PCM - Part Count Method):
- 6700#0 = 0: Count on M02, M30, OR M-code in parameter 6710
- 6700#0 = 1: Count ONLY on M-code in parameter 6710
- Check parameter 6710: Shows which M-code is used to count
Step 2: Choose Configuration
Recommended: Set 6700#0 = 0 (allows M02, M30, or custom M-code)
Step 3: Verify in MachineMetrics
- Configure part count data mapping
- Run test cycle on machine
- Wait 10-30 seconds for data sync
- Check the Timeline and/or Diagnostics view to watch for value changes
- Verify count increments in MachineMetrics
Looping Cycle (M99)
For programs that loop (robot loading, pallet changers, automation):
Programs ending in M99 don't typically reach M30, so they won't count automatically.
Solution 1: Use Machine Tool Builder M-Code
- Add the MTB's custom part count M-code before M99
- Example: If 6710 = 56, add
M56beforeM99
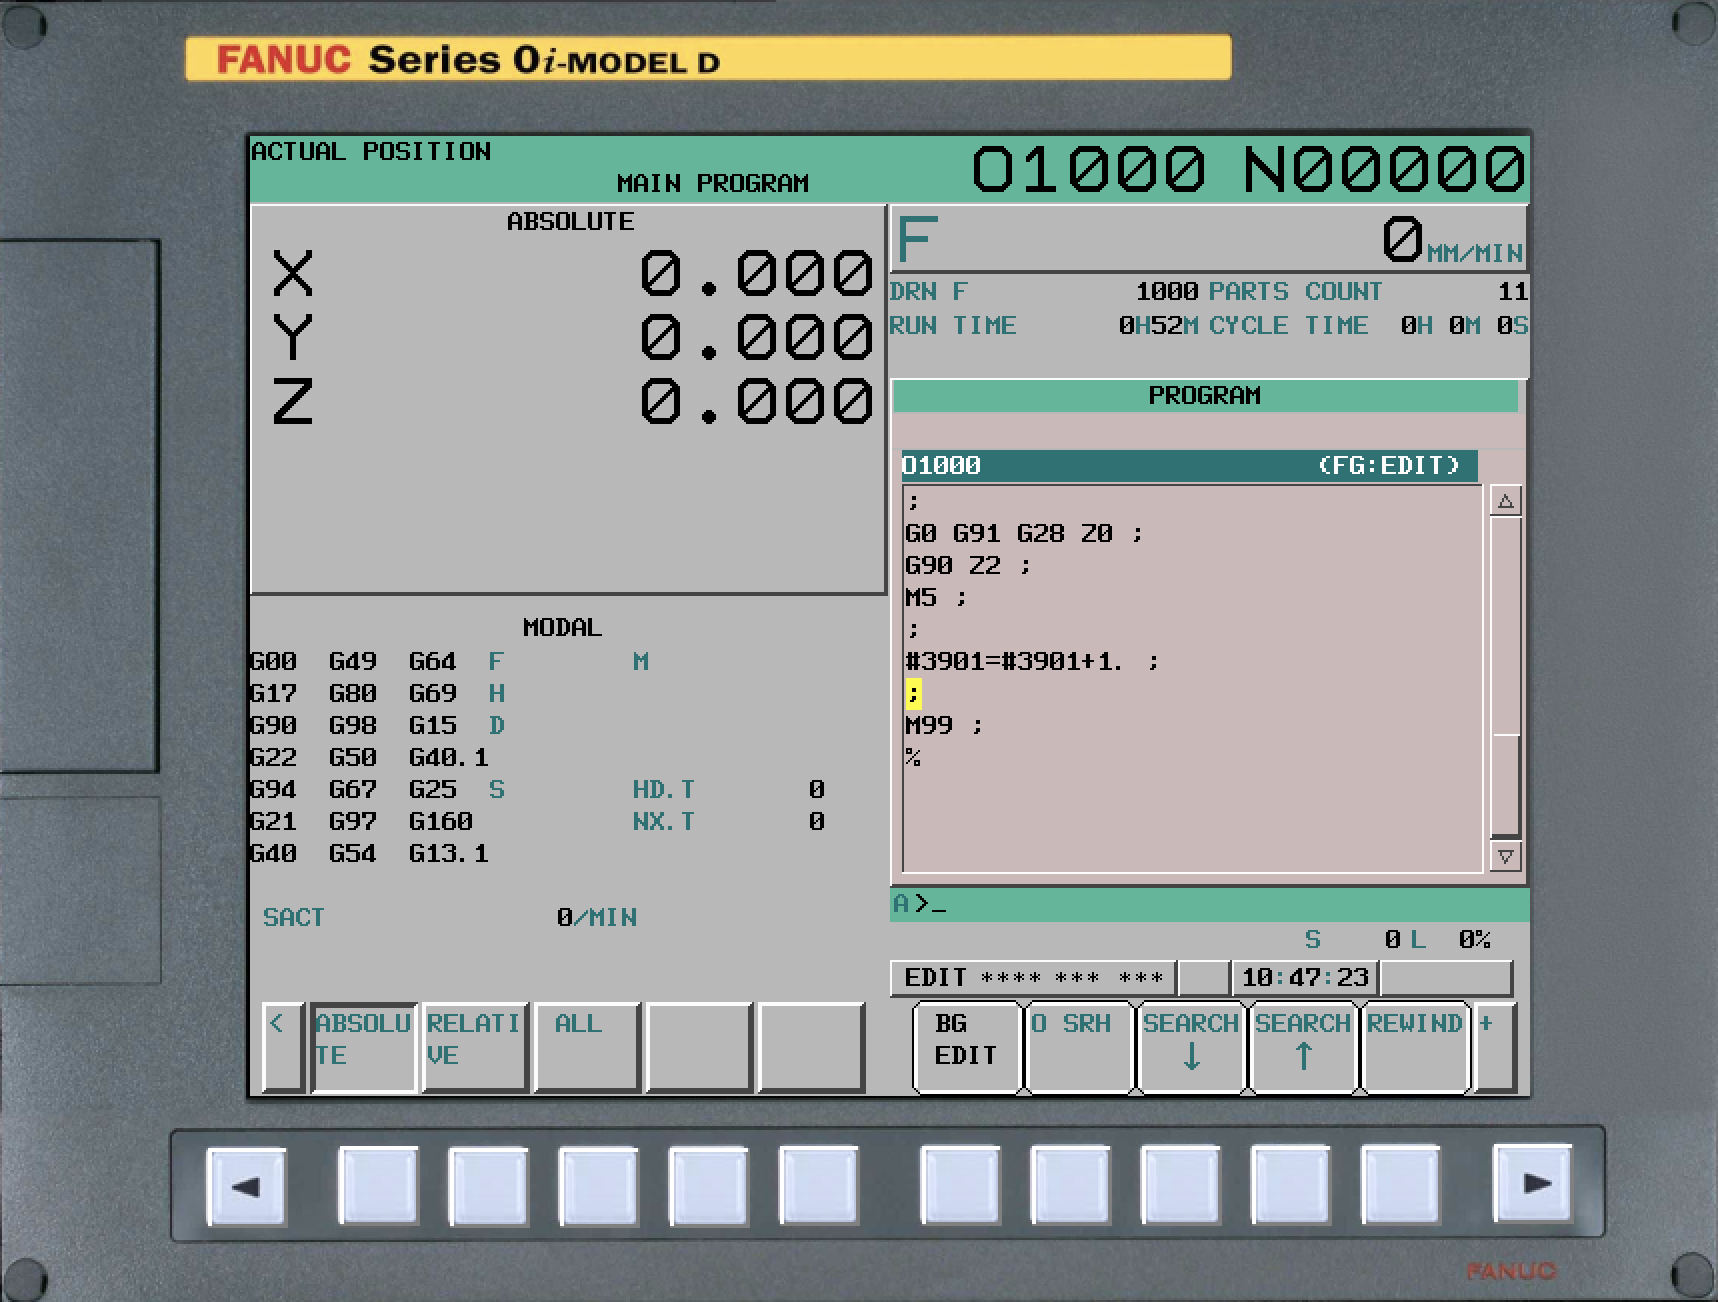
Solution 2: Use Macro Variable #3901
- Add
#3901=#3901+1before M99 - This increments the system part counter
- Requires Macro B option enabled
Where to Add:
... (program code)
M92          (MTB M-code method)
or
#3901=#3901+1   (Macro method)
M99          (loop back)
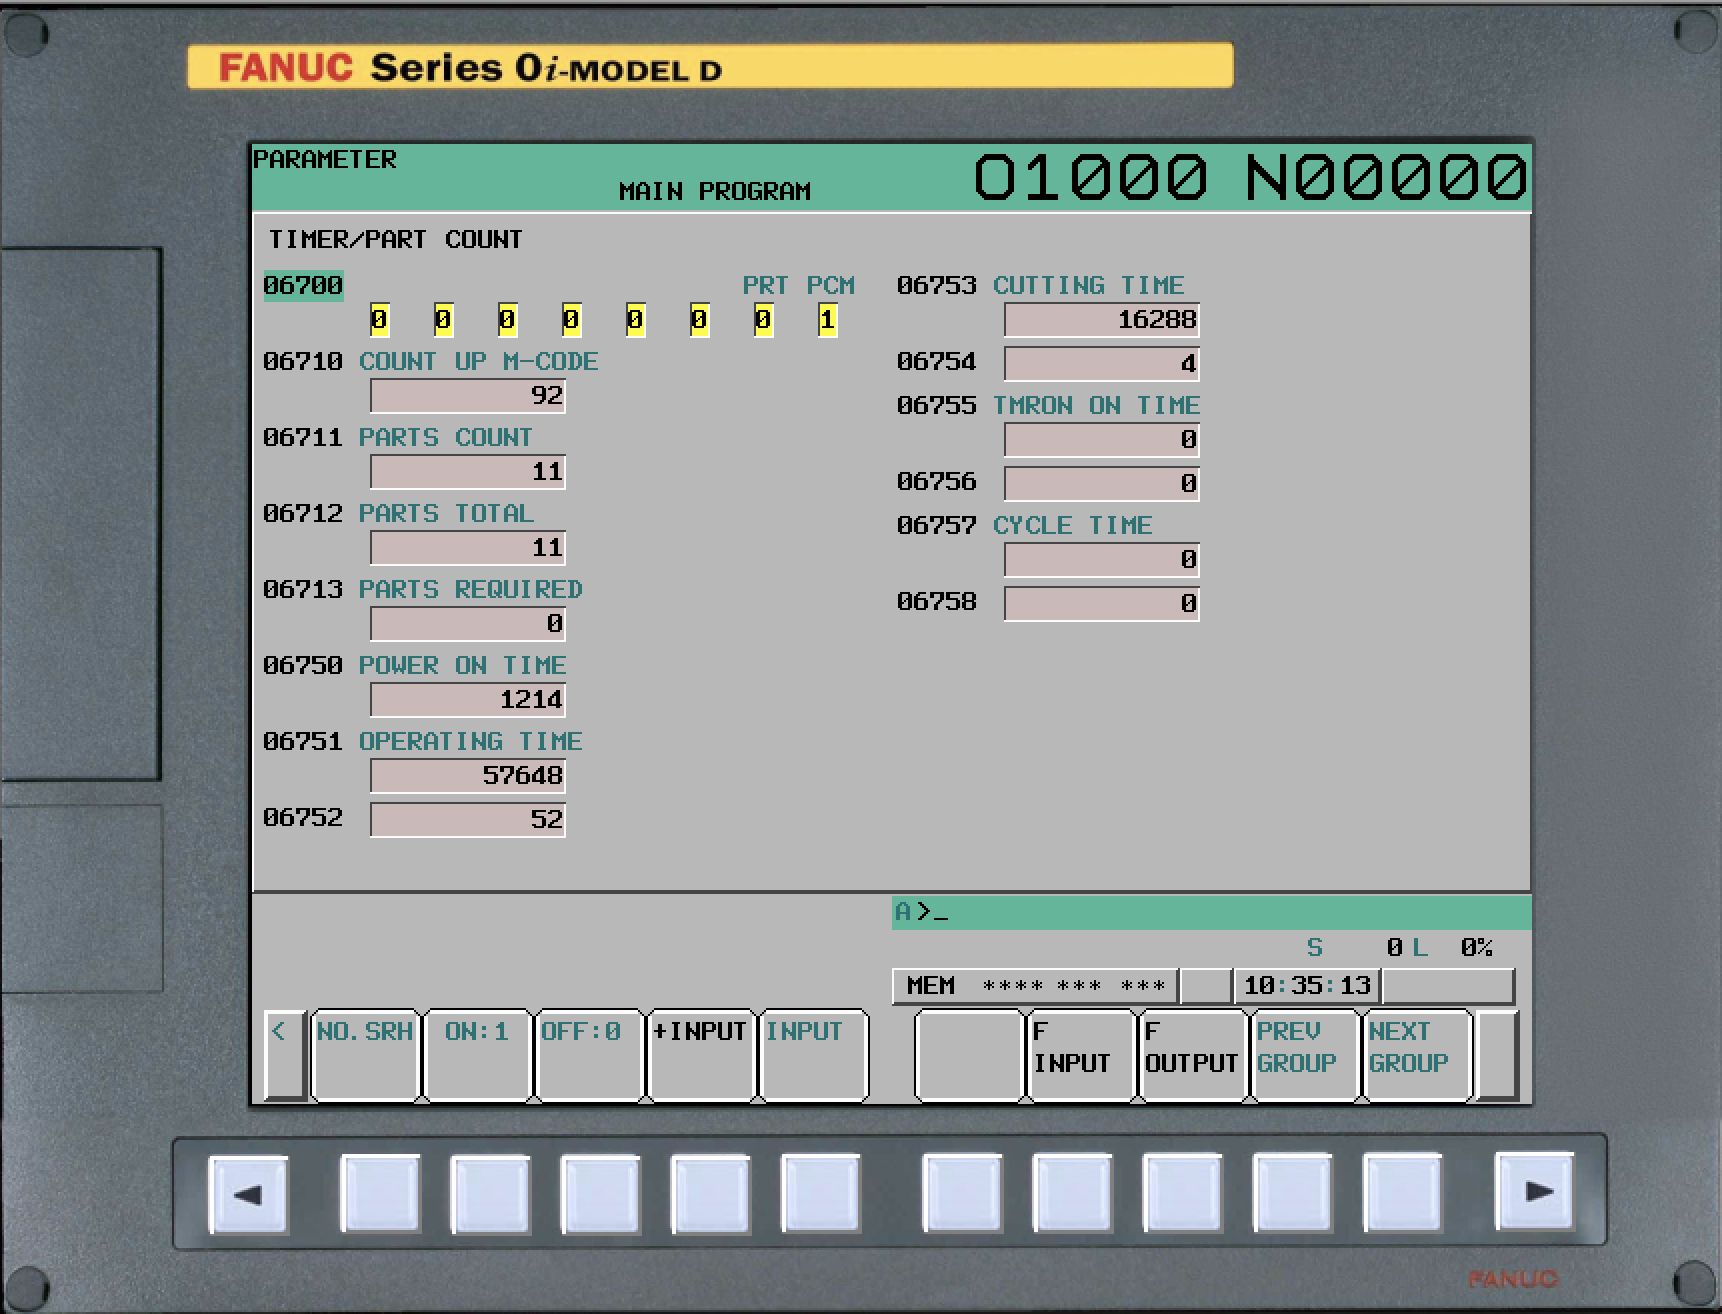
Here's an example program using the macro increment method on a FANUC Series 0i-MODEL D:
You can verify the increment is working by checking PARAMETER → TIMER/PART COUNT on the control:
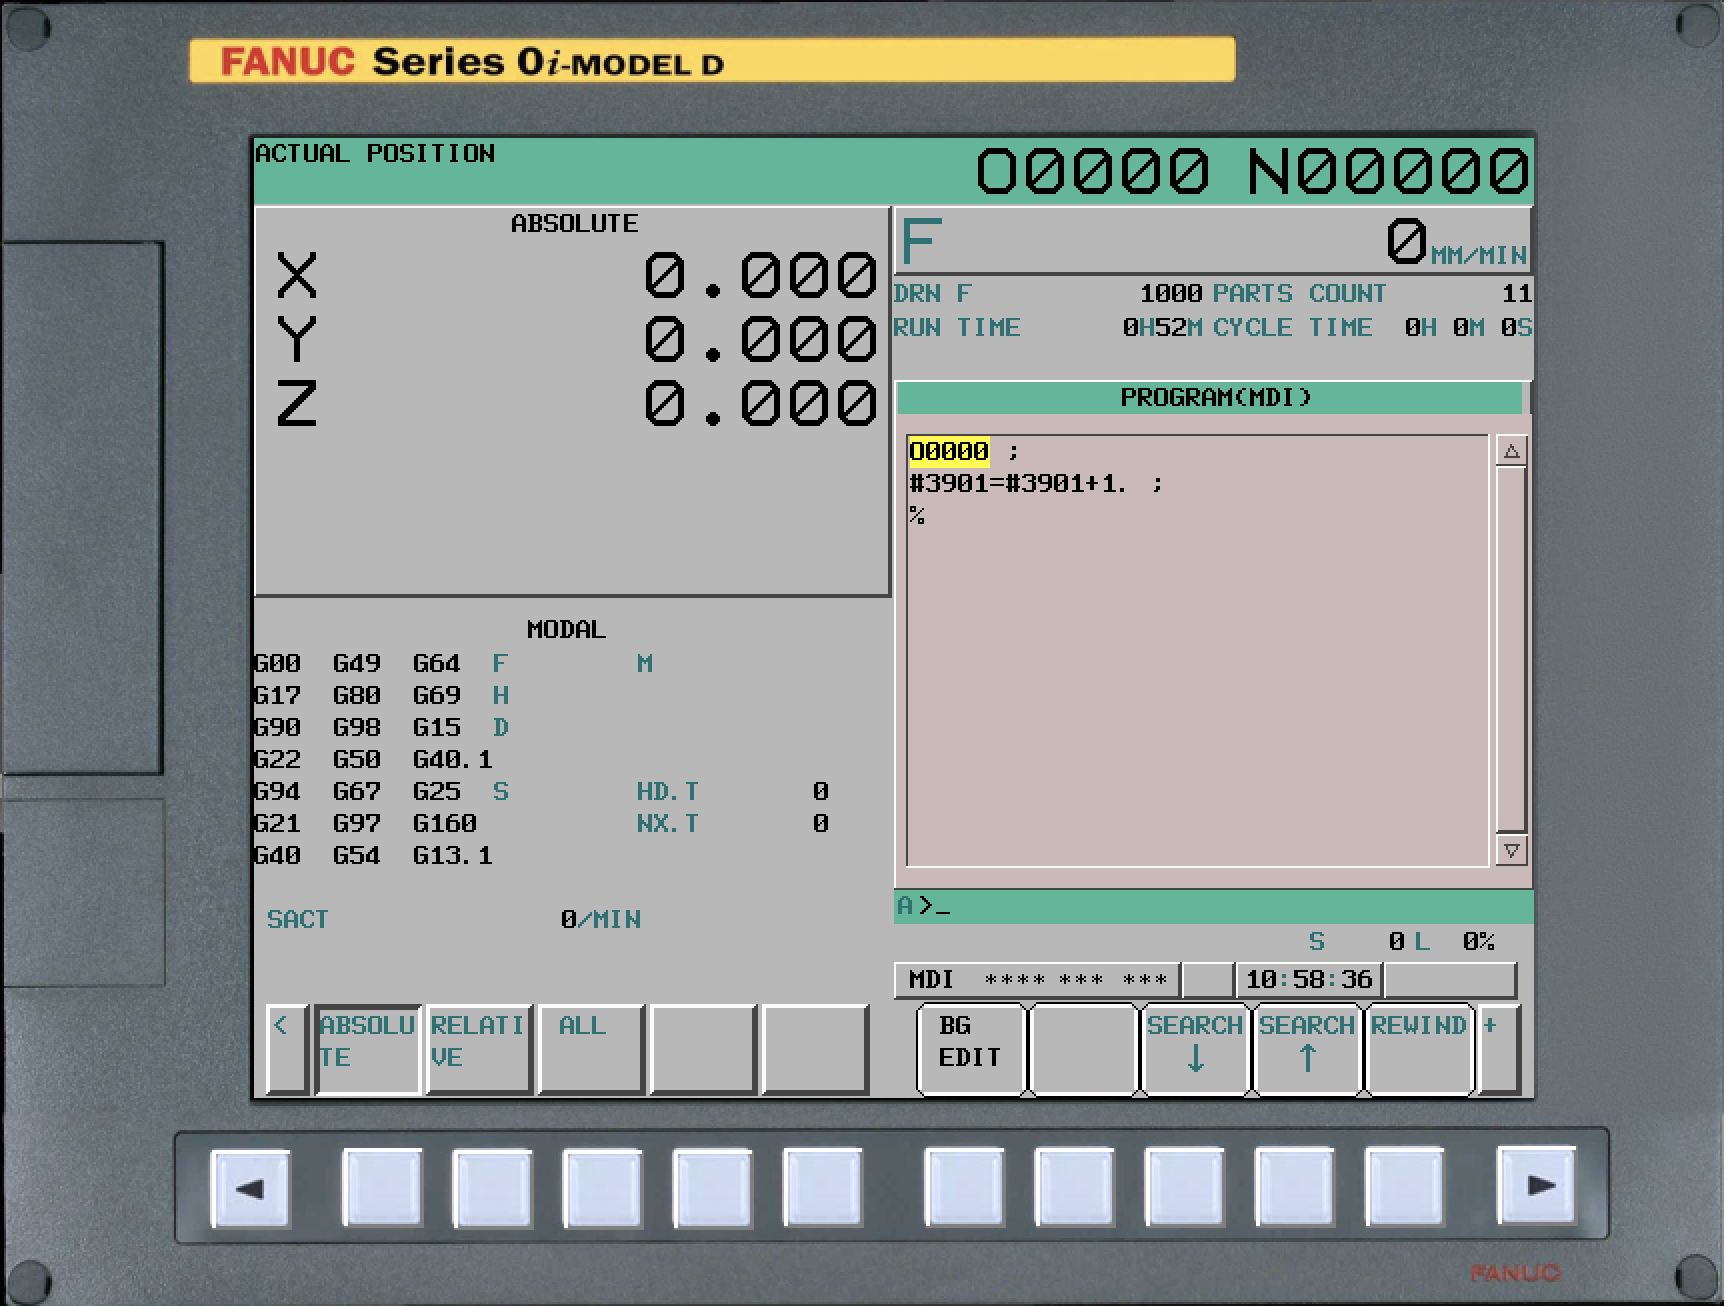
To test without running a full program cycle, use MDI mode and enter the macro increment directly:
Custom M-Code Configuration
To change which M-code counts parts:
⚠️ Warning: Only proceed if you have permission and parameter write access enabled.
Step 1: Enable Parameter Write
- See Enabling Parameter Write section
Step 2: Modify Parameters
- Press SYSTEM → Parameters
- Navigate to 6700
- Change bit 0 (PCM):
- Set to 0 for M02/M30/Custom
- Set to 1 for Custom only
- Navigate to 6710
- Enter desired M-code number (e.g., 92 for M92)
- Important: Choose an M-code NOT used by machine functions
- Avoid M98 (subprogram call) and M99 (loop)
Step 3: Reboot Machine
- Power cycle for parameter changes to take effect
Step 4: Test
- Put machine in MDI mode
- Set feed/rapid overrides to zero
- Enter part count command (M30, custom M-code, or #3901=#3901+1)
- Press cycle start
- Check that count in parameter 6711 increments
Before Changing: Always check with your machine manufacturer or FANUC to ensure the M-code isn't already in use by another function.
Testing Part Count
Quick Test Procedure:
-
Set Machine to MDI Mode
- Select MDI on mode selector
-
Safety First
- Set feed override to 0%
- Set rapid override to 0%
- This prevents any motion
-
Clear MDI Buffer
- Clear any existing MDI commands
-
Enter Count Command
- Type your count command:
M30(standard)M92(or your custom M-code)#3901=#3901+1(macro method)
- Type your count command:
-
Execute
- Press CYCLE START
-
Verify Count
- Check system part counter (usually displayed on main screen)
- Or check parameter 6711 (stores part count value)
- Count should increment by 1
-
Verify in MachineMetrics
- Wait 10-30 seconds for data sync
- Check the Timeline and/or Diagnostics view to watch for value changes
- Check machine view in MachineMetrics
- Part count should have incremented
Adapter Script Configuration
Macro Variables
Macro variables provide access to custom data stored in the control.
Common Use Cases:
- Custom part counters
- Process parameters
- Quality measurements
- Tool life tracking
- Automation status
Basic Configuration Example:
{
  "macros": {
    "custom_part_count": 510,
    "tool_life_remaining": 520,
    "temperature_setpoint": 530
  }
}
With Path Specification:
For multi-path machines or specific path targeting:
{
  "macros": {
    "X1_Wear_1": 2001,
    "X1_Wear_2": {
      "addr": 2002,
      "path": [1]
    },
    "X1_Wear_3": {
      "addr": 2003,
      "path": [1]
    }
  }
}
Data Mapping: Map each macro to appropriate type:
- Part counts → Part Count / Target or Actual
- Measurements → Sample / (appropriate subtype)
- Status → Event or Condition
PMC (Programmable Machine Control)
PMC allows direct access to PLC inputs and outputs within the FANUC control.
What is PMC?
- PMC is FANUC's built-in PLC functionality
- X-addresses = Inputs (from machine sensors, switches, relays)
- Y-addresses = Outputs (to machine actuators, lights, relays)
- Used for machine logic, interlocks, and automation
Common Use Cases:
- Door interlocks
- Collet open/close status
- Chuck clamp/unclamp status
- Bar feeder status
- Coolant status
- Stack lights
- Key switches
- Air cut status
- One-cycle mode
Configuration Example:
⚠️ IMPORTANT: The addresses below are examples only. PMC addresses vary by machine model and machine tool builder. You must find the correct addresses for your specific machine in the machine manual or PMC ladder diagram.
{
  "pmc": {
    "X5_0_MAIN_COLLET_OPEN": "X5.0",
    "X5_1_MAIN_SP_CLAMP": "X5.1",
    "X5_2_MAIN_SP_UNCLAMP": "X5.2",
    "X5_3_CUT_OFF_TOOL_OFF": "X5.3",
    "X5_4_CUT_OFF_TOOL_ON": "X5.4",
    "X9_1_DOOR_INTLOCK_MAIN": "X9.1",
    "X7_0_BAR_STOCK_EMPTY": "X7.0",
    "X7_3_BAR_FEED_READY": "X7.3",
    "X47_6_KEY_SWITCH": "X47.6",
    "Y53_5_ONE_CYCLE": "Y53.5",
    "Y53_1_AUTO_CUT_OFF": "Y53.1",
    "Y53_2_AIR_CUT": "Y53.2",
    "Y52_3_MACRO_BUTTON": "Y52.3"
  }
}
Finding PMC Addresses:
-
Access PMC Diagnosis
- Press SYSTEM → PMC → DIAGNOS
- Shows real-time X (inputs) and Y (outputs)
-
Identify Address
- Watch PMC screen while activating machine function
- Example: Open door → watch for bit that changes
- Note the address (e.g., X9.1 for door interlock)
-
Name Descriptively
- Use clear, descriptive names
- Include location if multi-spindle (e.g., MAIN, SUB)
- Document what triggers the signal
Data Mapping:
- Binary signals (0 or 1)
- Map to Event type in MachineMetrics
- Use for automation triggers, alerts, or dashboards
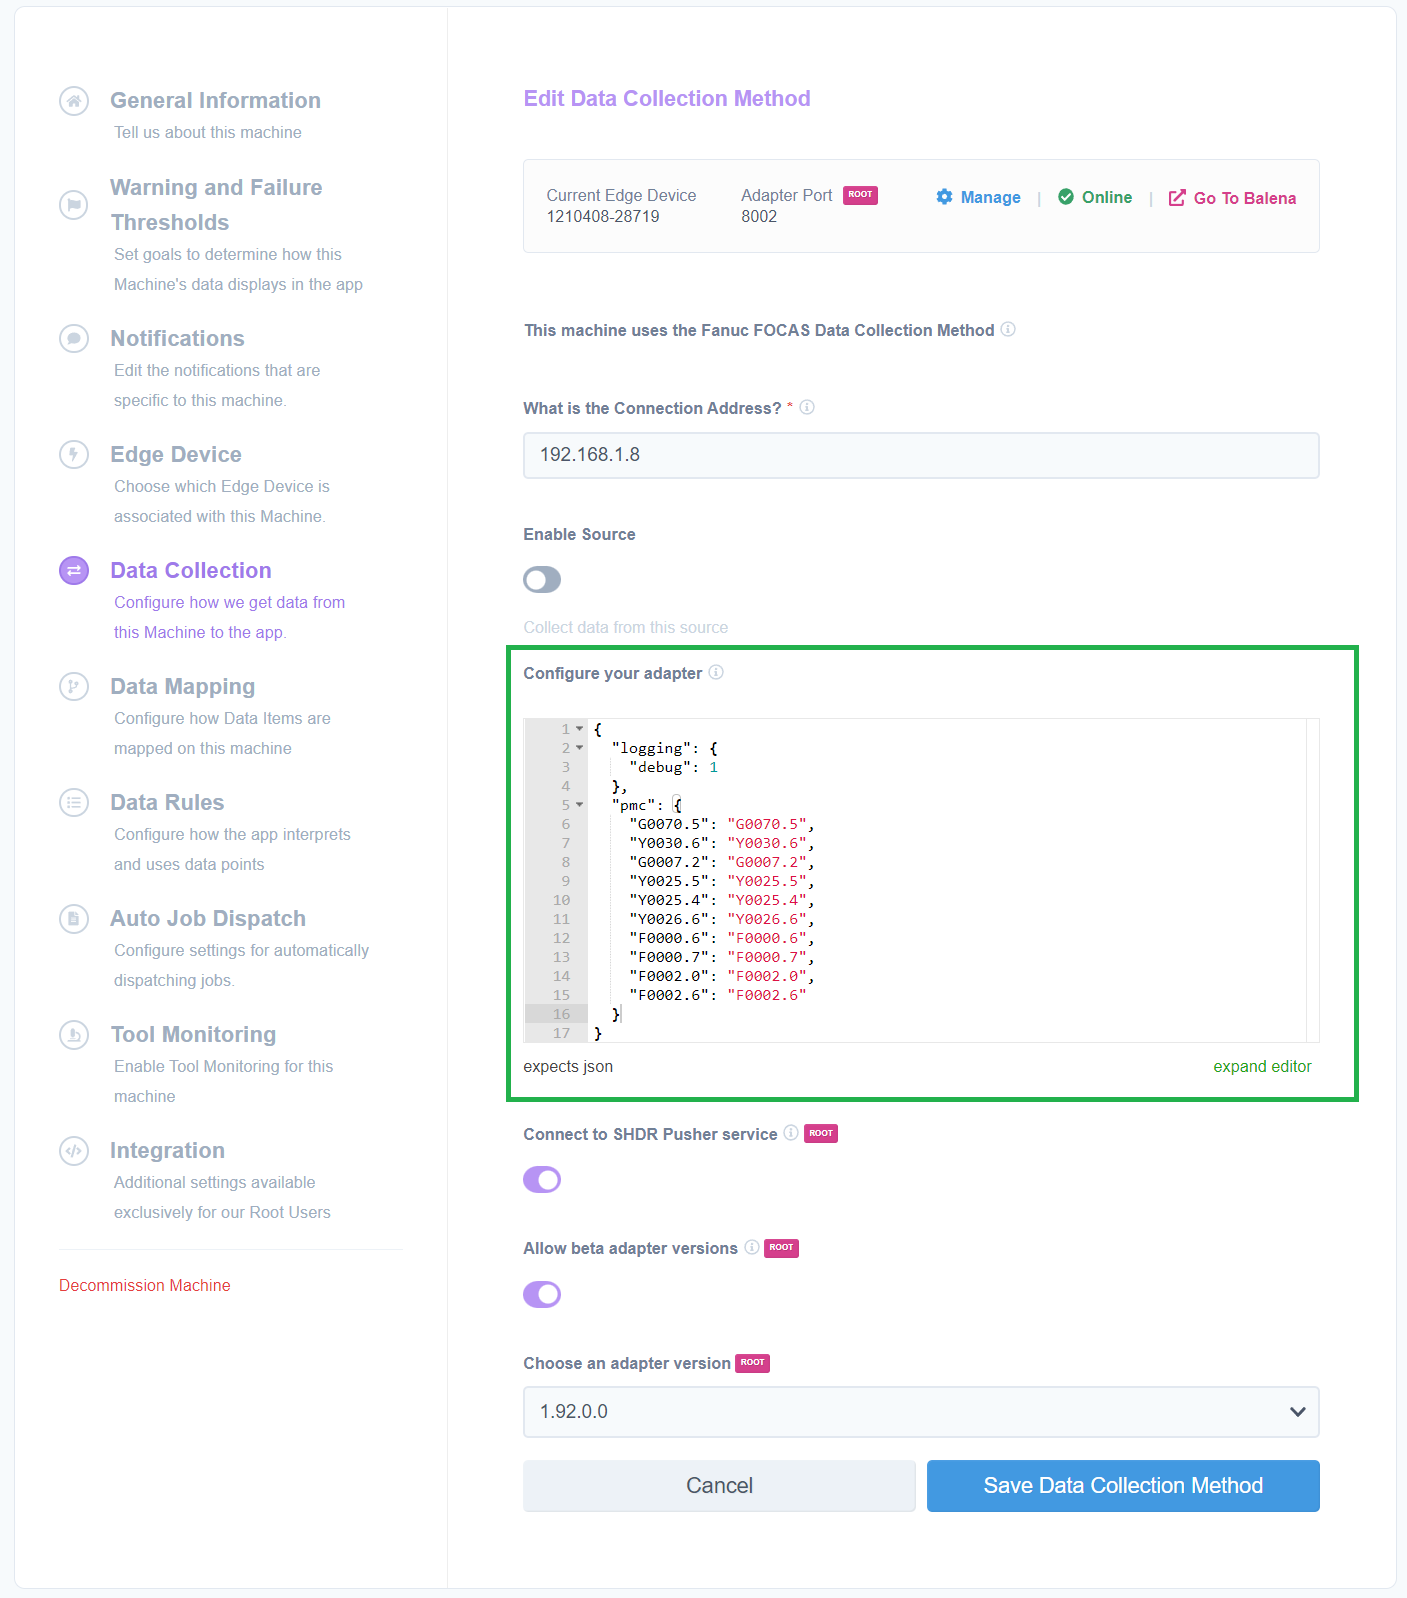
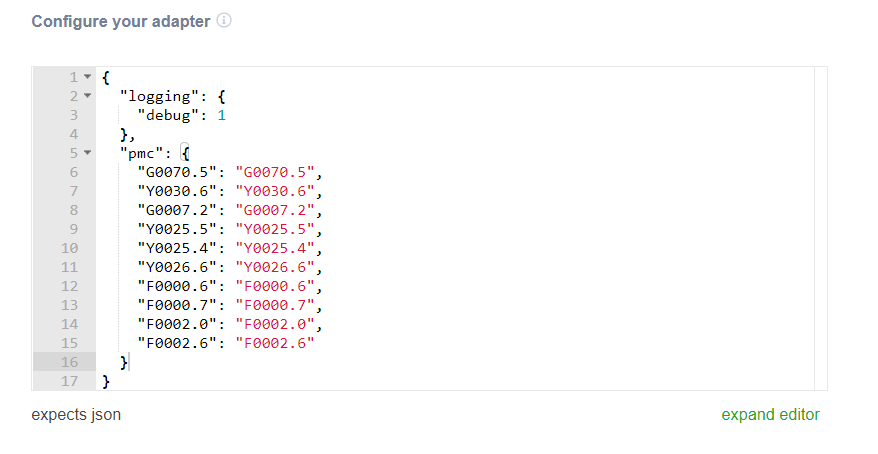
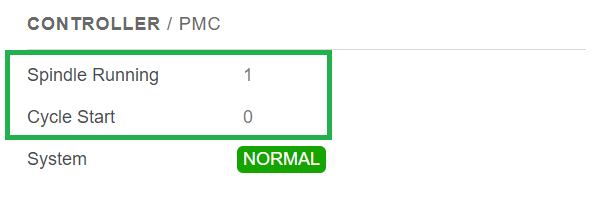
Here's an example of a fully configured PMC adapter in MachineMetrics, with the JSON showing G/Y/F addresses:
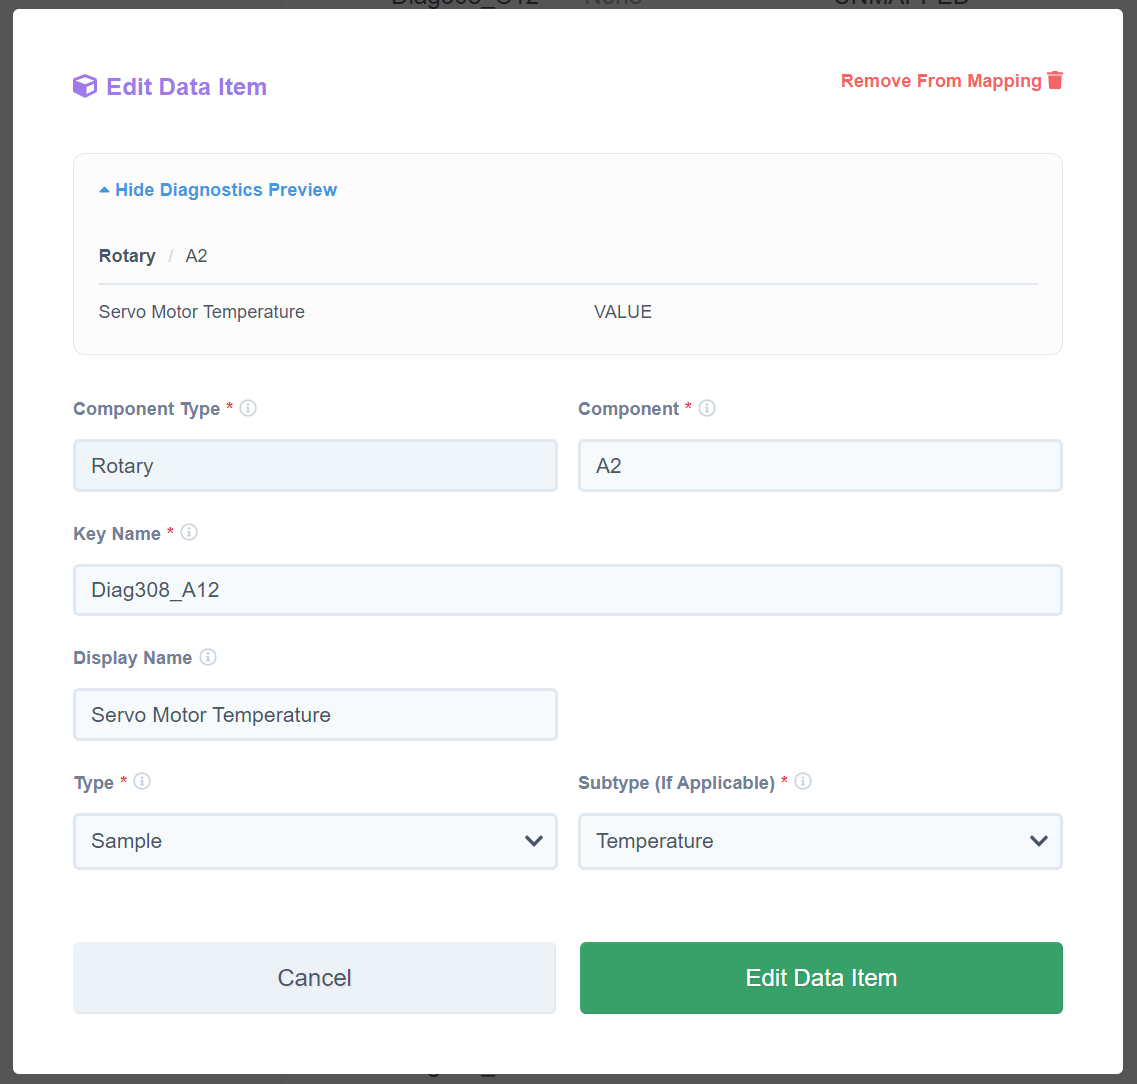
After saving, go to Data Mapping to configure each PMC signal. Click any data item to open the Edit dialog:
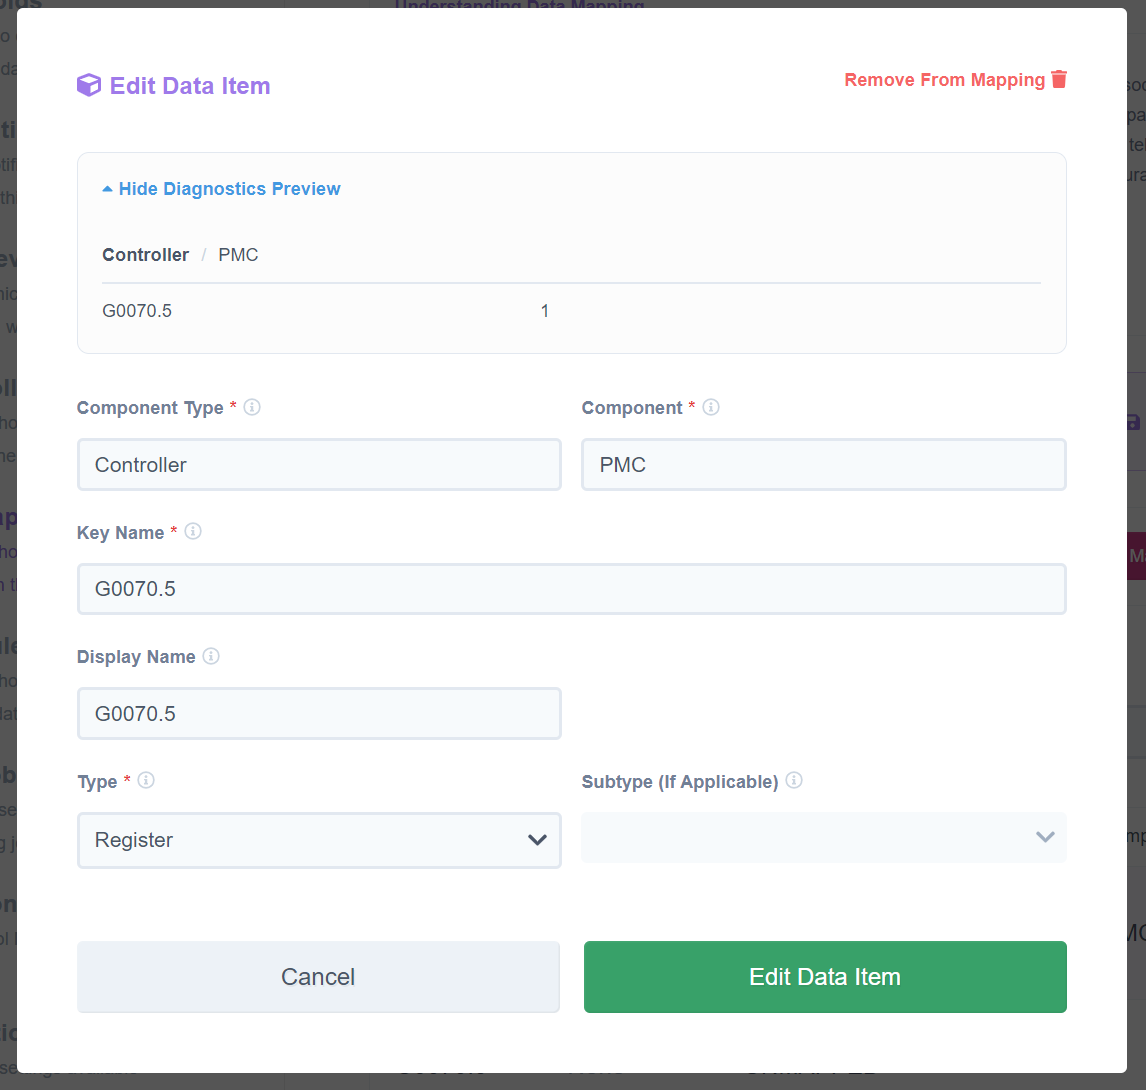
Use the Diagnostics Preview panel to verify signal values in real time:

PMC Data Types and Address Formats
PMC registers support three configuration patterns depending on whether you need the full byte, a single bit, or a specific multi-byte data type.
| Pattern | Description | Example key/value |
|---|---|---|
| Address string | Default data type is BYTE — monitors the entire byte at the register address | "G54": "G54" |
Bit notation (Gxxxx.N) | Monitors a single bit within a register; the .N suffix selects bit N | "G0070.5": "G0070.5" |
| Extended JSON object | Specifies an explicit data type (BYTE, WORD, or DWORD) using address and dtype keys | "D124": { "address": "D124", "dtype": "DWORD" } |
Valid dtype values: BYTE, WORD, DWORD
- Monitoring the entire byte at a PMC register address — When a PMC register is configured with a plain address string, the default data type is BYTE. The adapter reads and reports the full byte value at that register. Example:
"G54": "G54"tracks the byte value at G54. - Monitoring an individual bit in a PMC register — The
Gxxxx.Nnotation targets bit N within the register. Example:"G0070.5": "G0070.5"tracks and reports the 5th bit of register G0070. - Monitoring a PMC register with a specified data type — To read D-addresses or any multi-byte register (WORD or DWORD), use the extended JSON object form with
addressanddtypekeys. Example:"D124": { "address": "D124", "dtype": "DWORD" }.
Example adapter JSON combining all three patterns:
{
  "pmc": {
    "G54": "G54",
    "G0070.5": "G0070.5",
    "D124": { "address": "D124", "dtype": "DWORD" }
  }
}
Use the extended JSON object form ({ "address": "...", "dtype": "..." }) whenever you need to monitor D-addresses or any multi-byte register. Plain address strings always default to BYTE.
P-Codes (Machine Builder Data Table)
P-codes provide access to data stored by machine tool builders in FANUC controls.
What are P-Codes?
- P-codes are a table where machine tool builders store their custom information
- Machine-specific: P-code addresses vary by machine make, model, and control
- Not standardized: Never assume P-code addresses are the same across different FANUC machines
- Used by OEMs to store custom data relevant to their machine design
Common MachineMetrics Use Case: Tool Life Tracking
While P-codes can store any machine builder data, MachineMetrics most commonly uses them to track tool life management (TLM) data.
⚠️ IMPORTANT: P-code addresses for tool life are machine-specific. You must discover the addresses for each machine using the procedure below.
How to Discover P-Code Addresses for Tool Life
Follow these steps to identify which P-code addresses contain tool life data on your specific machine:
Step 1: Enable Parameter Write (PWE)
- See Enabling Parameter Write section for instructions
- Enable PWE to allow parameter changes
Step 2: Set Parameter 9000#1 (NDP) = 1
- Press SYSTEM button
- Navigate to Parameters
- Search for parameter 9000
- Set bit #1 (NDP) = 1
- This enables P-code variable display
Step 3: Access Macro Screen
- Press OFFSET hard key
- Press Macro screen key
- Press EXEC screen key
- You should now see P-code variables
Step 4: Output P-Code Variables to USB
- Press OPRT menu key
- Select Output or Punch
- Set I/O channel:
- 17 for USB
- 4 for Memory Card
- Specify output file name (e.g.,
PCODE.TXT) - Execute output
- P-code variables will be saved to USB/card
Step 5: Restore Settings
- Set parameter 9000#1 back to 0
- Turn off PWE (see Parameter Safety)
Step 6: Take Photo of TLM Screen
- On the CNC control, navigate to the Tool Life Management (TLM) screen
- Take a clear photo showing:
- Tool group numbers
- Tool life preset values
- Tool life count/remaining values
- Note which tools are in use and their current counts
Step 7: Match Values on PC/Mac
- Open the P-code output file from USB on your computer
- Search for the values from the TLM screen photo
- Look for clusters of values that match TLM data
- P-code addresses for related TLM data will be close together
- Document the addresses:
- Which P-codes = Tool Life Preset
- Which P-codes = Tool Life Count
- Which tool groups they correspond to
Example:
If you see on TLM screen:
- Tool Group 1: Preset = 500, Count = 350
- Tool Group 2: Preset = 1000, Count = 750
Search P-code file for 500 and 350 (should be near each other), and 1000 and 750.
You might find:
- P-code 12101 = 500 (Tool 1 Preset)
- P-code 12201 = 350 (Tool 1 Count)
- P-code 12102 = 1000 (Tool 2 Preset)
- P-code 12202 = 750 (Tool 2 Count)
Configuration Example
Once you've identified P-code addresses, configure them in MachineMetrics:
{
  "pcodes": {
    "TLM_1_PRESET": {
      "addr": 12101,
      "path": [1]
    },
    "TLM_1_COUNT": 12201,
    "TLM_2_PRESET": 12102,
    "TLM_2_COUNT": 12202,
    "TLM_3_PRESET": 12103,
    "TLM_3_COUNT": 12203,
    "TLM_4_PRESET": 12104,
    "TLM_4_COUNT": 12204,
    "TLM_5_PRESET": 12105,
    "TLM_5_COUNT": 12205
  }
}
Replace the addresses (12101, 12201, etc.) with the addresses discovered from your specific machine.
Other P-Code Use Cases
Beyond tool life, P-codes may contain:
- Custom part counters
- Machine-specific process parameters
- OEM-specific automation data
- Pallet changer status
- Bar feeder information
- Custom measurements or setpoints
To discover what data is in P-codes:
- Use the same procedure above
- Cross-reference P-code values with machine displays
- Consult machine builder documentation
- Contact machine OEM for P-code map
Data Mapping in MachineMetrics
For Tool Life:
- Preset values → Map to Target or Setpoint
- Count/Remaining values → Map to Actual or Sample
- Can calculate remaining life (Preset - Count)
For Other Data:
- Map to appropriate type based on data purpose
- Use descriptive names in JSON configuration
- Document what each P-code represents
Complete Advanced JSON Example
Here's a comprehensive example combining PMC, P-codes, and macros for a multi-spindle lathe with tool life management:
⚠️ IMPORTANT: These addresses are examples only. PMC addresses, P-codes, and macro numbers vary by machine model and machine tool builder. You must find the correct addresses for your specific machine in the machine manual or PMC ladder diagram.
{
  "pmc": {
    "X5_0_MAIN_COLLET_OPEN": "X5.0",
    "X5_1_MAIN_SP_CLAMP": "X5.1",
    "X5_2_MAIN_SP_UNCLAMP": "X5.2",
    "X5_3_CUT_OFF_TOOL_OFF": "X5.3",
    "X5_4_CUT_OFF_TOOL_ON": "X5.4",
    "X9_1_DOOR_INTLOCK_MAIN": "X9.1",
    "X7_0_BAR_STOCK_EMPTY": "X7.0",
    "X7_3_BAR_FEED_READY": "X7.3",
    "X47_6_KEY_SWITCH": "X47.6",
    "Y53_5_ONE_CYCLE": "Y53.5",
    "Y53_1_AUTO_CUT_OFF": "Y53.1",
    "Y53_2_AIR_CUT": "Y53.2",
    "Y52_3_MACRO_BUTTON": "Y52.3"
  },
  "pcodes": {
    "TLM_1_PRESET": {
      "addr": 12101,
      "path": [1]
    },
    "TLM_1_COUNT": 12201,
    "TLM_2_PRESET": 12102,
    "TLM_2_COUNT": 12202,
    "TLM_3_PRESET": 12103,
    "TLM_3_COUNT": 12203,
    "TLM_4_PRESET": 12104,
    "TLM_4_COUNT": 12204,
    "TLM_5_PRESET": 12105,
    "TLM_5_COUNT": 12205,
    "TLM_6_PRESET": 12106,
    "TLM_6_COUNT": 12206,
    "TLM_7_PRESET": 12107,
    "TLM_7_COUNT": 12207,
    "TLM_8_PRESET": 12108,
    "TLM_8_COUNT": 12208,
    "TLM_9_PRESET": 12109,
    "TLM_9_COUNT": 12209,
    "TLM_10_PRESET": 12110,
    "TLM_10_COUNT": 12210
  },
  "macros": {
    "X1_Wear_1": 2001,
    "X1_Wear_2": {
      "addr": 2002,
      "path": [1]
    },
    "X1_Wear_3": {
      "addr": 2003,
      "path": [1]
    },
    "X1_Wear_4": {
      "addr": 2004,
      "path": [1]
    },
    "X1_Wear_5": {
      "addr": 2005,
      "path": [1]
    },
    "Z1_Wear_1": {
      "addr": 2101,
      "path": [1]
    },
    "Z1_Wear_2": {
      "addr": 2102,
      "path": [1]
    },
    "Z1_Wear_3": {
      "addr": 2103,
      "path": [1]
    },
    "Z1_Wear_4": {
      "addr": 2104,
      "path": [1]
    },
    "Z1_Wear_5": {
      "addr": 2105,
      "path": [1]
    },
    "X2_Wear_1": {
      "addr": 2001,
      "path": [2]
    },
    "X2_Wear_2": {
      "addr": 2002,
      "path": [2]
    },
    "X2_Wear_3": {
      "addr": 2003,
      "path": [2]
    },
    "X2_Wear_4": {
      "addr": 2004,
      "path": [2]
    },
    "X2_Wear_5": {
      "addr": 2005,
      "path": [2]
    },
    "Z2_Wear_1": {
      "addr": 2101,
      "path": [2]
    },
    "Z2_Wear_2": {
      "addr": 2102,
      "path": [2]
    },
    "Z2_Wear_3": {
      "addr": 2103,
      "path": [2]
    },
    "Z2_Wear_4": {
      "addr": 2104,
      "path": [2]
    },
    "Z2_Wear_5": {
      "addr": 2105,
      "path": [2]
    }
  }
}
This example demonstrates:
- PMC signals for machine status (collet, chuck, bar feeder, doors)
- P-codes for tool life management (10 tool groups)
- Macro variables for tool wear offsets (2 paths, 5 tools per axis)
- Path specification for multi-spindle machines
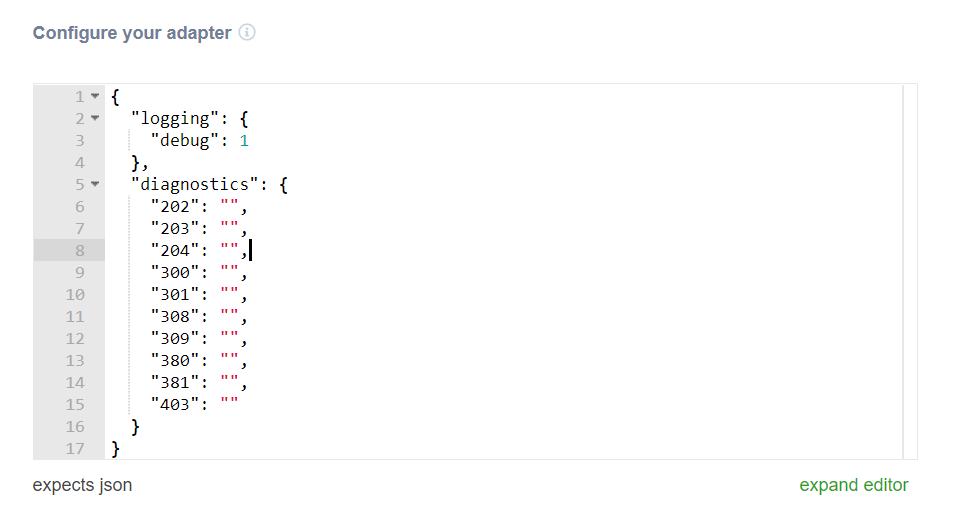
Configuration Steps:
-
Add JSON to Machine Configuration
- Assets → Machines → Select Machine → Edit
- Data Collection → Adapter Configuration
- Paste JSON into adapter script field
-
Save and Wait for Data Collection
- Save configuration
- Wait 1-2 minutes for data to appear
-
Map Data Items
- Assets → Machines → Data Mapping
- All new data items appear in left column
- Map each to appropriate type:
- PMC signals → Event
- P-code presets → Target
- P-code counts → Actual
- Macro wear values → Sample
-
Verify Data in Diagnostics
- Navigate to machine → Diagnostics tab
- Check that all configured items are reporting
- Verify values match control screen
Multi-Path Machines
Multi-path (multi-channel) machines have multiple independent machining processes.
Configuration:
{
  "macros": {
    "path1_parts": 501,
    "path2_parts": 502,
    "all_paths_status": { "addr": 600, "path": [-1] }
  }
}
Data Mapping:
- Path 2+ data items will have path number suffixed
- Example:
all_paths_status(path 1),all_paths_status2(path 2)
Components:
- Map data to correct path/spindle
- Path naming may not directly correspond (e.g., A12 in data vs A2 in UI)
- Use domain knowledge to match components correctly
Diagnostics Configuration
Common Diagnostics:
| Code | Description | Type |
|---|---|---|
| 200 | Servo Alarm Status | Bitfield |
| 308 | Servo Motor Temperature | Numeric (°C) |
| 309 | Pulsecoder Temperature | Numeric (°C) |
| 403 | Spindle Temperature | Numeric (°C) |
| 300 | Servo Load | Numeric (%) |
Configure diagnostics in the adapter JSON:
Bitfield Diagnostics:
- Some diagnostics encode multiple values in bits
- MachineMetrics automatically extracts each bit
- Example: Diag200Bit0_X, Diag200Bit1_X, etc.
Diagnostic Key Format:
Diag[Code]_[Axis/Spindle][Path]- Example:
Diag308_Z= Servo temp for Z axis - Example:
Diag403_S2= Spindle temp for spindle 2
After saving, go to Data Mapping and map each diagnostic item:
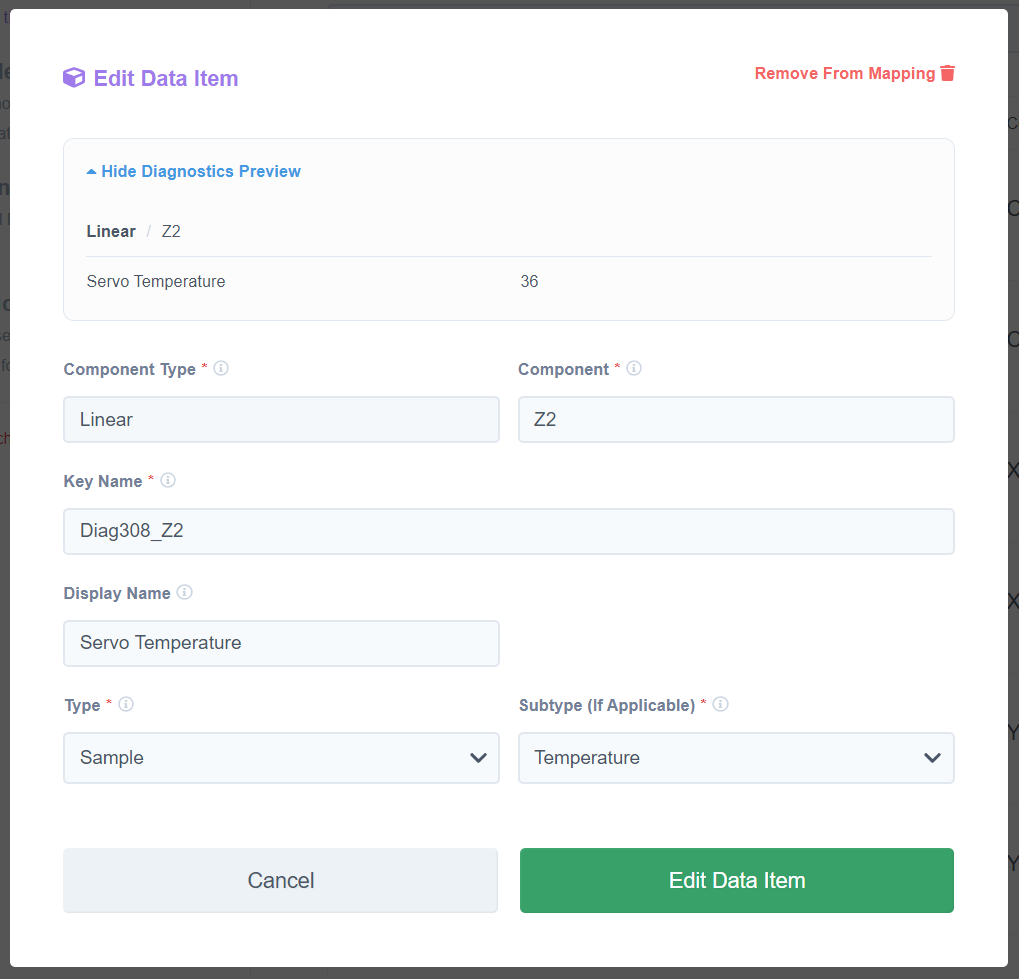
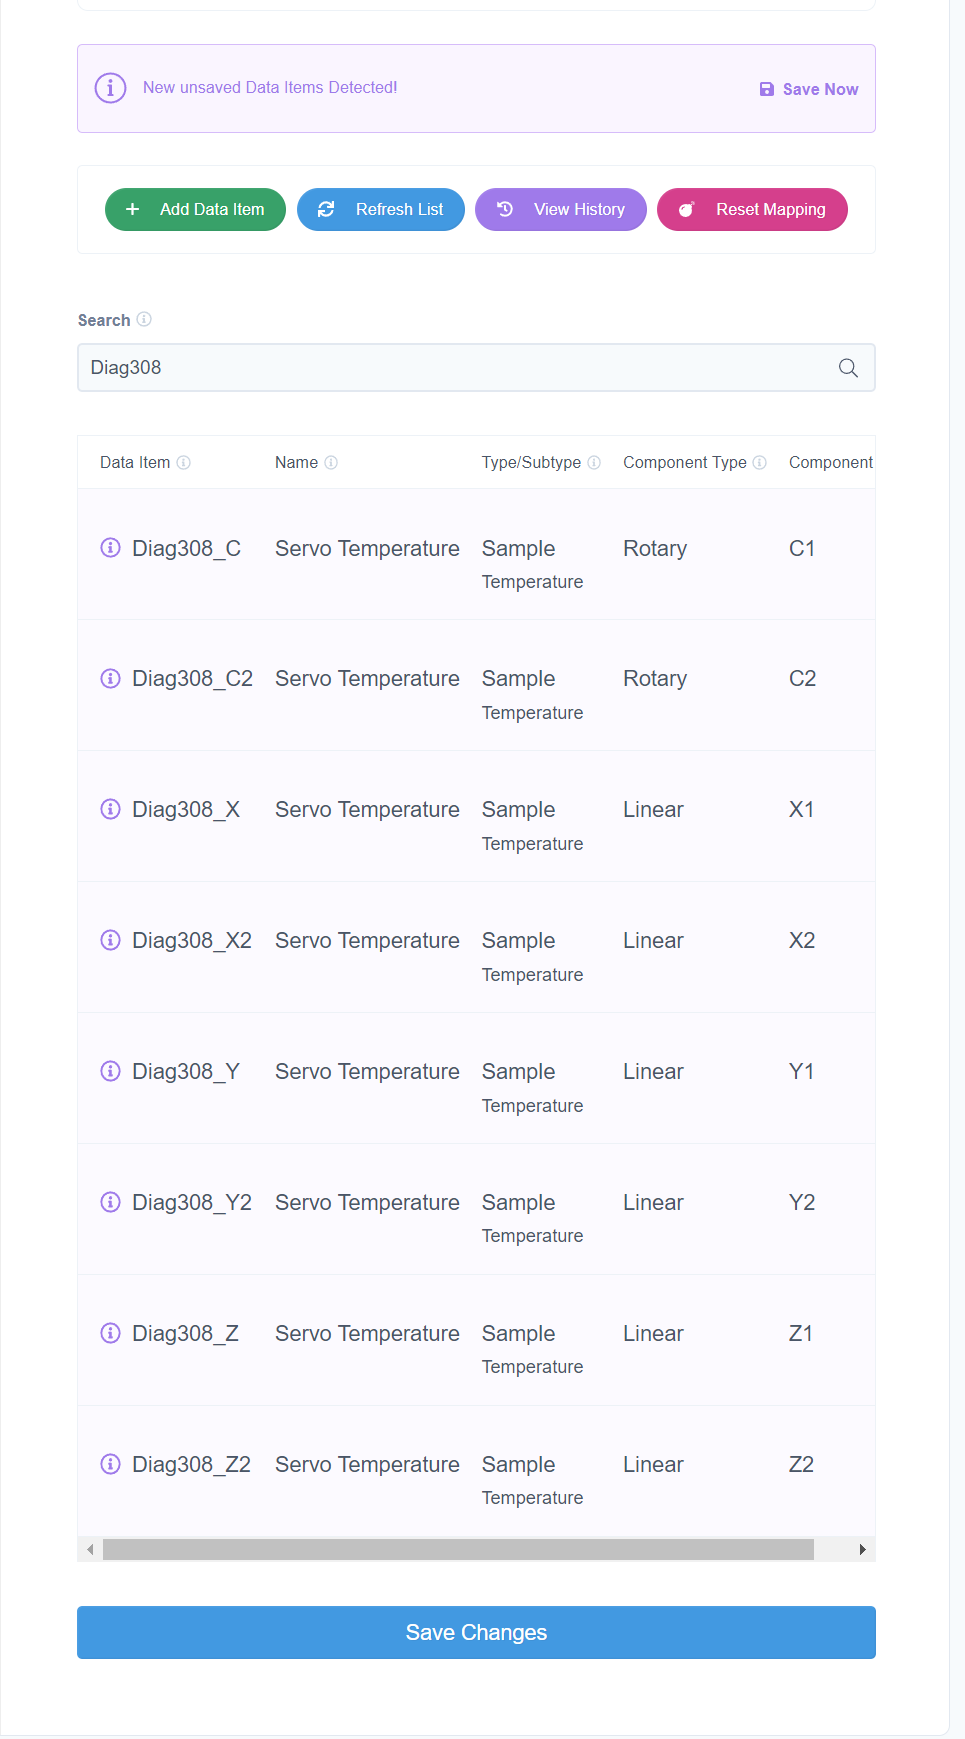
After mapping all axes, the Data Mapping list will show all Diag308 items per axis:
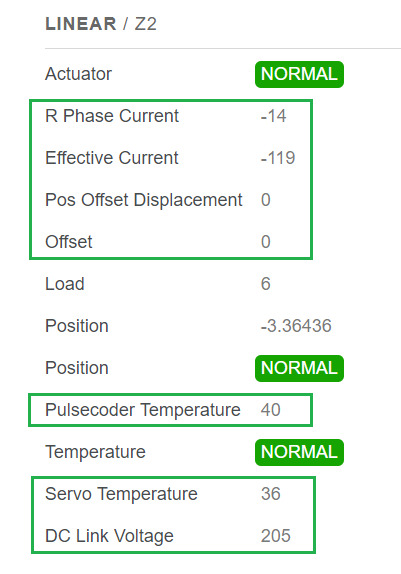
Live diagnostics view in MachineMetrics:
Mapping Tips:
- Use descriptive display names
- Map to correct Component/Subcomponent
- Pay attention to multi-path naming differences
- Refer to FANUC manuals for diagnostic code meanings
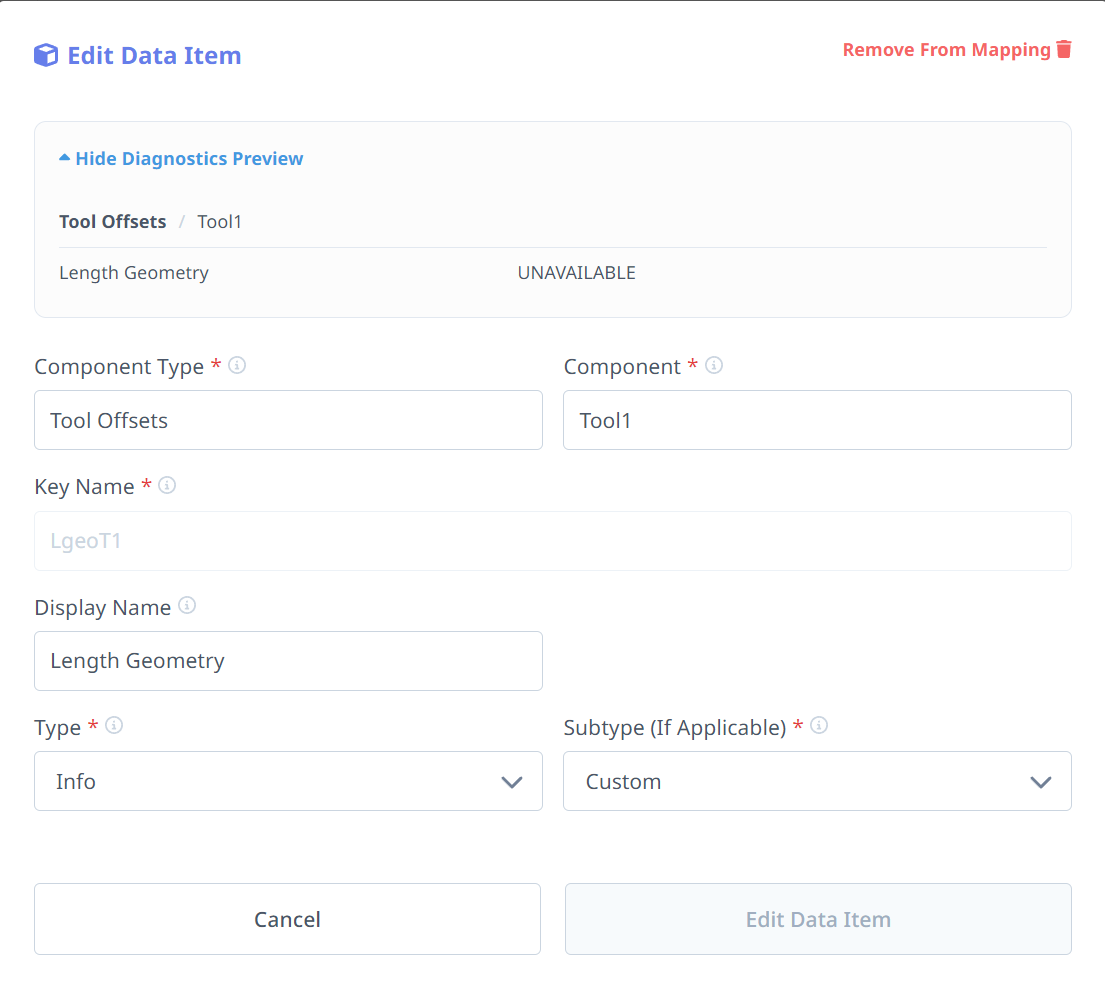
Tool Offsets
Tool offset configuration allows tracking of tool wear and compensation values.
Configuration in MachineMetrics:
- Edit machine → Data Collection
- Enable tool offset tracking
- Map tool data items
After refreshing the data items list, tool offset entries appear in Data Mapping. Open any item to configure:
Use Cases:
- Tool wear monitoring
- Predictive tool replacement
- Quality correlation with tool condition
Rapid Dial Address
For tracking feed/rapid override dial position:
Purpose: Display real-time override percentage in dashboards
Finding the Rapid Dial Address:
-
Access PMC Diagnosis
- Press SYSTEM → PMC → DIAGNOS
- This shows I/O monitor with X-addresses (inputs)
-
Search for Override Dial
- Press SEARCH → type
X0→ EXECUTE - Rotate rapid/feed-override dial slowly (0 → 25 → 50 → 75 → 100%)
- Watch for bits that flip when dial moves
- Press SEARCH → type
-
Identify the Address
- Note full address (e.g., X010 or X10)
- Confirm by rotating back and forth
- Only that X-word should toggle with dial
-
Map Each Position
- Record binary pattern for each detent
- Example: 0% = 0000, 25% = 0001, 50% = 0010, etc.
-
Contact MachineMetrics
- Provide X-address and mapping
- We'll configure dashboard to show correct percentage
OEM-Specific Notes
Makino (Pro 6 Control)
Control Type: FANUC-based (Pro 6)
Special Considerations:
- Pro 6 is a customized FANUC interface built on FANUC hardware
- FOCAS setup is similar to standard FANUC, but accessed through different menus
- The FANUC NCU (control unit) is located in the electrical cabinet, not integrated into the machine display
- Configuration requires accessing both the Pro 6 interface and underlying FANUC system
Pro 6 Router Login Credentials
The Makino Pro 6 control has an internal router that manages the machine's network. You may need to log into this router to configure network settings or verify the FANUC IP address. Credentials are case-sensitive:
| Field | Value |
|---|---|
| Username | admin |
| Password | PRO |
⚠️ Note the uppercase password — entering
proorProwill not work.
Accessing FANUC Configuration on Pro 6
The Pro 6 interface masks the standard FANUC menus. To configure FOCAS, you need to access the underlying FANUC system:
Method 1: CNC Screen Display Program
- On the Pro 6 control, navigate to the Windows desktop
- Search for "CNC Screen Display" program
- Launch this application to access the standard FANUC interface
- This provides direct access to FANUC menus for configuration
The CNC Screen Display program provides access to standard FANUC configuration menus on Pro 6 controls.
Method 2: Chevron Navigation
Alternatively, you can access FANUC configuration through the Pro 6 interface:
- Press the SYSTEM hard key on the control panel
- Look for chevron icons (>>) in the menu
- Select the chevrons to access underlying FANUC configuration
![]()
Chevron icons (>>) in the Pro 6 interface provide access to FANUC configuration menus.
Locating the FANUC NCU
The FANUC NCU (Network Control Unit) is located in the electrical cabinet, not in the machine display housing.
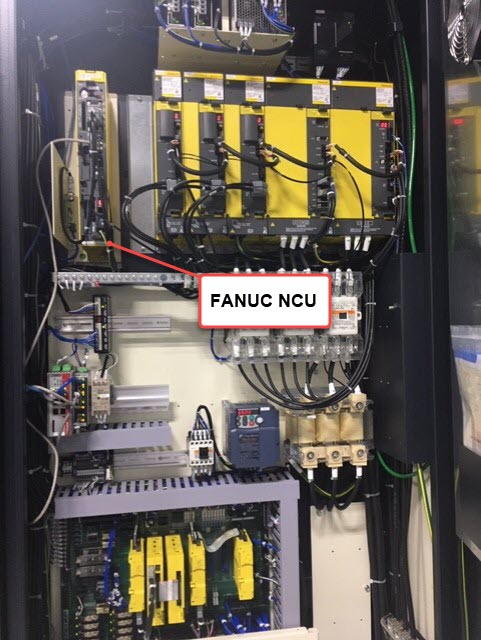
The FANUC NCU in a Makino electrical cabinet. The embedded Ethernet port (CD38A) is located on this unit.
Finding the Embedded Ethernet Port:
- Open the electrical cabinet (requires key/permission)
- Locate the FANUC NCU unit (typically labeled)
- Find the CD38A Ethernet port on the NCU
- This is where you'll connect the Edge device or Ethernet cable
Pro 6 FOCAS Configuration Steps
Once you've accessed the FANUC interface (via CNC Screen Display or chevrons):
Step 1: Configure IP Address
- Navigate to ETHPRM or EMBED PORT menu
- Set IP address, subnet mask, and gateway
- Ensure IP is static or has a DHCP reservation
The FANUC embedded port settings screen looks the same on a Makino Pro 6 as on a standard FANUC machine:
Step 2: Configure FOCAS Port
- Find FOCAS 2 and COMMON settings
- Set TCP PORT to 8193
- Leave UDP blank or at 0
- Set Timeout to 0
Step 3: Set Available Device
- Navigate to embedded port settings
- Set AVAILABLE DEVICE to EMBEDDED (not PCMCIA)
- This ensures the embedded Ethernet port is active
Step 4: Restart
- Look for RESTART option in menus
- Execute restart to apply network settings
- If restart option not available, power cycle the machine
Verifying Configuration
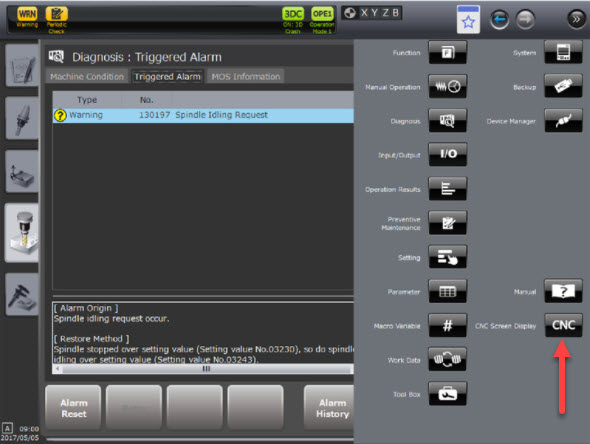
Check Alarms Screen:
Pro 6 controls have a dedicated diagnostics screen that shows network and FOCAS status:
- Navigate to the Diagnosis menu
- Check for Triggered Alarm tab
- Look for any FOCAS or network-related alarms
- Common alarm: "130197 Spindle Idling Request" - this is normal and can be ignored
- Use the chevrons (>>) to expand alarm details if needed
Test Connection:
- From a computer on the same network, ping the machine IP
- Verify port 8193 is accessible
- In MachineMetrics, add the machine using FOCAS adapter
- Check Timeline and/or Diagnostics for data updates
Common Pro 6 Issues
Cannot Find ETHPRM Menu:
- Use "CNC Screen Display" program to access FANUC interface
- Or look for chevron icons (>>) to access hidden menus
Embedded Port Not Responding:
- Verify "AVAILABLE DEVICE" is set to EMBEDDED
- Check physical connection to CD38A port on NCU in cabinet
- Ensure port 8193 is not blocked by firewall
Alarm 130197 - Spindle Idling Request:
- This alarm appears during configuration but is normal
- It's a warning, not an error
- Can be safely ignored for MachineMetrics connectivity
Pro 6 Interface vs FANUC Interface:
- Pro 6 interface is a custom overlay
- All FANUC functionality is still present underneath
- Use CNC Screen Display for easier access to FANUC menus
Makino-Specific Notes
Part Counting:
- Some Makino machines use proprietary part counting methods
- Check parameter 6710 for custom M-code (if applicable)
- May need to work with Makino service for part count configuration
Custom Parameters:
- Makino may have custom parameter numbers
- Refer to Makino documentation for machine-specific settings
- Contact Makino support if standard FANUC parameters don't appear
DMG MORI / Mori Seiki
DMG MORI machines can have FANUC, Siemens, Mitsubishi, or Heidenhain backends. For complete DMG MORI connectivity instructions — including CELOS configuration for all backend types, MAPPS controls, and the backend decision tree — see the dedicated DMG MORI Connectivity Guide.
For DMG MORI machines with a FANUC backend, FOCAS setup follows the standard FANUC process described in this guide.
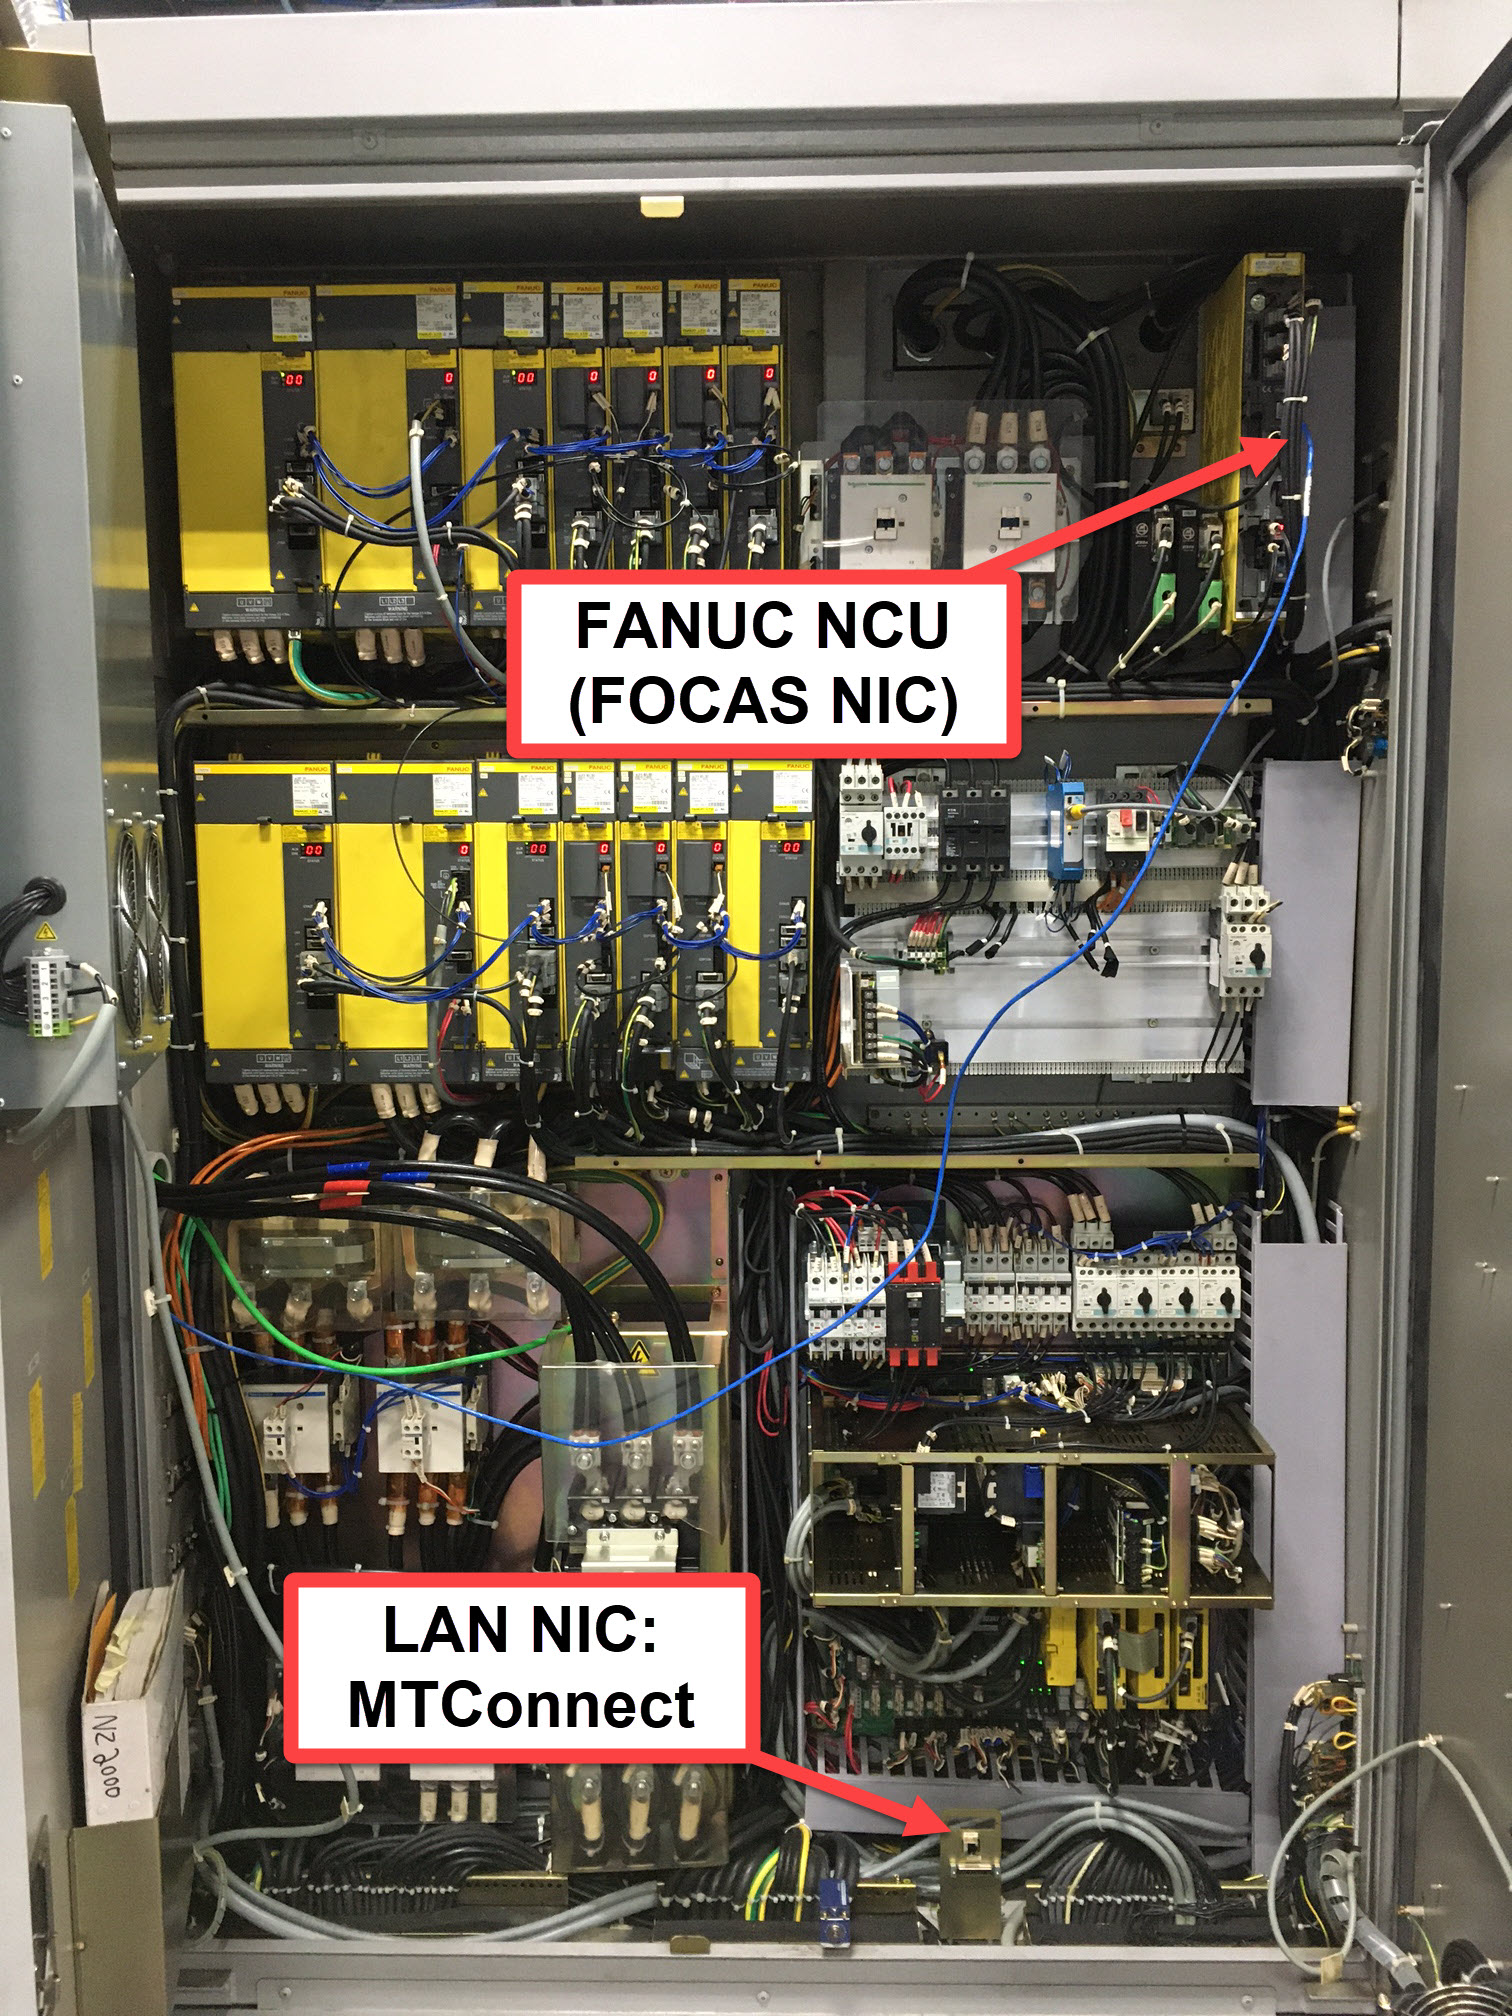
Locating the FANUC NCU on Mori Seiki machines
On Mori Seiki machines with a FANUC backend, the control cabinet contains two separate network interfaces — the FANUC NCU (FOCAS NIC) for FOCAS data collection, and a separate LAN NIC used for MTConnect. Connect the Edge device to the FANUC NCU port for FOCAS.
Configuring Network Settings on MAPPS Controls
On machines with the MAPPS interface, network settings are accessed through COMM. SETNG (Communication Settings):
- Press the COMM. SETNG soft key at the bottom of the screen
- Select 1 NETWORK BASIC SETTING
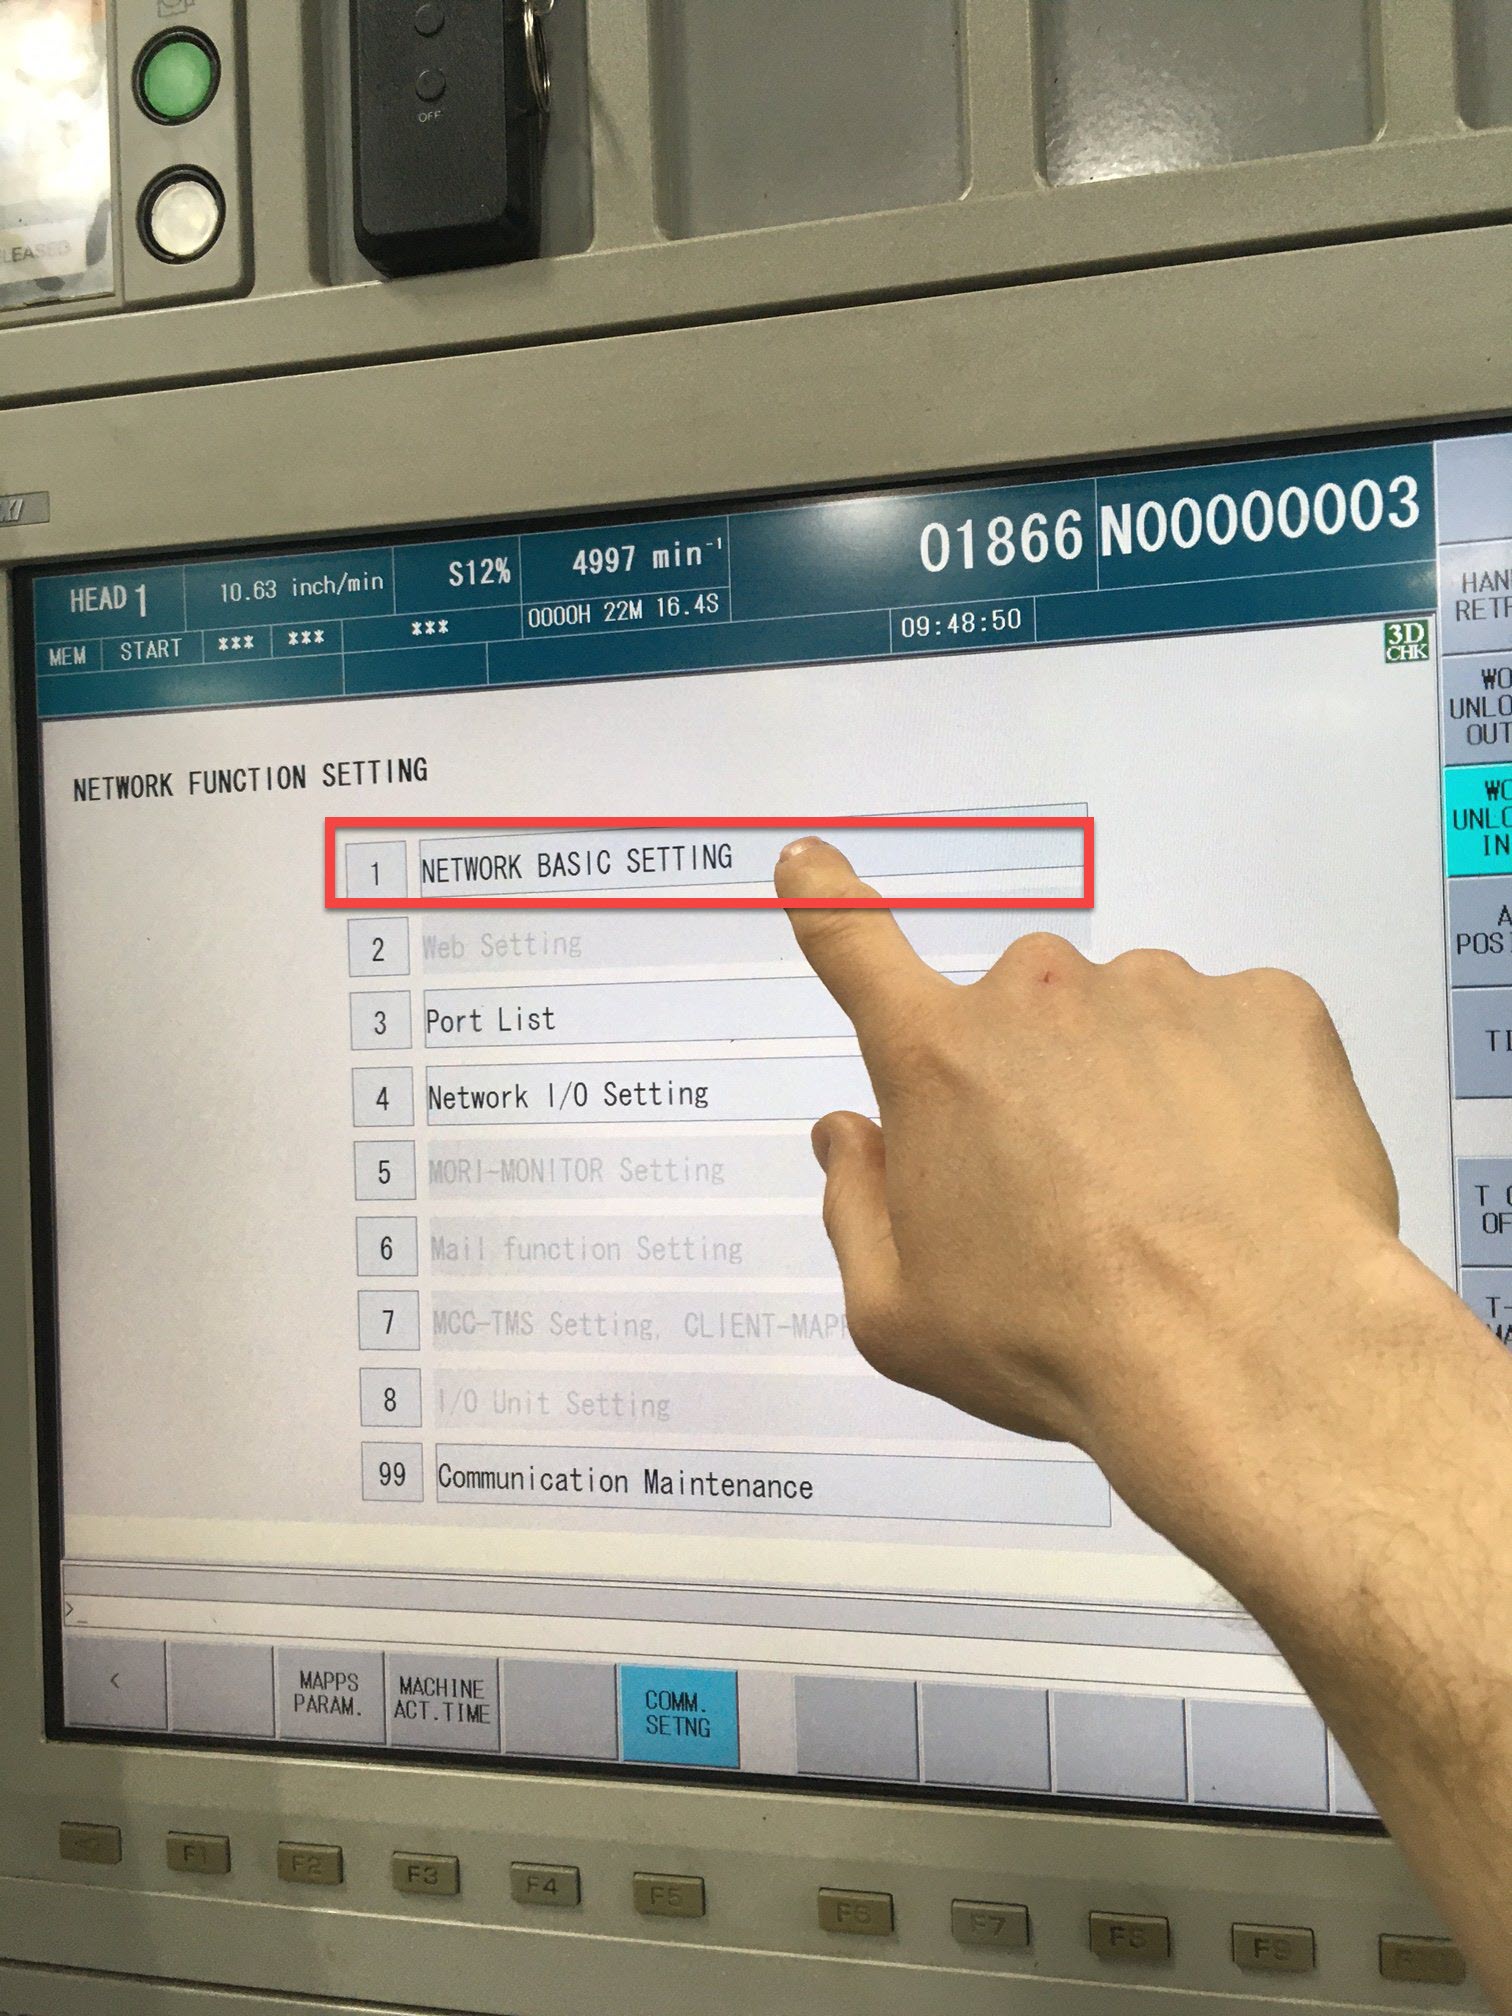
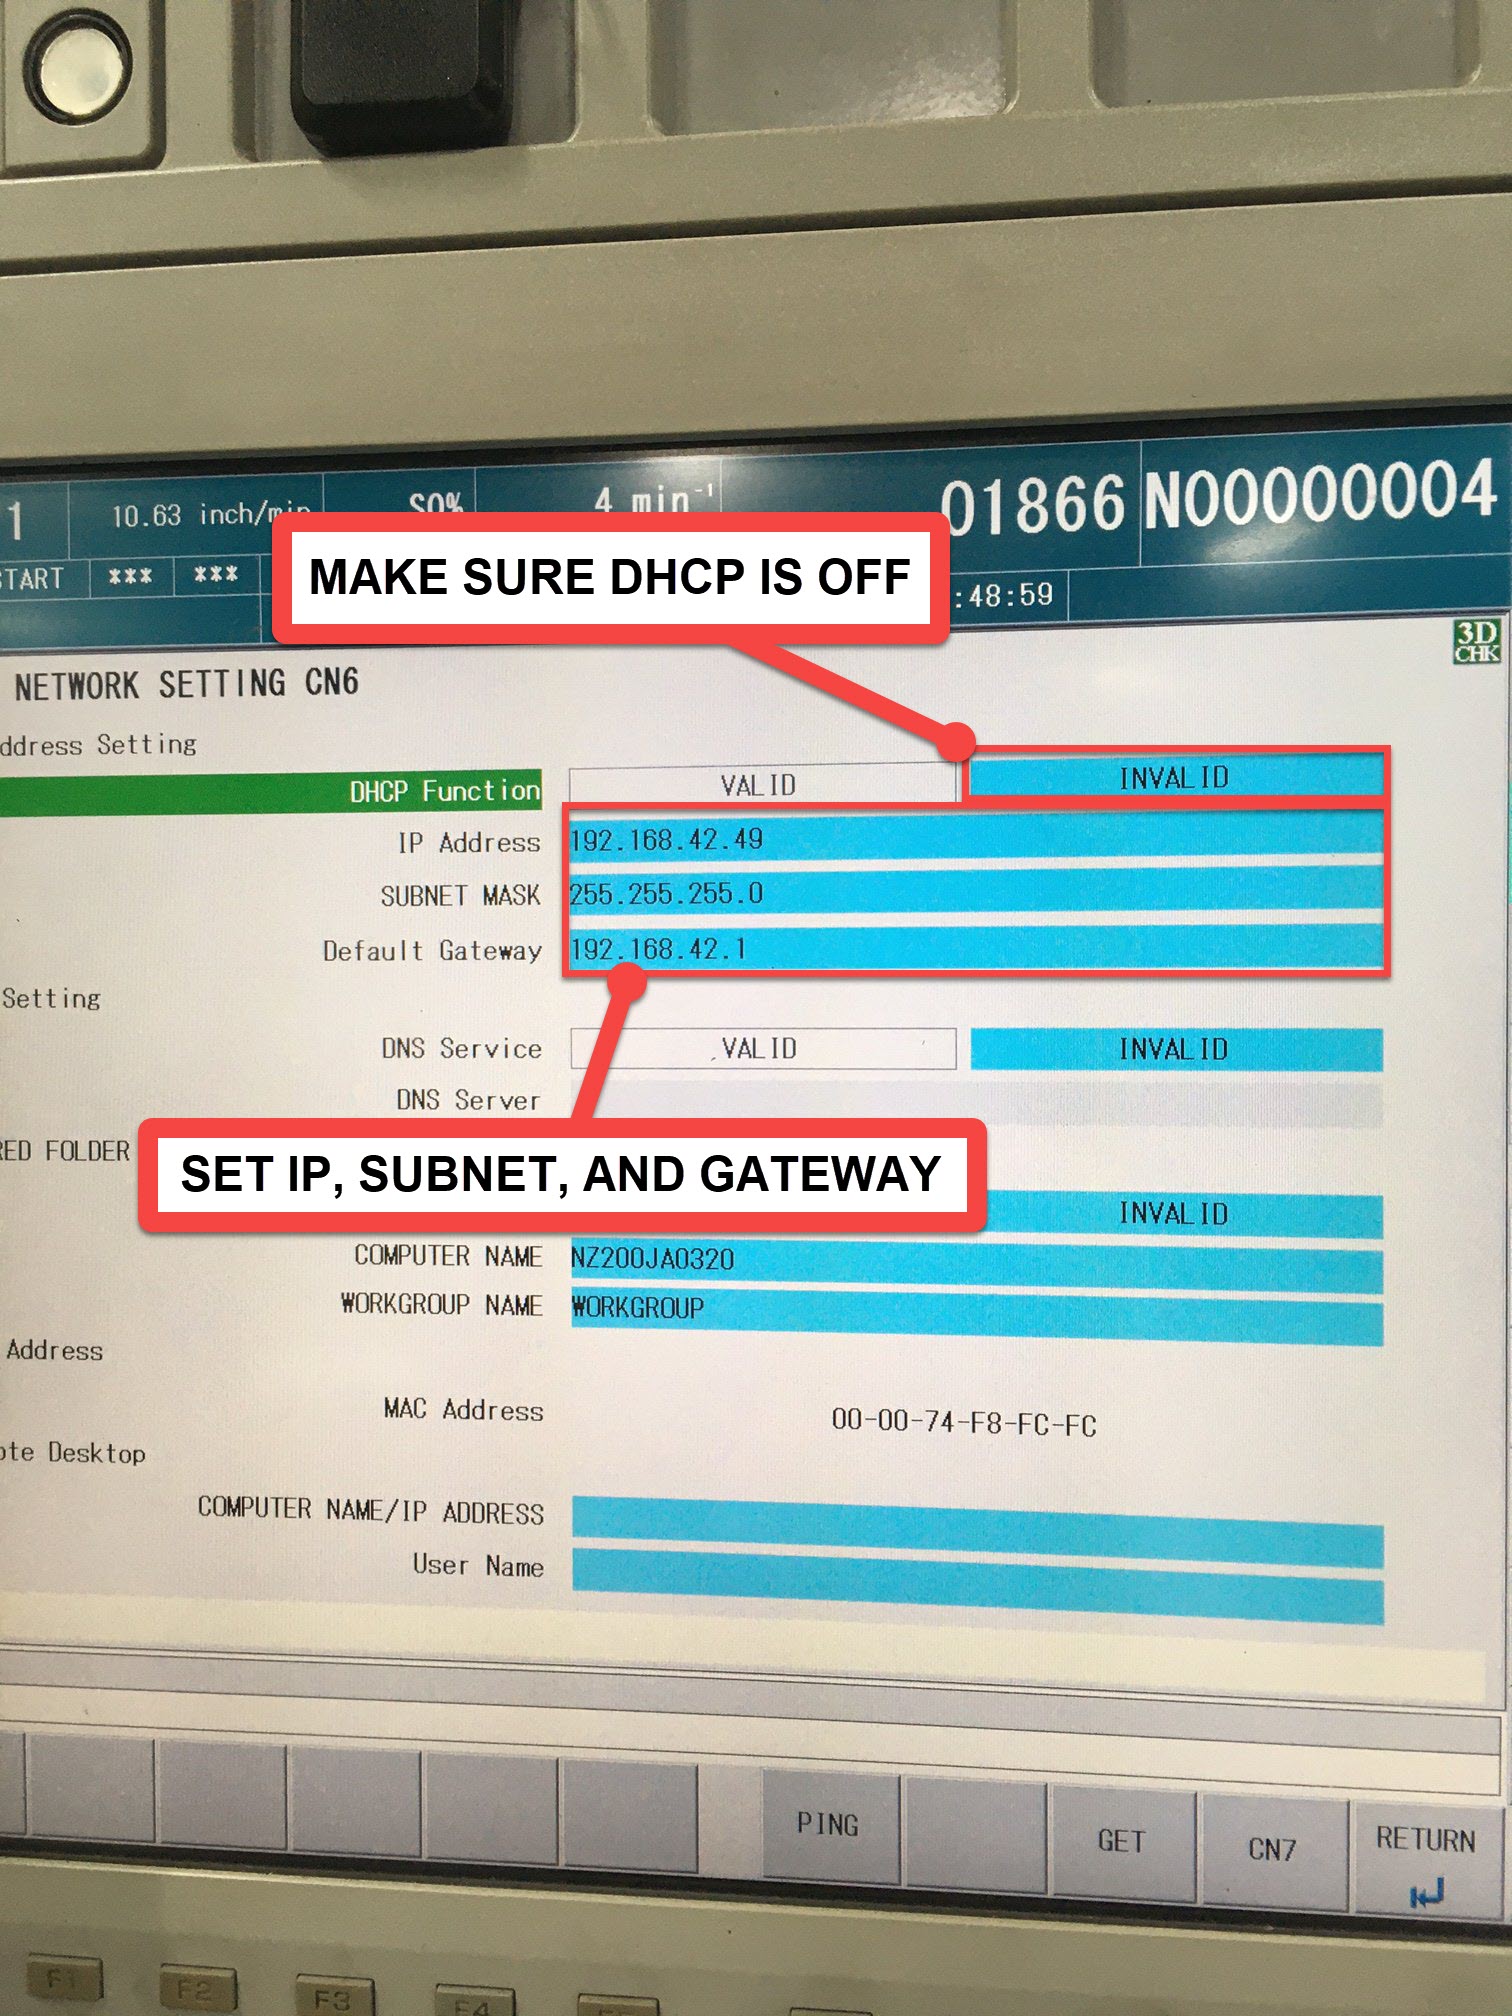
- In the Network Basic Setting screen, set DHCP Function to INVALID and enter the static IP, Subnet Mask, and Default Gateway:
Amada
Control Type: FANUC-based (various series, including AMNC-3i)
Special Considerations:
- Amada machines often have custom parameter sets
- Part counting may use Amada-specific M-codes
- Check with Amada for recommended configuration
- Nearly always have their own internal network for peripheral devices
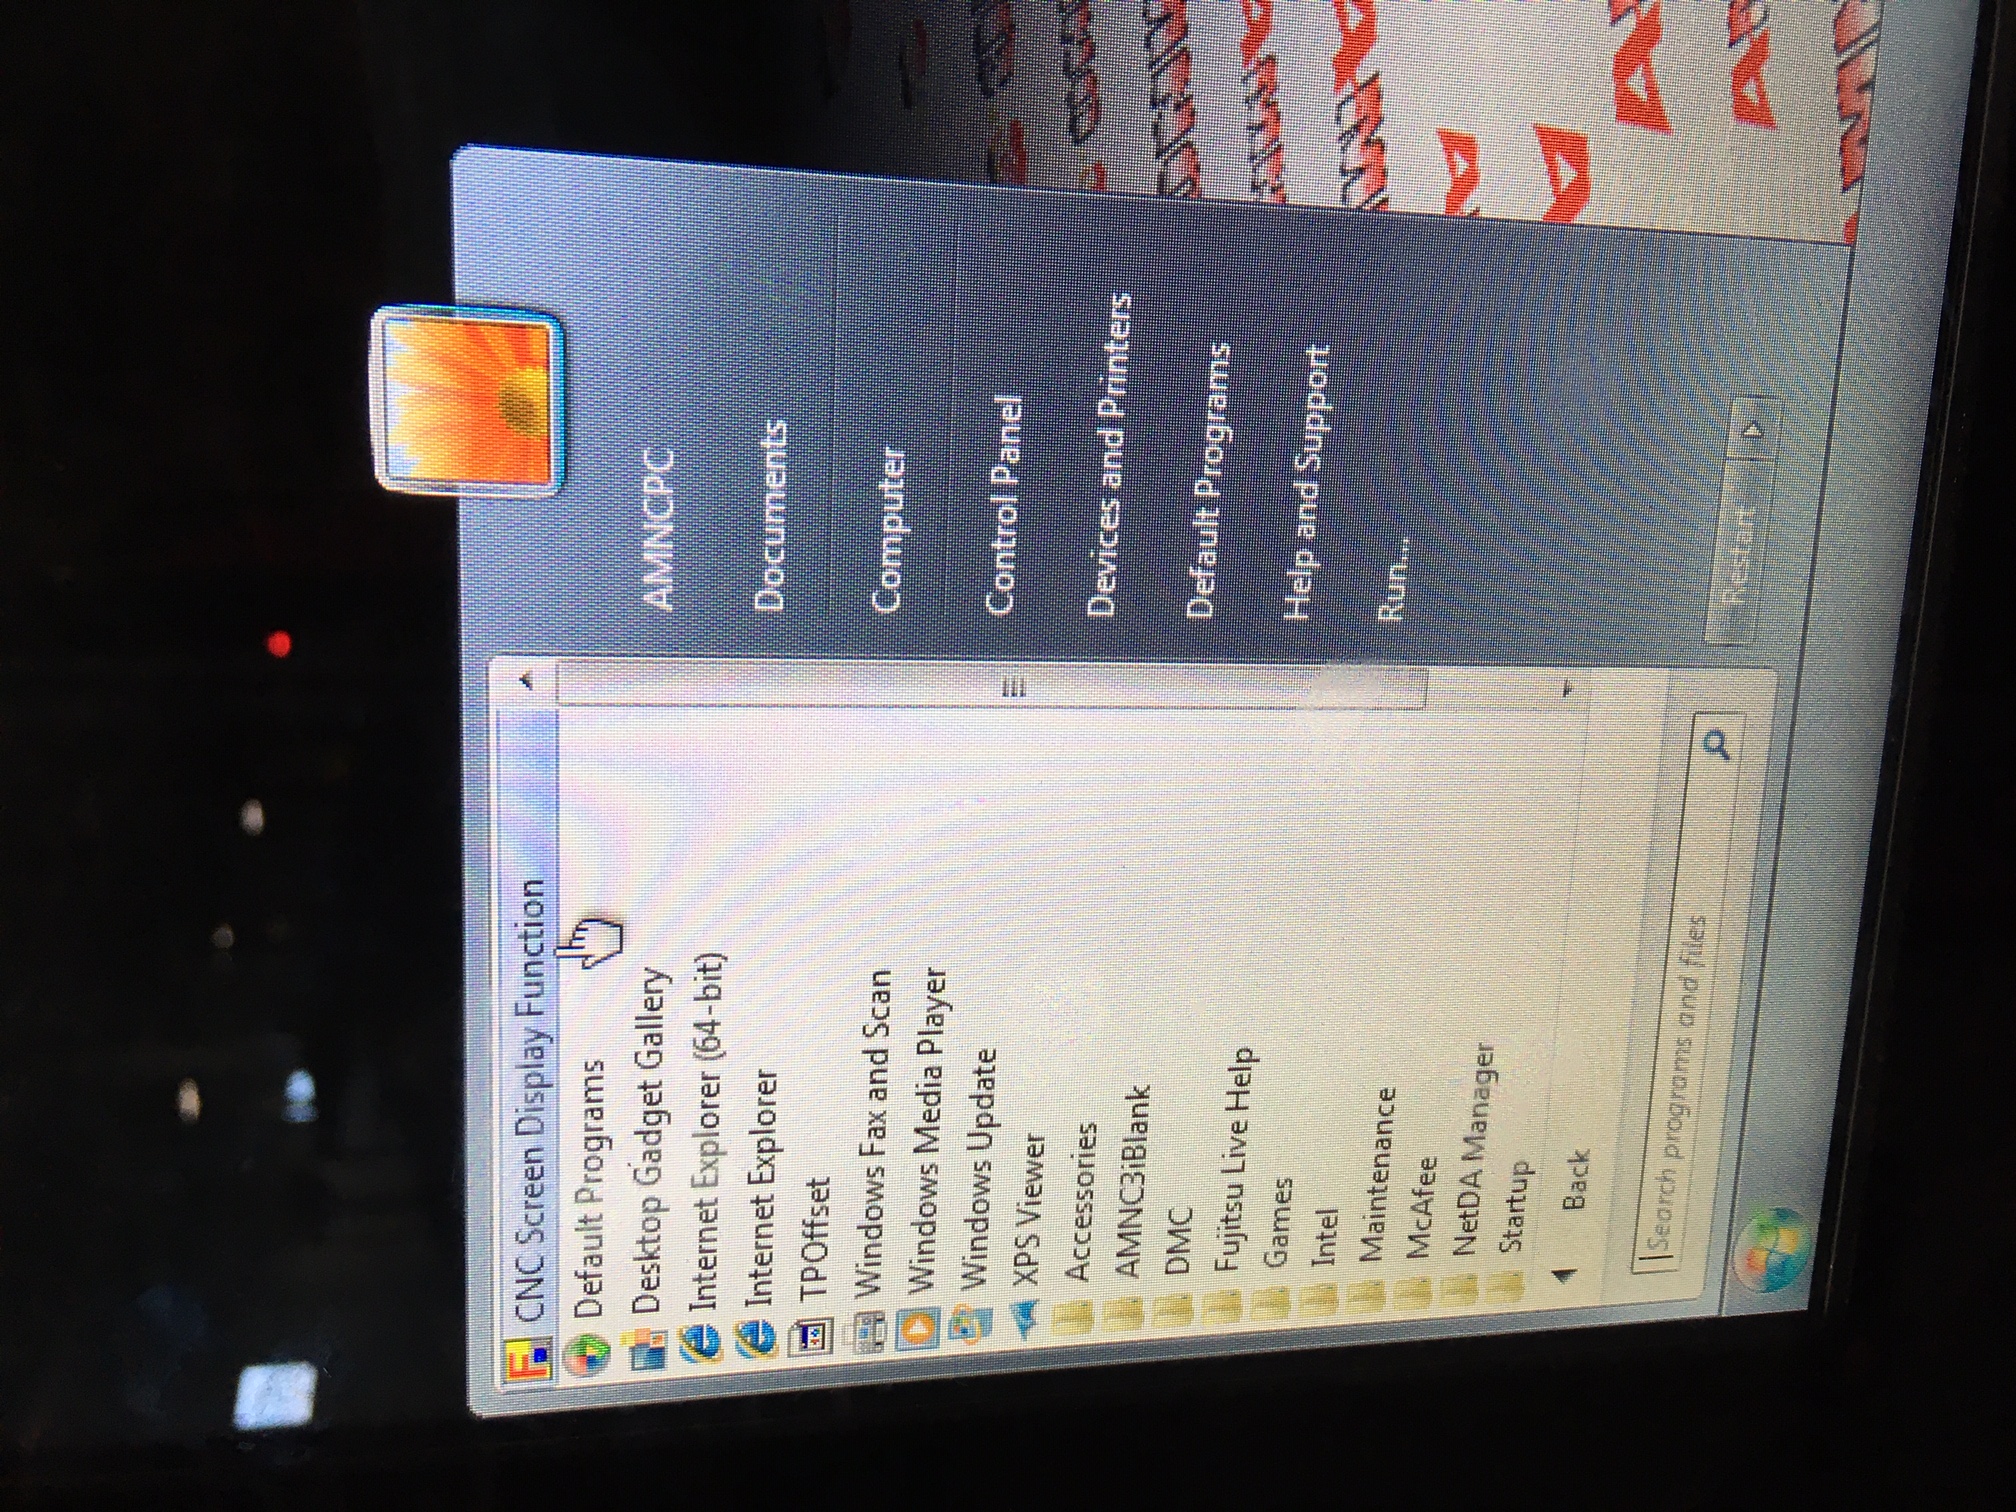
Accessing FANUC Settings on AMNC-3i Controls
Amada machines running the AMNC-3i interface use a Windows-based PC front-end. To configure the FANUC embedded Ethernet port, launch the CNC Screen Display Function from the Windows Start menu — this gives you direct access to standard FANUC configuration screens:
Locating the FANUC NCU in the Electrical Cabinet
Internal Network Consideration:
⚠️ IMPORTANT: Amada machines typically have an internal network connecting multiple peripheral devices (press brake, load/unload systems, safety controllers, etc.) to the FANUC control.
Check CD38A Port Usage:
- Verify if the CD38A (embedded Ethernet) port is already in use
- Look for existing Ethernet connections to the FANUC control
- Check if peripheral devices are communicating via the embedded port
If CD38A Port Is In Use:
We recommend using a dedicated 1:1 Edge device for the Amada machine:
Setup:
- Connect the Edge device to the existing internal network
- The Edge bridges the Amada internal network to your company network
- This preserves the isolated network for all Amada peripheral devices
- Edge provides secure connection to MachineMetrics cloud
Why This Is Important:
- Amada's internal network often uses specific IP addressing
- Peripheral devices may not function if network is disrupted
- A dedicated Edge device prevents network conflicts
- Maintains Amada's safety and control systems isolation
If CD38A Port Is Available:
If the embedded port is not in use, you can connect directly:
- Follow standard FOCAS setup
- Connect Edge device directly to CD38A port
- Configure network settings as normal
Configuration:
- Standard FOCAS setup applies
- Verify M-code configuration with Amada documentation
- Some models may have multiple part counters
FANUC Roboshot (Injection Molding)
Control Type: FANUC-based (injection molding machines)
FOCAS Support: Rarely available on Roboshot machines
Special Considerations:
- Roboshot machines (injection molding) rarely have FOCAS capability
- Even if the machine has a FANUC control, FOCAS may not be enabled
- Unlike CNC machines, injection molding controls often use different communication protocols
- In our experience, it is unlikely to support FOCAS
Testing for FOCAS Support on Roboshot
Before attempting full FOCAS configuration, test if FOCAS is available:
Step 1: Configure IP Address
- Access network settings on the Roboshot control
- Assign a static IP address to the machine
- Note the IP address for testing
Step 2: Test FOCAS Port (Telnet Test)
-
From a computer on the same network, open terminal/command prompt
-
Run telnet command to test FOCAS port:
telnet [MACHINE-IP] 8193Replace
[MACHINE-IP]with the machine's IP address -
If FOCAS is available:
- Connection will succeed
- You may see a blank screen or connection message
- This indicates FOCAS port 8193 is open
-
If FOCAS is NOT available:
- Connection will fail or timeout
- Error: "Unable to connect" or "Connection refused"
- This indicates FOCAS is not supported
Step 3: Determine Next Steps
If Telnet Test Succeeds:
- Proceed with standard FOCAS configuration
- Follow standard FANUC setup steps
- Add machine in MachineMetrics using FOCAS adapter
If Telnet Test Fails:
- FOCAS is not supported on this machine
- Alternative: Use Digital I/O connectivity instead
- Contact MachineMetrics support for recommended approach
- May need sensors and I/O hardware for data collection
Alternative Connectivity for Roboshot
If FOCAS is not available (most common case):
Recommended: Digital I/O Connectivity
- Install current transducer on hydraulic pump motor
- Capture part eject signal or cycle complete signal
- Use Sealevel or WISE I/O module
- Configure via Modbus TCP
Contact Support:
- Reach out to MachineMetrics support with your Roboshot model
- We can recommend the best connectivity approach
- May have experience with your specific model
Parameter Management
Enabling Parameter Write (PWE)
⚠️ Important Safety Notice: This procedure should only be carried out by qualified maintenance personnel. Proceed with caution.
Prerequisites:
- Machine in MDI mode OR Emergency Stop
- This ensures safety while making parameter changes
Steps to Enable:
-
Access Setting Screen
- Press SETTING function key
- Or: Press function key → [SETTING] soft key
-
Navigate to Parameter Write
- Use cursor keys to highlight PARAMETER WRITE
-
Enable
- Press OPRT soft key
- Press [ON:1] soft key OR enter
1and press INPUT
-
Confirmation
- Alarm SW0100: PARAMETER WRITE ENABLE appears
- This is normal and indicates parameters are editable
Disable When Done:
- Repeat steps and set PARAMETER WRITE = 0
- This clears SW0100 alarm and locks parameters
Key Parameters for FOCAS
Embedded Ethernet Enable/Disable — Parameter 14880
Parameter 14880 controls whether the embedded Ethernet function is active. This is a bit parameter — bit #0 (ETH) is the relevant flag:
| Bit #0 (ETH) | Meaning |
|---|---|
| 0 | Embedded Ethernet used (enabled) |
| 1 | Embedded Ethernet not used (disabled) |
If FOCAS isn't responding even though the IP and port are correct, check that 14880#0 = 0 (i.e., the ETH bit is clear, meaning Ethernet is enabled). A value of 1 disables the embedded Ethernet entirely.
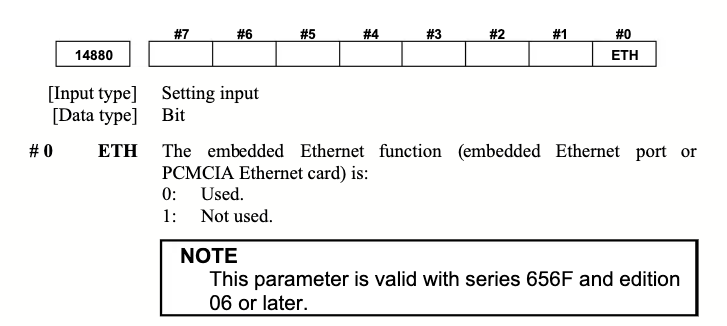
Note: This parameter is valid with series 656F and edition 06 or later.
Embedded Ethernet Port Selection — Parameter 14896 (300is/310is/320is Stand-Alone Only)
On stand-alone type 300is, 310is, and 320is controls, parameter 14896 determines which physical connector is used for the embedded Ethernet port and PCMCIA Ethernet card. Valid range: 0–3.
| Value | Embedded Ethernet Port | PCMCIA Ethernet Card |
|---|---|---|
| 0 | CD38A — port in the CNC (control unit) | Memory card slot on side of display unit |
| 1 | CD38A — port in the CNC (control unit) | Memory card slot in the CNC |
| 2 | CD38S — port on rear of display unit | Memory card slot on side of display unit |
| 3 | CD38S — port on rear of display unit | Memory card slot in the CNC |
In plain terms:
- Values 0 or 1 → plug your Ethernet cable into the CD38A port on the CNC/NCU (inside the electrical cabinet)
- Values 2 or 3 → plug your Ethernet cable into the CD38S port on the rear of the display/HMI unit
If you're not getting a FOCAS connection on a 300-series stand-alone control, check this parameter first — you may be plugged into the wrong physical port.
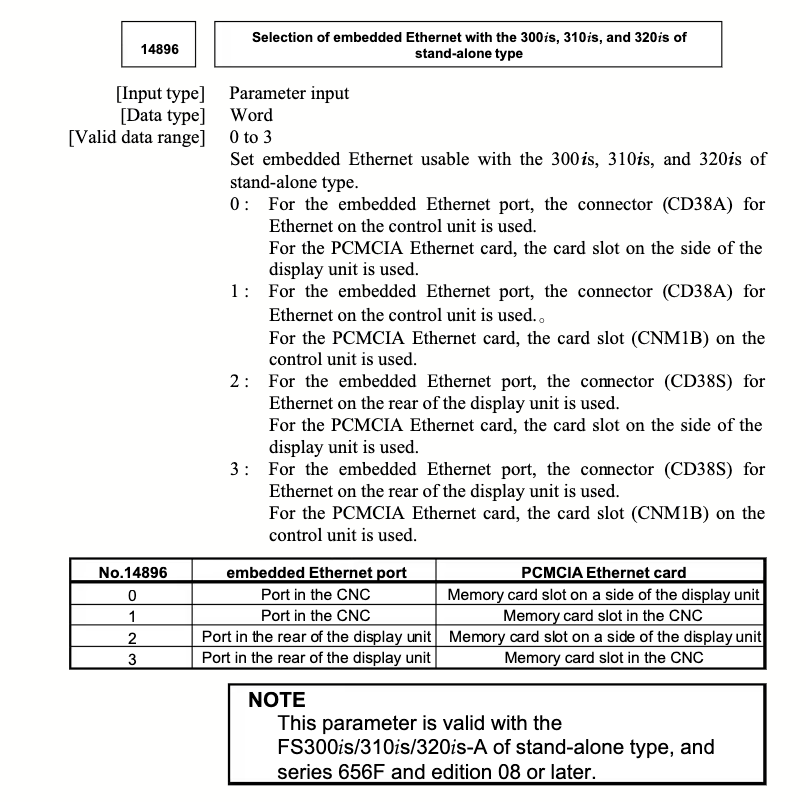
Note: This parameter is valid with the FS300is/310is/320is-A stand-alone type, series 656F and edition 08 or later.
Network Parameters:
- Located in EMBDD or ETHPRM menu
- IP Address, Subnet, Gateway
- FOCAS Port (typically 8193)
Part Counting Parameters:
- 6700#0 (PCM): Part count method (0 or 1)
- 6710: M-code used for part counting
- 6711: Current part count value (read-only)
Common Parameters:
- 3901: System part counter (macro variable)
- Ethernet-related parameters in 200-300 range
Parameter Safety
Before Changing Any Parameter:
- Document current value
- Understand what the parameter does
- Verify parameter isn't used by machine functions
- Have machine manual available
- Contact machine builder if unsure
After Changing Parameters:
- Reboot machine for changes to take effect
- Test thoroughly before production
- Document changes made
- Monitor machine behavior
Never:
- Change parameters you don't understand
- Modify servo or motion-related parameters without expert guidance
- Disable safety-related parameters
- Change parameters during production
Troubleshooting
Connection Issues
Problem: Machine won't connect or test connection fails
Diagnostic Steps:
-
Verify Physical Connection
- Check Ethernet cable is securely plugged in
- Verify cable is not damaged
- Check LED lights on port (should show link/activity)
-
Verify IP Configuration
- Confirm IP address matches what's configured in MachineMetrics
- Ensure machine IP and Edge IP are on same subnet
- Example: Machine 192.168.1.100, Edge 192.168.1.50 ✓
- Example: Machine 192.168.1.100, Edge 192.168.2.50 ✗
-
Test Network Connectivity
- From Edge device or computer on same network
- Ping machine IP address
- If ping fails: network/cable problem
- If ping succeeds but FOCAS fails: protocol issue
-
Verify FOCAS Port
- Check parameter 8193 TCP is configured
- Not 8192, 8194, or other port
- Verify FOCAS2 settings on control
-
Check Embedded Port Selection
- Press SYSTEM → EMBDD → OPRT
- Verify "AVAILABLE DEVICE" = EMBEDDED (not PCMCIA)
- If wrong, press PCMCIA/EMBDD soft key → EXECUTE → Reboot
Pinging from the Control (Testing Network from the CNC)
The FANUC embedded Ethernet maintenance screen lets you send a PING directly from the CNC control to any IP address on the network. This is the most reliable way to confirm whether the control can reach the Edge device — it rules out cable faults, wrong port selection, and misconfigured IPs in one step.
Procedure:
- Press SYSTEM function key
- Press [EMBED PORT] soft key (press the continue key if it isn't visible)
- Press [PING] soft key, then press [(OPRT)]
- To ping a specific IP address, enter the destination address on the PING setting screen (use page keys to switch between the address entry page and the status page)
- Enter a repeat count (e.g., 4)
- Press [PING] — the specified number of PING commands are sent and the result is displayed
- To cancel a ping in progress, press [PING CANCEL]
You can also ping pre-configured FTP destinations directly:
- [PING FTP1] — pings FTP connection destination 1
- [PING FTP2] / [PING FTP3] — pings FTP destinations 2 or 3
Interpreting results:
- Successful replies → the control can reach that IP; if FOCAS still fails, the issue is the port number or protocol configuration
- No reply / timeout → network or cable problem; check the cable, switch, and IP/subnet settings
- If the control can't ping the Edge device but the Edge can ping the control → check for a one-way firewall rule on the Edge device
Checking Communication Status (Packet Errors and Port Activity)
The COM STATE screen shows whether the embedded Ethernet port is actively sending and receiving data and whether errors are accumulating. Use this to detect packet collisions, excessive retransmits, or a dead port.
Procedure:
- Press SYSTEM function key
- Press [EMBED PORT] soft key
- Press [COM STATE] soft key
The screen displays sending and receiving state. Use the page keys to switch between the send state page and the receive state page.
What to look for:
- If counters are incrementing during a known-good connection period → the port is live and passing data
- If send counters are incrementing but receive counters are zero → control is transmitting but nothing is coming back; check Edge-side connectivity
- If error counts are high relative to total frames → network quality issue (bad cable, too much traffic, or the control is on a busy factory network)
Note: FANUC recommends isolating the CNC from the factory-wide network using a router or separate subnet. A high-traffic environment can overload the CNC's communication stack even when no active communication is targeted at it.
Checking Task State (Is FOCAS Running?)
The TASK STATE screen shows whether each embedded Ethernet service is running or waiting. Use this to confirm FOCAS2 is active and hasn't faulted.
Procedure:
- Press SYSTEM function key
- Press [EMBED PORT] soft key
- Press [TASK STATUS] soft key
FOCAS2 #0 states:
| Symbol | Meaning |
|---|---|
C | Waiting for a connection from the host — normal idle state |
W | Data processing in progress (phase 1) |
D | Data processing in progress (phase 2) |
N | FOCAS2 out of service — restart Ethernet or power cycle |
Cis the healthy idle state — the control is listening for a connection on port 8193Nmeans FOCAS2 has stopped; try the [RSTART] soft key (EMBED PORT → COMMON → OPRT → RSTART) to restart the embedded Ethernet without a full power cycle- If RSTART doesn't fix it, power cycle the machine
Viewing the Ethernet Error Log
The embedded Ethernet log screen records every communication error with a timestamp. Check this when a connection drops intermittently or was never established.
Procedure:
- Press SYSTEM function key
- Press [EMBED LOG] soft key (press the continue key if not visible)
- The newest error appears at the top; timestamp format is
MMM.DD hh:mm:ss - Filter by function using soft keys: [ALL], [COMMON], [FOCAS2], [FTP TRANS]
- To clear the log: press [(OPRT)] → [CLEAR]
Common error codes and actions:
| Error | Message | Action |
|---|---|---|
| E-0118 / E-0119 | Error occurred while waiting for FOCAS2 PDU | Cable disconnected, Edge-side software closed connection, or network quality degraded |
| E-011A | All communication paths are busy | Up to 5 FOCAS2 clients can connect — check for other software holding connections |
| E-0A06 | Network is too busy | Too much traffic on the subnet; isolate the CNC on its own switch or VLAN |
| E-0900 / E-0901 | Cannot read MAC address | Hardware fault on the embedded Ethernet port |
| E-0B00 | Own IP address is wrong | IP address format is invalid — re-enter in COMMON screen |
| E-0B01 | Own IP address is not set | No IP address configured — set IP in COMMON screen |
| E-0B02 / E-0B03 | Subnet mask wrong / not set | Configure subnet mask in COMMON screen |
| E-0B04 | Router IP address is wrong | Class mismatch between machine IP and router IP |
| E-0B08 | TCP port number is wrong | Port outside valid range (5001–65535); reset to 8193 |
| E-0B19 | Embedded Ethernet port isn't found | Software or hardware of embedded Ethernet cannot be recognized — check parameter 14880 and verify hardware |
| E-0207 | Router is not found | Router IP is wrong or router is off |
| E-0208 | FTP server is not found | FTP server IP is wrong or server is off (not relevant for FOCAS) |
Alarm SR2032 ("EMBEDDED ETHERNET / DATA SERVER ERROR"): If this alarm appears during communication, open the log screen immediately to read the specific error code and timestamp before the log is overwritten.
No Data Appearing
Problem: Connection succeeds but no data shows in MachineMetrics
Solutions:
-
Wait for Initial Sync
- Allow 5-10 minutes for first data to appear
- Refresh browser/app
-
Check Machine Status
- Verify machine is powered on
- Machine may need to be in AUTO or MDI mode
- Some data only appears when machine is running
-
Verify Data Mapping
- Go to Assets → Machines → [Your Machine] → Data Mapping
- Ensure critical data items are mapped
- Check for unmapped items in available list
-
Review Edge Device Logs
- Settings → Edge Devices → [Your Edge] → Logs
- Look for connection errors or warnings
-
Restart Adapter
- Edit machine configuration
- Save (even without changes) to restart adapter
- Wait a few minutes and check again
Part Count Issues
Problem: Part counts not incrementing or incorrect
⚠️ CRITICAL FIRST STEP: Verify Machine is Counting Parts
Before troubleshooting MachineMetrics configuration, verify the machine itself is incrementing its internal part counter.
MachineMetrics reads the machine's native part counter. If the machine isn't counting parts, MachineMetrics cannot report them. Without additional scripting or configuration, MachineMetrics relies entirely on the machine's internal part count signal.
Check Machine Part Counter:
- Look at the machine's control screen
- Find the part counter display (usually on main screen or program screen)
- Run a cycle or manually execute M30/M02
- Verify the counter increments on the machine itself
If the machine counter is NOT incrementing:
- This is a machine configuration issue, not a MachineMetrics issue
- Machine is not configured to count parts
- See steps below to configure part counting on the machine
If the machine counter IS incrementing but MachineMetrics shows zero:
- This is a MachineMetrics configuration issue
- Continue to diagnostic steps below
Diagnostic Steps:
-
Verify Part Count Method on Machine
- Check parameters 6700 and 6710
- Confirm M-code configuration
- Test manually in MDI (see Testing Part Count section)
-
Check Data Mapping in MachineMetrics
- Ensure part count data item is mapped
- Type should be "Part Count"
- Check both "Actual" and "Target" if using both
-
Verify Program Has Count Command
- Check your CNC program includes M30, M02, or custom M-code
- For looping programs: Ensure count command before M99
-
Test Count Manually on Machine
- Put machine in MDI
- Set overrides to zero
- Execute count command (M30 or your M-code)
- Check parameter 6711 increments on the machine
- If it increments, wait 30 seconds and check MachineMetrics
-
Macro Variable Issues (if using #3901)
- Verify Macro B option is enabled on control
- Check syntax:
#3901=#3901+1 - Ensure macro is configured in adapter
Network Problems
Problem: Intermittent connection or frequent disconnects
Solutions:
-
Check Cable Quality
- Replace Ethernet cable
- Use CAT5e or CAT6 rated cable
- Avoid cables near high-voltage lines or motors
-
Verify Network Stability
- Check for network congestion
- Verify DHCP isn't reassigning IP addresses
- Use static IP instead of DHCP if possible
-
Check Port Sharing
- If using unmanaged switch to share port: Verify switch is powered and working
- Ensure other devices aren't monopolizing bandwidth
-
EMI/RFI Interference
- Machine electrical noise can affect communication
- Use shielded Ethernet cable
- Route cable away from motor drives and high-power equipment
-
Control Restart Issues
- Some controls lose network config on power cycle
- Verify settings persist after restart
- May need to save settings to memory
Third-Party Tool Load Monitoring
Problem: Connection fails or experiences intermittent dropouts when the machine runs third-party tool load monitoring software
Some machines run third-party tool load monitoring or adaptive control software that maintains a persistent FOCAS connection to the control. This can cause connectivity conflicts with MachineMetrics if both systems are trying to use the same Ethernet interface.
Why This Happens:
The embedded Ethernet port (CD38A / CD38S) typically supports only one simultaneous FOCAS connection. If third-party software is already holding that connection, MachineMetrics will fail to connect or experience intermittent dropouts. The Fast Ethernet option board (CD38R), by contrast, supports up to 10 simultaneous connections.
Recommended Approach:
| Scenario | Recommendation |
|---|---|
| Machine has a Fast Ethernet board (CD38R) | Move the third-party tool load monitoring software to the Fast Ethernet board. Use the embedded port for MachineMetrics, or run both on the Fast Ethernet board since it supports multiple connections. |
| Machine only has an embedded port (CD38A/CD38S) | Do not attempt to share the embedded port between MachineMetrics and the third-party software. Use a Digital I/O device for MachineMetrics data collection instead. |
Important: If the third-party software is already running on the embedded port and that is the only Ethernet interface available, adding MachineMetrics to the same port can cause connectivity issues for both systems and may interfere with the third-party software's functionality. In this situation, Digital I/O is the recommended alternative for MachineMetrics connectivity.
Best Practices
Network Configuration:
- Use static IP addresses for machines (not DHCP)
- Document IP addresses for each machine
- Use consistent IP range (e.g., 192.168.1.100-199 for machines)
Part Counting:
- Test part counting thoroughly before production use
- Use M30 for simple parts, #3901=#3901+1 for automation
- Set 6700#0=0 for maximum flexibility
- Verify counts match actual production regularly
Maintenance:
- Check cable connections periodically
- Monitor for adapter errors in Edge logs
- Keep machine controls up to date with latest FANUC software
- Document any parameter changes made
Data Quality:
- Map all relevant data items (not just basics)
- Use descriptive display names for diagnostics
- Configure macro variables for custom data
- Regularly review data accuracy
Security:
- Use dedicated network for machine connectivity
- Limit parameter write access
- Document who has permission to modify machine settings
- Follow lockout/tagout procedures when working on machines
Documentation:
- Record machine IP addresses
- Document custom M-codes used
- Keep notes on any OEM-specific configurations
- Maintain list of parameters changed
Getting Help
Before Contacting Support
Gather this information:
-
Machine Details
- Make, model, serial number
- Control type and version
- FOCAS capability confirmed?
-
Network Configuration
- Machine IP address
- Subnet mask
- Edge device IP
- Are they on same subnet?
-
Configuration
- Screenshots of EMBDD settings
- Parameter 6700 and 6710 values (if part count issue)
- Adapter configuration from MachineMetrics
-
Error Details
- Exact error messages
- When problem started
- What was changed recently
- Screenshots of issue
Contact Options
MachineMetrics Support:
- Email: support@machinemetrics.com
- Include all information listed above
- Attach screenshots
- Describe troubleshooting steps already attempted
Solution Delivery Manager (SDM):
- For configuration guidance
- Best practices consultation
- Deployment planning
FANUC Support:
- For control-specific questions
- Parameter explanations
- Hardware/firmware issues
Machine Tool Builder:
- For OEM-specific configurations
- Custom M-code information
- Machine manual requests
Additional Resources
FOCAS1 vs FOCAS2: What to Expect on Older Controls
FANUC's FOCAS library has two major versions, and the version available on your control directly affects which data items MachineMetrics can collect.
FOCAS Version by Control Model
| FOCAS Version | Control Models |
|---|---|
| FOCAS1 | 0i-A, 0i-B, 0i-C, 16i-A, 18i-A, 21i-A, 15i-A |
| FOCAS2 | 0i-D, 0i-F, 16i-B, 18i-B, 21i-B, 30i, 31i, 32i, 35i |
Note: Some FOCAS1 controls (0i-C, 16i-A, 18i-A, 21i-A, 15i-A/B) can be upgraded by FANUC to include FOCAS2 and/or embedded Ethernet. Contact FANUC with your control serial number to confirm upgrade eligibility.
Key Differences
FOCAS2 significantly expanded the function library over FOCAS1. The MachineMetrics adapter's default data mappings were built against FOCAS2 capabilities, which means certain data points that work on newer controls will come back as UNAVAILABLE or fail silently on FOCAS1 machines.
| Capability | FOCAS1 | FOCAS2 |
|---|---|---|
| Basic machine status (mode, run/idle) | Supported | Supported |
| Program number and name | Supported | Supported |
| Spindle speed and feed rate | Supported | Supported |
| Active alarms | Supported | Supported |
| Part count (parameter 6711) | Supported | Supported |
| Expanded PMC variable ranges | Limited | Full access |
| Multi-path support | Not supported | Supported |
| Extended diagnostic codes | Limited set | Full set (300+) |
| Tool management (P-codes) | Limited | Full access |
| Program directory listing | Not supported | Supported |
| Macro variable extended ranges | Limited (common variables only) | Full range support |
Ready to connect your FANUC machine?
- Verify your control supports FOCAS
- Gather prerequisites
- Follow physical connection steps
- Configure network on the control
- Add machine in MachineMetrics
- Test and verify data flow
Questions? Contact support@machinemetrics.com with your machine details.