Production Order Dashboard Guide
Overview
What is the Production Order Dashboard?
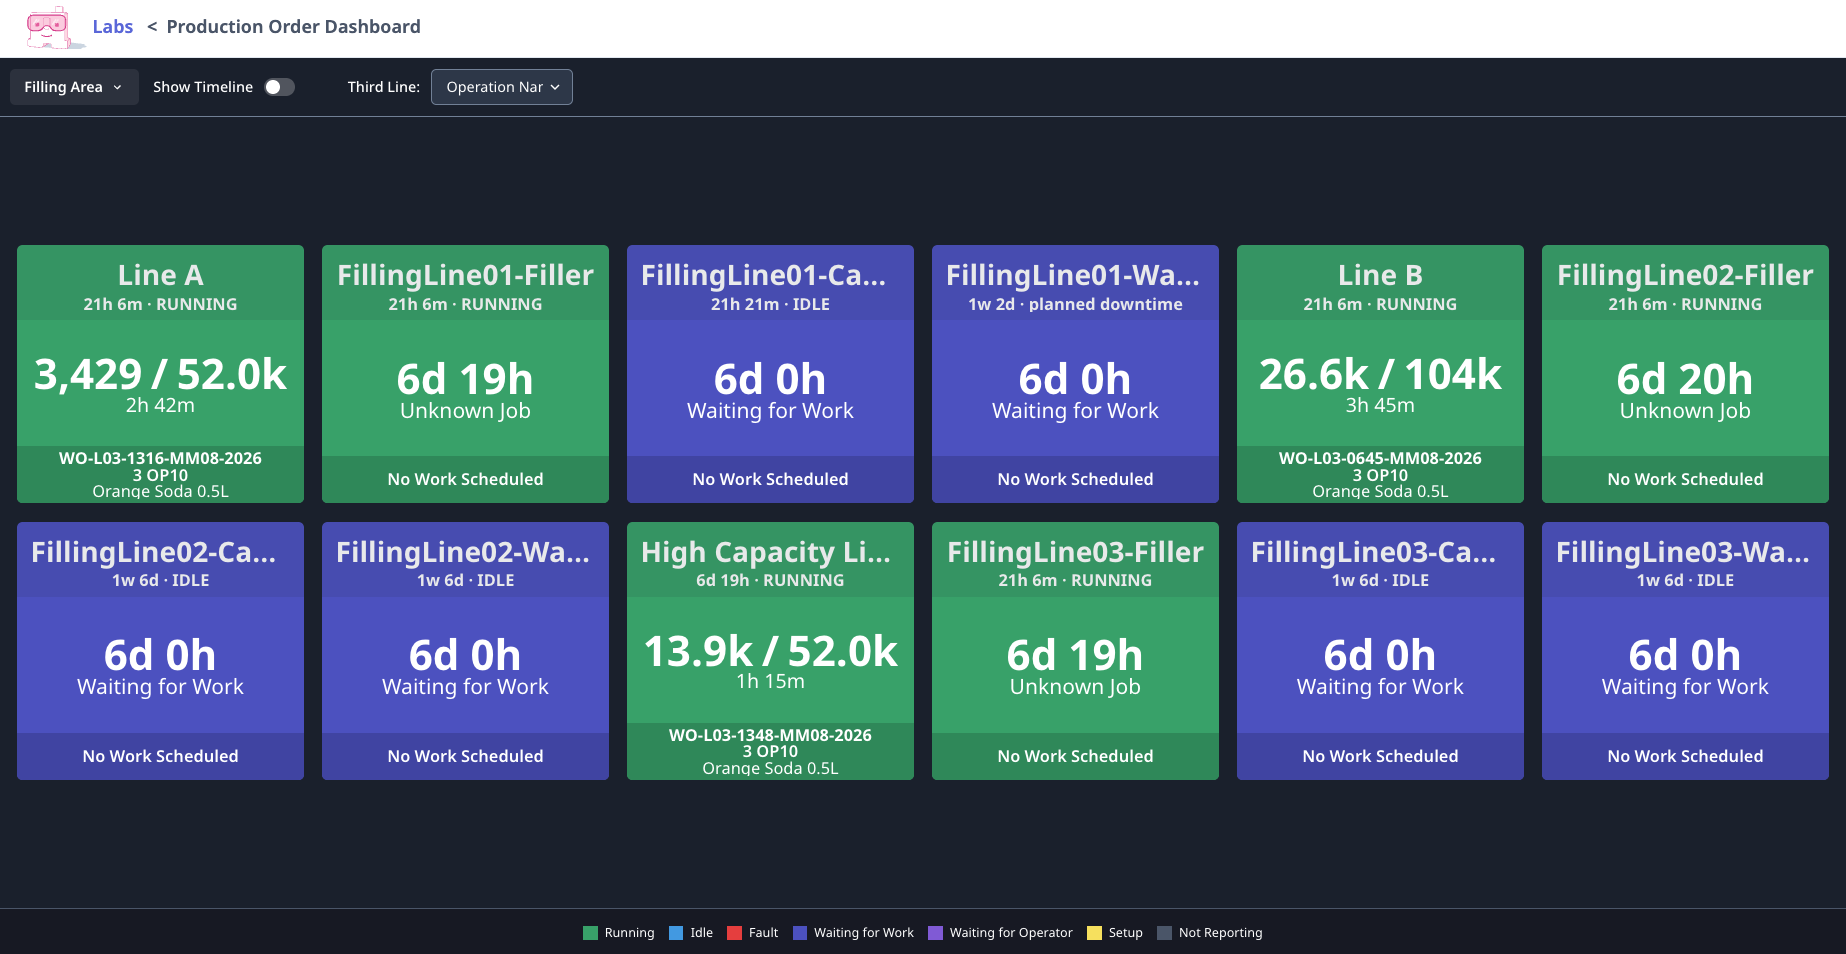
Production Order Dashboard provides real-time visual management of all machines, work orders, and production status in a single, intuitive interface designed for manufacturing visibility.
The Problem:
- Supervisors lack at-a-glance status of all machines on the shop floor
- Production teams have limited visibility into work order progress and parts completion
- Managers can't quickly identify idle machines or equipment issues
- Work order and part information is disconnected from machine status
- Teams lack immediate insight into upcoming jobs and machine sequencing
- Operators and supervisors waste time gathering current state information
The Solution: A visual dashboard that shows:
- All machines with color-coded status tiles
- Real-time part counts vs. target quantities
- Current work order, part number, and operation for each machine
- How long each machine has been in current state
- Next job information for each machine
- Expandable view for shop floor displays
Who Uses Production Order Dashboard:
- Plant Managers: Unified view of production status across shop floor
- Production Supervisors: Quickly identify problem areas and idle equipment
- Schedulers: Track job progress against schedule in real-time
- Machine Operators: Clear indication of current and next job information
- Production Planners: Immediate visibility into machine availability and job progress
- Quality Managers: Direct association between machines, parts, and production orders
Key Features
Machine Status Cards
Color-Coded Status Tiles:
- Green (Running): Machine actively producing parts
- Yellow (Idle): Machine stopped, no alarm
- Red (Fault): Machine in alarm or fault state
- Blue (Setup): Machine in setup or changeover mode
- Gray (Not Reporting): Machine offline or not communicating
Each Card Shows:
- Machine name
- Current status (running, idle, fault, setup)
- Run duration (how long in current state)
- Current work order number
- Part number being produced
- Operation/routing step (e.g., OP10, OP20)
- Parts produced vs. target (e.g., "3,074 / 250")
- Completion percentage (visual progress bar)
Production Counters
Real-Time Part Counts:
- Parts produced (live count from machine)
- Target quantity (from work order)
- Progress bar (visual completion indicator)
- Completion percentage
Update Frequency:
- Updates in real-time as parts complete
- No manual refresh required
- Accurate counts directly from machine controllers
Current Work Details
Displayed for Each Machine:
- Production Order Number: Active work order (e.g., WO-12345)
- Part Number: What's being produced (e.g., WIDGET-100-REV-C)
- Operation: Current operation sequence (e.g., OP10 - Rough Mill)
- Work Order Quantity: Total parts needed for order
- Parts Produced: How many completed so far
- Time in Current Status: How long machine has been running/idle/in fault
Use Cases:
- Quick status checks: "Is Work Order 12345 running?"
- Customer inquiries: "How many parts have we produced for this order?"
- Shift handovers: Incoming shift sees exactly what's running
Run Duration Display
Shows Time Machine Has Been:
- Running (e.g., "Running for 2h 35m")
- Idle (e.g., "Idle for 12m")
- In Fault (e.g., "Fault for 5m")
- In Setup (e.g., "Setup for 18m")
Why It Matters:
- Long idle times → Investigate why machine stopped
- Long fault times → Maintenance needed urgently
- Long setup times → Setup improvement opportunity
Next Job Information
Preview Upcoming Work:
- Next work order number
- Next part number
- Next operation
- Target quantity
- Scheduled start time (if available)
Benefits:
- Operators prepare while current job finishing (gather tools, materials, fixtures)
- Supervisors see machine sequencing at a glance
- Identifies gaps in scheduling (no next job assigned)
Expandable Full-Screen View
Shop Floor Display Mode:
- Click "Expand" icon (top-right)
- Dashboard fills entire screen
- Removes navigation and controls
- Perfect for wall-mounted TVs or large monitors
Use Cases:
- Production office display
- Shop floor visibility boards
- Executive dashboards
- Team meeting screens
Machine Filtering
View Options:
- All Machines: Every connected machine
- Machine Groups: Filter to specific groups (e.g., "CNC Mills", "Lathes", "Grinders")
- Custom Filters: By status (only show Idle or Fault machines)
How to Filter:
- Click "Filter" button (top-left)
- Select machine group or status
- Dashboard updates to show only filtered machines
Accessing the Production Order Dashboard
Navigation:
- Go to Dashboards → Production → Production Order Dashboard
- Or bookmark URL for quick access
Prerequisites:
- Machines connected and reporting status
- Job tracking enabled (for work order and part information)
- ERP integration recommended (for work order details)
Permissions:
- Available to all user roles
- Supervisors, Managers, Executives, IT Admins have full access
- Operators can view (read-only)
Understanding Machine Status Cards
Status Color Meanings
Green - Running ✅
- Machine actively producing parts
- Part count incrementing
- All systems normal
- Action: No immediate action needed, continue monitoring
Yellow - Idle ⚠️
- Machine stopped but no alarm
- Could be:
- Between cycles
- Waiting for operator
- Waiting for material
- Paused
- Action: Investigate if idle >5 minutes
Red - Fault 🔴
- Machine in alarm state
- Production stopped due to error
- Action: Immediate attention required
Blue - Setup 🔵
- Machine in setup/changeover mode
- Not producing, preparing for next job
- Action: Monitor setup time, provide support if excessive
Gray - Not Reporting ⚪
- Machine offline or not communicating
- Data not flowing
- Action: Check connectivity, Edge device status
Progress Bar Interpretation
Visual Indicators:
- Empty bar (0%): Job just started
- Partial bar (1-99%): Job in progress
- Full bar (100%): Job complete or near complete
Color Coding:
- Green bar: On track or ahead
- Yellow bar: Slightly behind (recoverable)
- Red bar: Significantly behind (at risk)
Run Duration Context
Typical Patterns:
Running State:
- Short duration (< 5 min): Just started or between cycles
- Medium duration (5 min - 2 hours): Normal production run
- Long duration (> 2 hours): Long-running job or continuous operation
Idle State:
- Very short (< 1 min): Between cycles, normal
- Short (1-5 min): Operator may be loading/unloading, normal
- Medium (5-15 min): Investigate - why stopped?
- Long (> 15 min): Problem - immediate action needed
Fault State:
- Any duration > 2 min: Problem - maintenance needed
Setup State:
- Short (< 30 min): Normal setup
- Medium (30-60 min): Longer than expected, monitor
- Long (> 60 min): Investigate - excessive setup time
For Supervisors
Morning Shift Start Routine
Use Production Order Dashboard:
1. Quick Status Check (2 minutes)
- Scan dashboard for machine colors
- Identify:
- Any machines in fault (red) → Address immediately
- Any machines idle (yellow) → Investigate
2. Overnight Production Review
- Which jobs ran overnight?
- Any jobs completed?
- Any issues occurred?
3. Plan Today's Priorities
- Which jobs scheduled for today?
- Are machines ready (not in fault, materials staged)?
- Assign operators to priority jobs
4. Shift Handover
- Use dashboard as visual aid for incoming shift
- Point out jobs in progress
- Highlight any issues from previous shift
Throughout Shift Monitoring
Every 30-60 Minutes:
Scan Dashboard:
- Any new faults (red)? → Dispatch maintenance
- Any machines idle >10 min (yellow)? → Investigate
- Any jobs nearing completion (progress bar full)? → Prepare next job
Priority Response:
- Red (Fault) → Immediate response (within 5 min)
- Yellow (Idle >15 min) → Investigate (within 15 min)
- No next job assigned → Schedule next job
Proactive Actions:
- Jobs at 80% complete → Stage materials/tooling for next job
- Setup taking too long → Provide operator support
- Multiple machines idle → Workload balancing issue?
Issue Response Workflow
Fault Condition (Red Card):
- Click machine card → Opens machine detail view
- Check Timeline → See downtime reason (if categorized)
- Check Alarms → What specific alarm is active?
- Dispatch Help:
- Operator assistance
- Maintenance support
- Materials/tooling
- Document → Ensure downtime categorized for tracking
Idle Condition (Yellow Card >15 min):
- Physically check machine → Why stopped?
- Common causes:
- Waiting for material
- Waiting for quality inspection
- Operator on break
- Forgot to start next job
- Resolve → Address root cause
- Prevent → Set up alerts for long idle times
For Production Planners
Capacity Visibility
At-a-Glance Capacity View:
- How many machines are running?
- How many are idle and available?
- How many are in setup?
- How many are down (fault)?
Capacity Calculation:
Available Capacity = (Running + Idle) machines
Utilized Capacity = Running machines
Utilization % = (Running ÷ Total Machines) × 100
Use Cases:
- Can we fit in one more job today?
- Do we have capacity for expedite request?
- Should we schedule overtime?
Job Progress Tracking
Check Multiple Jobs:
- Use search or filter to find specific work orders
- View completion percentage for each
- Identify jobs behind schedule (red progress bars)
- Estimate completion times based on actual rate
Real-Time Production Counts:
- No waiting for end-of-shift reports
- Update customer service immediately
- Adjust downstream scheduling based on actual progress
Jobs at Risk:
- Low completion % with due date approaching
- Frequent faults or long idle times on that machine
- Setup time excessive
- Action: Expedite, add capacity, or adjust schedule
Next Job Visibility
See Machine Sequencing:
- Which machines have next jobs assigned?
- Which machines have gaps (no next job)?
- Fill gaps with available work orders
Preventing Idle Time:
- Assign next jobs before current jobs complete
- Ensure materials staged for next jobs
- Coordinate with scheduling team
For Plant Managers
Daily Production Meetings
Use Dashboard on Meeting Room Screen:
Metrics to Discuss:
- Overall utilization (% of machines running)
- Number of machines in fault
- Jobs completed yesterday
- Jobs in progress today
- On-time delivery status (based on progress)
Visual Impact:
- Team sees real shop floor state
- Color-coded tiles make problems obvious
- No data entry or preparation needed
Action Items:
- Red cards (faults) → Assign owners, set deadlines
- Consistent idle machines → Investigate root causes
- Jobs behind → Expedite actions
Executive Visibility
Walk-Through with Leadership:
- Open dashboard on tablet
- Walk shop floor
- Compare dashboard to physical machines (should match)
- Highlight improvements since last visit
Key Messages:
- "Real-time visibility into production"
- "X% utilization today"
- "Y jobs in progress, Z jobs completed"
Configuration Options
Customizable Third-Line Information
Default Display (Third Line on Card):
- Operation name (e.g., "OP10 - Rough Mill")
Alternative Options:
- Operation description (longer text description)
- Operator name (who's running the job)
- Customer name (who ordered the part)
- Custom field (from ERP)
How to Configure:
- Navigate to Settings → Production Order Dashboard
- Select "Third Line Display" dropdown
- Choose option
- Click "Save"
- Dashboard updates for all users
Timeline Toggle
Timeline View Option:
- Shows machine status history over time
- Horizontal bars for each machine
- Color-coded by status
- Useful for pattern analysis
How to Enable:
- Click "Show Timeline" toggle (top-right)
- Dashboard splits: Cards on left, timeline on right
- Adjust time range (last hour, last shift, last day)
Visual Legend
Status Legend:
- Always visible at top of dashboard
- Color key:
- 🟢 Running
- 🟡 Idle
- 🔴 Fault
- 🔵 Setup
- ⚪ Not Reporting
Can be Hidden:
- Click "Hide Legend" to maximize card space
- Useful once team familiar with color meanings
Refresh Rate
Automatic Updates:
- Dashboard refreshes every 5 seconds (default)
- No manual refresh needed
Configurable:
- Settings → Production Order Dashboard → Refresh Rate
- Options: 5s, 10s, 30s, 60s
- Faster = more real-time, more data usage
- Slower = less data usage, slightly less responsive
Best Practices
For Supervisors
- Keep dashboard open all shift: Reference frequently throughout day
- Respond to faults within 5 minutes: Red cards = immediate action
- Investigate idle >10 minutes: Yellow cards shouldn't linger
- Use for shift handovers: Visual communication tool
- Pair with physical walkdowns: Dashboard + floor checks = complete picture
For Operators
- Check next job preview: Prepare while current job finishing
- Update progress if manual: Ensure counts accurate
- Categorize downtime: Helps supervisors understand issues
- Report alarms: Clear faults promptly
For Planners
- Check dashboard before scheduling: Verify capacity available
- Monitor job progress daily: Update schedules based on actuals
- Assign next jobs proactively: Prevent idle time
- Use data for planning: Historical patterns inform future schedules
For Managers
- Display on shop floor TVs: Increase transparency
- Review in daily meetings: Data-driven discussions
- Track utilization trends: Month-over-month improvements
- Celebrate wins: Recognize high utilization days
Troubleshooting
Machine Status Not Updating
Possible Causes:
- Machine connectivity issue
- Edge device offline
- Browser cache issue
Solutions:
- Check machine Timeline → Are recent data points showing?
- Check Edge device status (Assets → Edge Devices)
- Refresh browser (F5 or Cmd+R)
- Clear browser cache
Work Order Information Missing
Possible Causes:
- Job tracking not enabled
- ERP integration not configured
- Machine not running a job
Solutions:
- Verify job tracking enabled (Settings → Production)
- Check ERP connector status (Settings → Integrations)
- Confirm machine has active job (Production → Jobs)
Part Counts Not Incrementing
Possible Causes:
- Part count not mapped correctly
- Machine not producing parts (in setup or idle)
- Virtual Part Counter warmup period
Solutions:
- Check machine data mapping (Machine Settings → Data Mapping)
- Verify machine in "Running" status
- Wait for VPC warmup if using Virtual Part Counter
Next Job Not Showing
Possible Causes:
- No next job scheduled
- Schedule not synced from ERP
- Current job not linked to schedule
Solutions:
- Check production schedule (Production → Schedule)
- Verify ERP sync status
- Manually assign next job if needed
Related Documentation
- Job Tracking Guide: Real-time job progress tracking
- Production Schedule Intelligence Guide: Dynamic scheduling
- Company Dashboard Guide: High-level metrics
- Operator Dashboard Guide: Tablet interface for operators
Questions? Contact support@machinemetrics.com