Labs & Experimental Features Guide
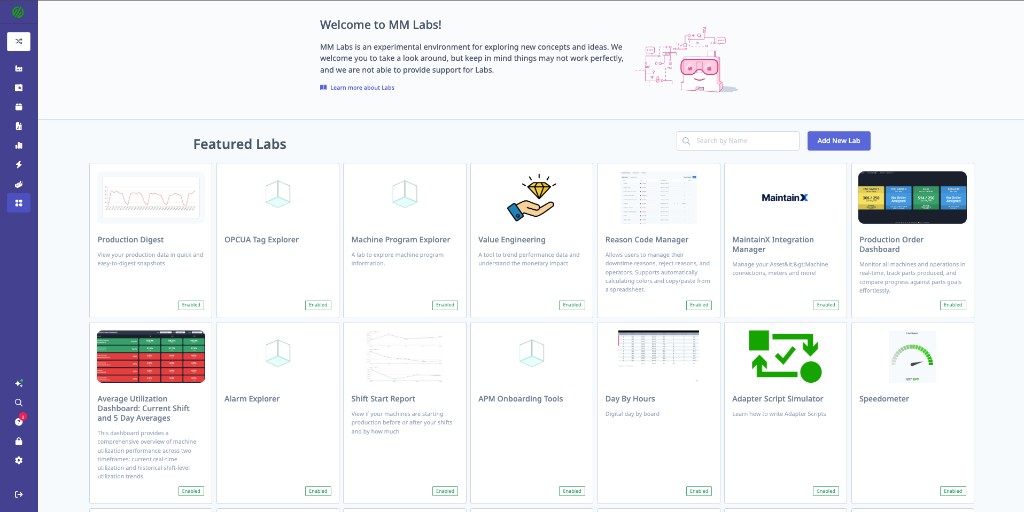
Labs is MachineMetrics' experimental playground — a collection of beta features, trial dashboards, and advanced tools that are in development or testing. Labs gives you early access to new capabilities before they're generally available.
1. What is Labs?
Labs contains features that are:
- Experimental — Still being refined based on user feedback
- Beta — Functional but may have limitations
- Trial — Available for testing before full release
Important Disclaimer
Labs features are experimental and may:
- Change significantly or be discontinued
- Have bugs or unexpected behavior
- Not be fully documented
- Require additional configuration
Use Labs features with the understanding that they are works in progress. Provide feedback to help shape their development.
2. Accessing Labs
From the Main Menu
- Click My Apps in the left navigation
- Select Labs
- Browse available experimental features
Enabling Features
Some Labs features require activation:
- Find the feature in Labs
- Click Enable or Try Now
- Configure initial settings if prompted
- The feature appears in your navigation
3. Available Labs Features
3.1 OPC UA Tag Explorer
Browse and discover OPC UA tags from connected machines without writing adapter scripts.
Use Cases:
- Discover available tags on new machines
- Verify tag paths for adapter script development
- Troubleshoot connectivity issues
- Explore machine capabilities
How to Use:
- Go to Labs → OPC UA Tag Explorer
- Select a machine with OPC UA connectivity
- Browse the tag tree structure
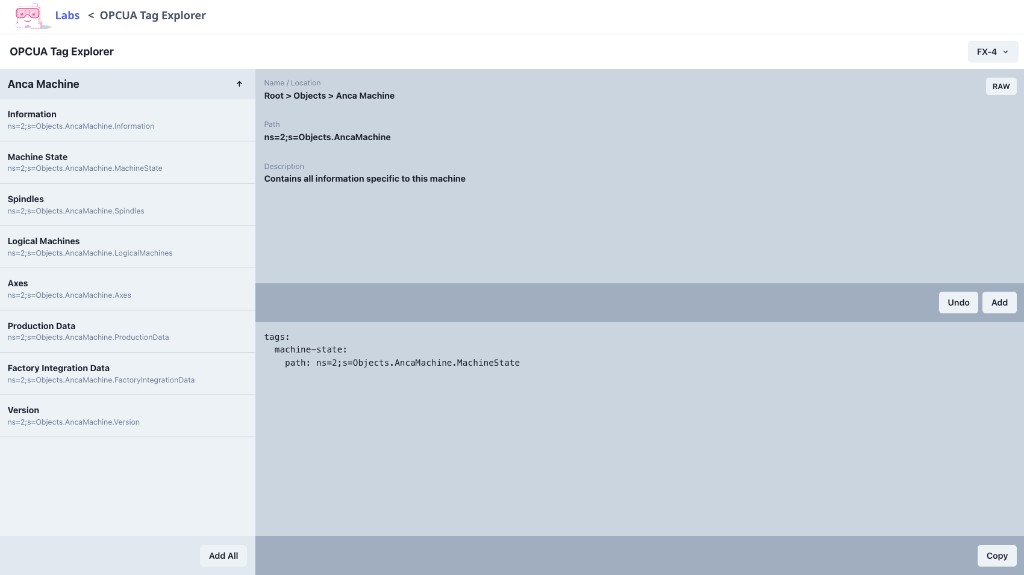 4. Click tags to see:
- Current value
- Data type
- Full node path
- Copy tag paths for use in adapter scripts
Features:
| Feature | Description |
|---|---|
| Tree Navigation | Browse hierarchical tag structure |
| Search | Find tags by name or path |
| Live Values | See real-time tag values |
| Export | Export tag list to CSV |
3.2 Value Engineering Tool
Financial breakdown of machine performance — quantify the cost of downtime, slow cycles, and quality issues.
Use Cases:
- Calculate cost of unplanned downtime
- Justify improvement projects with ROI data
- Identify highest-value optimization opportunities
- Present financial impact to leadership
How to Use:
- Go to Labs → Value Engineering Tool
- Configure financial parameters:
- Hourly machine rate
- Labor costs
- Material costs
- Overhead allocation
- Select date range and machines
- View financial impact analysis
Metrics Provided:
| Metric | Description |
|---|---|
| Cost of Downtime | Dollar value of lost production time |
| Slow Cycle Cost | Impact of cycles slower than expected |
| Quality Cost | Cost of rejected parts |
| Setup Opportunity | Value of reducing setup time |
| Total Opportunity | Sum of all improvement opportunities |
Example Output:
Machine: CNC Mill 3
Period: Last 30 Days

Downtime Cost:         $12,450
Slow Cycle Cost:       $3,200
Quality Cost:          $1,800
Setup Opportunity:     $2,100
─────────────────────────────
Total Opportunity:     $19,550
3.3 MaintainX Integration Manager
Configure and manage the MaintainX integration for work order creation and asset synchronization.
Use Cases:
- Connect MachineMetrics to MaintainX CMMS
- Map machines to MaintainX assets
- Configure automatic work order creation
- Sync machine status with maintenance system
Setup:
- Go to Labs → MaintainX Integration Manager
- Click Connect MaintainX
- Enter MaintainX API credentials
- Map MachineMetrics machines to MaintainX assets
- Configure automation rules
Configuration Options:
| Setting | Description |
|---|---|
| Asset Mapping | Link MM machines to MaintainX assets |
| Auto Work Orders | Create work orders from alarms or conditions |
| Status Sync | Update MaintainX when machine status changes |
| Meter Updates | Push runtime hours to MaintainX meters |
See the MaintainX Integration Guide for detailed setup instructions.
3.4 Production Order Dashboard (Trial)
Visual dashboard for tracking production orders and work-in-progress.
Use Cases:
- Track order progress across machines
- Monitor WIP levels
- Identify bottlenecks in order flow
- View order status at a glance
Features:
| Feature | Description |
|---|---|
| Order Cards | Visual cards showing order status |
| Progress Bars | Completion percentage by order |
| Machine Allocation | See which machines are running which orders |
| Due Date Tracking | Color-coded based on delivery risk |
| Filter & Sort | Filter by customer, priority, status |
How to Access:
- Go to Labs → Production Order Dashboard
- Click Enable Trial
- Dashboard appears in your Dashboards menu
3.5 Utilization Dashboard (Trial)
Enhanced utilization dashboard with drill-down capabilities and comparative views.
Use Cases:
- Deep-dive into utilization metrics
- Compare utilization across machine groups
- Analyze utilization trends over time
- Identify underutilized assets
Features:
| Feature | Description |
|---|---|
| Utilization Heatmap | Visual grid of utilization by machine/time |
| Drill-Down | Click to see breakdown by state |
| Comparisons | Side-by-side machine group comparison |
| Trend Analysis | Historical utilization patterns |
| Export | Download utilization data |
How to Access:
- Go to Labs → Utilization Dashboard
- Click Enable Trial
- Configure default filters and views
3.6 APM Onboarding Tools
Tools to help configure Automatic Production Matching (APM) for new machines.
Use Cases:
- Configure APM for new machine connections
- Test program header parsing
- Validate operation matching rules
- Troubleshoot APM issues
Tools Included:
| Tool | Description |
|---|---|
| Program Header Analyzer | View and parse program headers in real-time |
| Match Rule Tester | Test regex patterns against sample data |
| Operation Mapping Wizard | Step-by-step APM configuration |
| Diagnostic Viewer | See APM decisions and matches |
How to Use:
- Go to Labs → APM Onboarding Tools
- Select the machine to configure
- Use the Program Header Analyzer to view incoming data
- Configure matching rules using the wizard
- Test rules against historical data
- Apply configuration
3.7 Day by Hour Dashboard
Visualize production performance broken down by hour of the day.
Use Cases:
- Identify hourly patterns in performance
- Optimize shift start/end procedures
- Find time-based issues (lunch, breaks, shift changes)
- Compare hourly performance across days
Features:
| Feature | Description |
|---|---|
| Hourly Grid | Performance metrics by hour |
| Day Comparison | Compare same hours across different days |
| Metric Selection | View utilization, OEE, parts, downtime |
| Pattern Detection | Highlights recurring patterns |
How to Access:
- Go to Labs → Day by Hour Dashboard
- Click Enable
- Configure default metrics and date range
3.8 Automatic Document Viewer (Beta)
Automatically display work instructions and setup documents on Operator Dashboards based on job context.
Use Cases:
- Show setup procedures when operations start
- Display quality inspection instructions
- Provide troubleshooting guides for alarms
- Deliver just-in-time training
Requirements:
- Knowledge Hub must be configured
- Documents must be uploaded and tagged
- Rules must be configured in Knowledge Hub
Setup:
- Go to Labs → Automatic Document Viewer
- Click Enable
- Configure delivery rules in Knowledge Hub
- Test on Operator Dashboard
See the Knowledge Hub Guide for detailed configuration.
3.9 Auto Reject Rules
Automatically map reject data items from your machines to specific reject reasons, eliminating manual reject categorization and enabling real-time quality tracking.
Use Cases:
- Automatically categorize rejects based on machine signals
- Track quality issues without operator input
- Link machine reject counters to specific defect categories
- Enable automatic reject tracking for high-speed production
How It Works:
Auto Reject Rules creates a mapping between:
- Data items from your machine (configured as reject/part count types)
- Reject reasons defined in System Settings
When the machine increments a reject data item, MachineMetrics automatically records a reject with the mapped reason.
Prerequisites:
Before configuring Auto Reject Rules, you must:
-
Configure Reject Reasons in System Settings:
- Go to Settings → System Settings → Reject Reasons
- Create reject reason categories (e.g., "Wrinkles", "Ribbon Length", "Slit Width")
- These reasons appear as mapping options in Auto Reject Rules
-
Configure Machine Data Items:
- Machine must have data items configured for reject tracking
- Data items must be mapped as reject counters in Machine Settings
- Can be from direct machine connection or adapter scripts (using
declare-keys)
Example Adapter Script for Reject Tracking:
For MTConnect/PLC data with reject codes:
version: 2

# Pull reject data from parent adapter
declare-keys:
  - part_quality_status
  - reject_code

# Create auto-reject variable
variables:
  auto-reject:
    - source: part_quality_status
    - expression: this == "REJECT"
    - count

# Output for Auto Reject Rules mapping
data-items:
  - auto-reject
Setup:
- Go to Labs → Auto Reject Rules
- Click Enable if not already active
- You'll see the Part reject mapper table with columns:
- MACHINE: Select the machine
- DATA ITEM: Select the reject data item (from machine data mapping)
- REASON: Select the reject reason (from System Settings)
Configuration Example:
| Machine | Data Item | Reason |
|---|---|---|
| Packaging Automation | Flexy-System-BadParts | Slitting | CNS13_Wrinkles - Slitting |
| Slitting Automation 1 | Bad-Parts | Slitting | NS-RL_NC Slitting Ribbon Length |
| Slitting Automation 2 | Bad-Parts | Slitting | NS-SC_NC Slitting - Splice Config |
| Slitting Automation 3 | Bad-Parts | Slitting | NS-SW_NC Slitting - Slit Width |
How to Configure:
-
Add Mapping Row:
- Click "+" or "Add" to create a new mapping
-
Select Machine:
- Choose the machine from the dropdown
- Only machines with reject data items appear
-
Select Data Item:
- Choose the data item that represents the reject counter
- Only data items configured as reject/part counts appear
- These come from Machine Settings → Data Mapping
-
Select Reject Reason:
- Choose the appropriate reject reason
- Only reasons configured in System Settings appear
- Reasons can include categories (e.g., "Slitting | Wrinkles")
-
Save:
- Click Save at the bottom of the page
- Mappings take effect immediately
What Happens:
Once configured:
- Machine increments the reject data item (e.g.,
Bad-Partsgoes from 5 → 6) - MachineMetrics detects the increment
- System automatically creates a reject event with the mapped reason
- Reject appears in quality reports with the correct categorization
- No operator input required
Benefits:
| Benefit | Description |
|---|---|
| Automatic Tracking | Rejects recorded without operator intervention |
| Real-Time Quality Data | Immediate visibility into quality issues |
| Accurate Categorization | Machine signals map directly to defect types |
| High-Speed Compatible | Works for fast production lines where manual entry isn't feasible |
| Consistent Data | Eliminates operator variability in reject categorization |
Workflow Integration:
[Machine detects defect]
        ↓
[Increments reject data item]
        ↓
[Auto Reject Rules detects change]
        ↓
[Maps to configured reject reason]
        ↓
[Creates reject event in MachineMetrics]
        ↓
[Appears in Quality Reports]
Troubleshooting:
| Issue | Solution |
|---|---|
| Data item not appearing | Verify data item is mapped as reject count in Machine Settings → Data Mapping |
| Reject reason not appearing | Create reject reason in Settings → System Settings → Reject Reasons |
| Rejects not recording | Check machine connectivity and data item values in Machine Timeline |
| Wrong reason mapping | Edit the mapping in Auto Reject Rules and save |
Advanced Configuration:
For complex scenarios with multiple reject types from one machine:
-
Use Adapter Scripts:
- Create separate
declare-keysfor each reject type - Use variables to categorize rejects based on codes
- Output multiple reject data items
- Create separate
-
Multiple Mappings:
- One machine can have multiple data items
- Each data item maps to a different reject reason
- Example:
wrinkle_count→ "Wrinkles",length_errors→ "Ribbon Length"
Example Multi-Reject Adapter Script:
version: 2

# Pull multiple reject signals
declare-keys:
  - reject_code
  - part_quality_status

# Create separate reject counters per defect type
variables:
  wrinkle_rejects:
    - source: reject_code == "WRINKLE" and part_quality_status == "REJECT"
    - count

  length_rejects:
    - source: reject_code == "LENGTH" and part_quality_status == "REJECT"
    - count

  width_rejects:
    - source: reject_code == "WIDTH" and part_quality_status == "REJECT"
    - count

# Output all reject types
data-items:
  - wrinkle_rejects
  - length_rejects
  - width_rejects
Then map each in Auto Reject Rules:
wrinkle_rejects→ "Wrinkles"length_rejects→ "Ribbon Length"width_rejects→ "Slit Width"
Important Notes:
- Do NOT contact support for Auto Reject Rules configuration — all configuration is self-service through Labs
- Ensure reject reasons exist in System Settings BEFORE configuring mappings
- Data items must be properly mapped in Machine Settings for them to appear
- Changes take effect immediately upon saving
- Review Quality Reports to verify rejects are being captured correctly
4. Requesting New Features
Feature requests do not exist as a self-service form inside Labs. To request a new feature or ask about a specific Labs feature, reach out through one of the following:
- Solution Delivery Manager (SDM): Your SDM is the best first contact for feature requests during or after onboarding
- Support Desk: Email support@machinemetrics.com with a description of what you need and your use case
- Account Executive: Contact your AE for requests tied to roadmap discussions or commercial considerations
When submitting a request, the more context you provide — including what problem you are trying to solve and how you would use the feature — the more useful it is for the team.
5. Providing Feedback
Labs features improve based on user feedback. To share feedback on an existing Labs feature:
- Support Desk: Email support@machinemetrics.com with a description of your experience, any issues encountered, and suggested improvements
- Solution Delivery Manager (SDM): Raise feedback directly with your SDM if you are in an active onboarding or engagement
What to Include
| Information | Why It Helps |
|---|---|
| Steps to reproduce | Helps engineers find issues |
| Expected vs. actual behavior | Clarifies the problem |
| Screenshots | Visual evidence of issues |
| Browser/device info | Identifies compatibility issues |
| Use case description | Helps prioritize improvements |
6. Labs FAQ
Are Labs features free?
Most Labs features are included in your subscription. Some advanced features may require additional licensing — check with your account manager.
Will Labs features become permanent?
Successful Labs features typically graduate to general availability. Some features may be discontinued based on usage and feedback.
Can I use Labs features in production?
Labs features are functional but may have limitations. Use them in production with caution and have fallback processes in place.
How do I report a bug?
Contact support@machinemetrics.com with detailed reproduction steps and screenshots.
Can I request access to specific Labs features?
Yes. Contact your Solution Delivery Manager (SDM), the support desk at support@machinemetrics.com, or your Account Executive.
7. Current Labs Status
| Feature | Status | Notes |
|---|---|---|
| OPC UA Tag Explorer | Available | Generally stable |
| Value Engineering Tool | Available | Financial analysis |
| MaintainX Integration Manager | Available | Requires MaintainX account |
| Production Order Dashboard | Trial | ERP integration recommended |
| Utilization Dashboard | Trial | Enhanced analytics |
| APM Onboarding Tools | Available | For new machine setup |
| Day by Hour Dashboard | Available | Hourly analysis |
| Automatic Document Viewer | Beta | Requires Knowledge Hub |
| Auto Reject Rules | Available | Maps machine reject data to quality reasons |
Related Articles
- Knowledge Hub Guide — Document management for Automatic Document Viewer
- Machine Settings Guide — APM configuration
- Third-Party Integrations — MaintainX setup
- Dashboards Guide — Trial dashboard usage
Getting Help
- Support Desk: Email support@machinemetrics.com for bugs, feedback, or feature access requests
- Solution Delivery Manager (SDM): Your SDM for feature requests and feedback during or after onboarding
- Account Executive: Contact your AE for roadmap and commercial discussions