Max AI Guide
Max AI is MachineMetrics' agentic intelligence layer — a team of role-based digital agents built to interpret, adapt, and execute production tasks every day. Max connects real-time data from machines, ERP systems, and tribal knowledge to deliver foresight and guidance that aligns teams, preserves expertise, and drives performance.
1. What is Max AI?
Max AI addresses the execution gap — the disconnect between production plans and shop floor reality. While plans assume smooth operations, the reality includes machine breakdowns, long setups, late materials, and tribal knowledge that overrides system logic.
Max AI bridges this gap by:
- Connecting real-time data from machines, ERP, and documentation
- Unifying data into a structured model AI can understand
- Acting through role-based agents that guide and automate work
Key Capabilities
| Capability | Description |
|---|---|
| Chat with Your Data | Ask questions in natural language and get instant answers from real-time data, ERP records, and tribal knowledge |
| Instant Visuals | Generate reports, charts, and downtime breakdowns on demand — no manual building required |
| Agentic Workflows | Automate routine decisions like flagging late jobs, rescheduling work, and updating ERP cycle times |
2. Accessing Max AI
From Any Page
- Click the Max AI icon in the navigation bar (typically bottom-right or top-right)
- The Max AI chat panel opens
- Type your question or request
Keyboard Shortcut
- Press
Ctrl + K(Windows) orCmd + K(Mac) to open Max AI from anywhere in the platform
3. AI Agents
Max AI provides specialized agents for different roles and tasks. Each agent is optimized for specific workflows.
3.1 Continuous Improvement Agent (Available)
Your CI team that never sleeps — powered by Lean/Six Sigma methodologies.
Capabilities:
| Feature | Description |
|---|---|
| Surface Bottlenecks | Identify production bottlenecks in real-time |
| Setup Analysis | Analyze setup time trends and variations |
| Delivery Prediction | Monitor delivery performance and predict risks |
| Shift Comparisons | Generate shift performance comparisons |
Methodologies Used:
- Pareto Analysis — Identify the vital few causes of problems
- 5 Whys — Root cause analysis for recurring issues
- SMED — Single-Minute Exchange of Die for setup reduction
- SPC — Statistical Process Control for quality monitoring
Example Prompts:
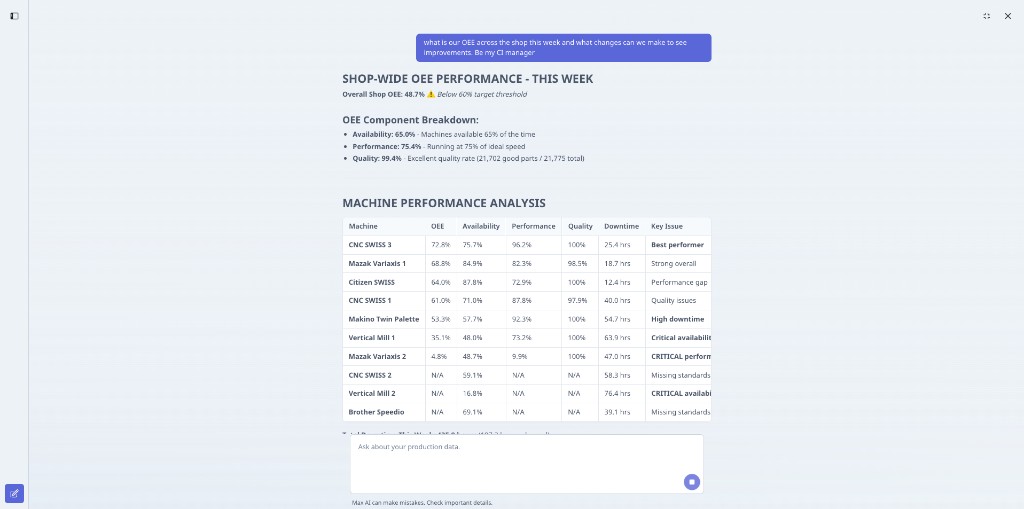
"What are the top 5 causes of downtime this week?"
"Show me setup time trends for CNC Mill 3 over the last month"
"Which jobs are at risk of being late?"
"Compare shift performance for the past 7 days"
"What's causing the longest cycle times on operation 12345?"
3.2 Operator Assistance Agent (Coming Soon)
AI-driven guidance for the frontline — helping operators start every shift ready.
Planned Capabilities:
| Feature | Description |
|---|---|
| Auto Handover Briefs | Start each shift with status, jobs, and priority issues |
| Instant Doc Access | Setup instructions, work orders, and specs surface by job phase |
| AI Troubleshooting | Get help from Knowledge Hub content and historical feedback |
3.3 Production Management Agent (Coming Soon)
Generate insights, not more data — for supervisors and production managers.
Planned Capabilities:
| Feature | Description |
|---|---|
| Tribal Knowledge | Capture and surface SOPs, notes, and expertise when it matters |
| Proactive Alerts | Flag risks, delays, and quality concerns in real time |
| Production Visibility | Monitor jobs, machines, and schedule health across the floor |
3.4 Shop Floor Scheduling Agent (Coming Soon)
Adjust the schedule in real-time — keeping production on track.
Planned Capabilities:
| Feature | Description |
|---|---|
| At-Risk Job Flagging | Identify jobs before they're late |
| Auto ERP Updates | Update cycle times in ERP from actual production data |
| Schedule Health | Surface schedule health across your floor |
| Capacity Exposure | Reveal hidden capacity across all resources |
3.5 Onboarding Agent (Coming Soon)
Get up and running faster — for new users and new implementations.
Planned Capabilities:
| Feature | Description |
|---|---|
| AI-Guided Setup | Connect machines and ERP with step-by-step contextual guidance |
| Role-Based Walkthroughs | Onboarding adapts to your role, showing only what's relevant |
| Smart Configuration | Recommendations for best dashboards and workflows |
4. Chat with Your Data
Max AI understands both the question and the context. Whether you're on the floor or in a meeting, get instant answers pulled from real-time data, ERP records, and tribal knowledge.
How It Works
- Ask a Question — Type in natural language
- Max Interprets — Understands intent and context
- Data Retrieved — Pulls from machines, ERP, Knowledge Hub
- Answer Delivered — Clear response with supporting data
Question Types
Production Questions:
"What's the current utilization across all machines?"
"How many parts did we make yesterday?"
"Which machines are currently down?"
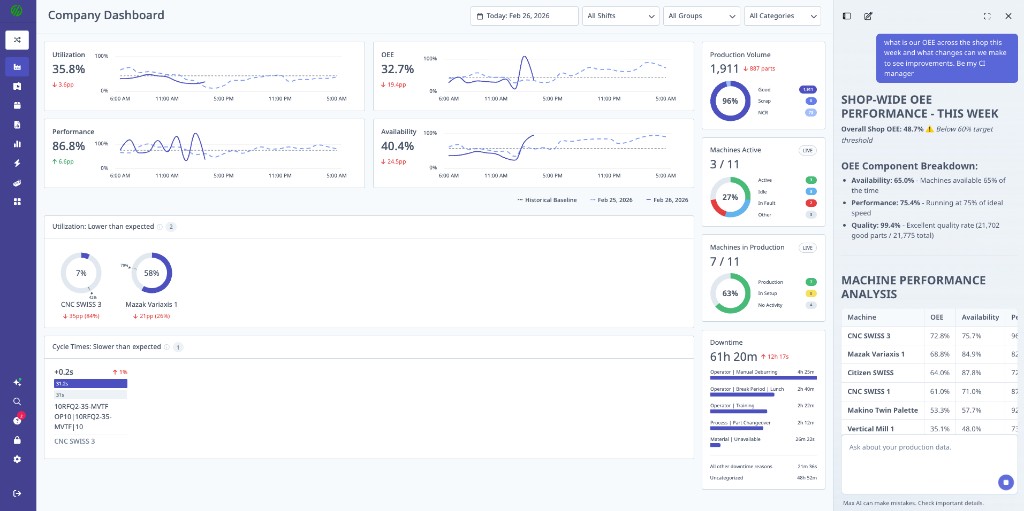
"What's the OEE for Mill 5 this week?"
Analysis Questions:
"Why did OEE drop on Tuesday?"
"What's causing scrap on operation 7890?"
"Show me the trend of downtime for the past 30 days"
"Compare performance between first and second shift"
Guidance Questions:
"How do I set up a new workflow automation?"
"What's the best way to configure cycle time goals?"
"How do I add a widget to my dashboard?"
Tips for Better Results
| Do | Don't |
|---|---|
| Be specific about time ranges | Use vague timeframes |
| Name specific machines or operations | Assume Max knows what you're looking at |
| Ask one question at a time | Combine multiple unrelated questions |
| Include context (shift, machine group) | Leave out relevant filters |
Good Example:
"What were the top 3 downtime reasons for CNC Cell A during first shift last week?"
Less Effective:
"Why is downtime bad?"
5. Instant Visuals
Need a shift summary or downtime breakdown? Just ask. Max AI builds reports in seconds, complete with visuals, trends, and root cause insights.
Generating Charts and Reports
Example Requests:
"Create a downtime Pareto for this week"
"Show me a utilization trend chart for the past month"
"Generate a shift comparison report for yesterday"
"Build an OEE breakdown chart for Mill 3"
Chart Types Available
| Chart Type | Best For |
|---|---|
| Pareto | Identifying top contributors (downtime, rejects) |
| Trend Line | Showing changes over time |
| Bar Chart | Comparing categories or groups |
| Pie/Donut | Showing proportions |
| Table | Detailed data with multiple columns |
Adding Charts to Dashboards
- Generate a chart using Max AI
- Click Add to Dashboard on the generated visual
- Select the target dashboard
- Choose position and size
- Click Save
The chart becomes a live widget that updates automatically.
6. Agentic Workflows
Max AI handles routine decisions automatically — giving your team time back to focus on what matters most.
Automated Actions
| Action | Description |
|---|---|
| Flag Late Jobs | Automatically identify jobs at risk of missing delivery |
| Reschedule Work | Suggest or execute schedule adjustments based on real-time status |
| Update ERP | Push actual cycle times back to ERP systems |
| Send Alerts | Trigger notifications when thresholds are exceeded |
Configuring Agentic Workflows
- Go to Automations in the main menu
- Click Create Workflow
- Select a trigger (e.g., "Job at risk of being late")
- Define the action (e.g., "Notify supervisor", "Update priority")
- Set conditions and filters
- Enable the workflow
Example Workflow: Late Job Alert
Trigger: Job estimated completion exceeds due date Condition: Job priority is "High" or "Critical" Action: Send notification to Production Manager with job details and recommended actions
7. Data Sources
Max AI gets its intelligence from three key data sources:
7.1 Machine Data
Real-time performance from any equipment — old, new, CNC, or manual.
- Cycle times and part counts
- Machine states (running, idle, down)
- Alarms and conditions
- Spindle loads and feed rates
7.2 ERP Integration
Work orders, routings, and schedules sync directly with ERP.
- Job information and due dates
- Planned vs. actual quantities
- Routing and operation details
- Customer and order context
7.3 Knowledge Hub
Tribal knowledge captured and made searchable.
- SOPs and work instructions
- Setup procedures
- Troubleshooting guides
- Best practices and notes
See the Knowledge Hub Guide for details on uploading and managing documentation.
8. Common Use Cases
Daily Shift Handover
"Give me a shift handover summary for second shift"
Max provides:
- Jobs completed vs. planned
- Current machine status
- Open issues and alerts
- Priority items for next shift
Root Cause Analysis
"Why did utilization drop on Thursday?"
Max analyzes:
- Downtime events and durations
- Alarm patterns
- Setup time anomalies
- Provides ranked contributing factors
Performance Tracking
"How are we tracking against our monthly OEE goal?"
Max shows:
- Current OEE vs. target
- Trend over the month
- Gap analysis
- Recommendations for improvement
Troubleshooting
"Machine 7 keeps throwing alarm 1234, what should I check?"
Max searches Knowledge Hub for:
- Previous occurrences
- Resolution steps
- Related documentation
- Expert recommendations
9. Best Practices
Getting Started
- Start with questions you already know the answer to — Verify Max's accuracy
- Explore different question types — Production, analysis, guidance
- Use specific context — Machine names, date ranges, shifts
- Review and validate — Max is a tool to augment, not replace, expertise
Building Trust
- Compare Max's answers against reports you've built manually
- Use Max for quick lookups, then dive deeper when needed
- Provide feedback when answers aren't helpful
Team Adoption
- Share useful prompts with colleagues
- Create a "prompt library" for common questions
- Train operators on basic Max AI usage
- Encourage feedback to improve results
10. Troubleshooting
Max Doesn't Understand My Question
- Rephrase using simpler language
- Break complex questions into smaller parts
- Include specific machine or operation names
- Add time context (today, this week, last month)
Data Seems Incorrect
- Verify the time range Max is using
- Check if filters are applied correctly
- Confirm machine names match exactly
- Review data mapping in Machine Settings
Charts Won't Generate
- Ensure you have data for the requested time period
- Check permissions for the machines/operations requested
- Try a simpler chart type first
Knowledge Hub Content Not Found
- Verify documents are uploaded and indexed
- Check document tags and categories
- Use exact terminology from uploaded documents
11. Privacy and Security
Data Handling
- Max AI runs on AWS Bedrock within MachineMetrics' private AWS tenant
- Customer data is never used for training AI models
- All queries are processed in isolated environments
- Data remains within your MachineMetrics account
Access Control
- Max AI respects existing role-based permissions
- Users only see data they have access to
- Audit logs track AI interactions
Fairness and Responsible AI
If you observe any AI-generated output that appears to reflect unfair treatment, bias, or discrimination, please contact MachineMetrics Support.
Related Articles
- Knowledge Hub Guide — Upload and manage documentation
- Automations & Workflows Guide — Configure automated actions
- Dashboards Guide — Add Max AI charts to dashboards
- Understanding Your Data — OEE, OOE, TEEP explained
Getting Help
- In-App: Click the help icon or ask Max AI "How do I get support?"
- Support Portal: Visit the MachineMetrics Support Portal
- Documentation: Browse the full documentation library