Schedule Attainment Guide
Overview
What is Schedule Attainment?
Schedule Attainment Dashboard provides a clear, data-driven view of how well actual production execution matches the planned schedule, enabling better decisions and continuous improvement of scheduling accuracy.
The Problem:
- Manufacturing planners struggle to track how well production matches scheduled expectations
- Without clear visibility into schedule adherence, on-time delivery suffers
- Customer commitments are missed
- No accountability for schedule performance
- Inability to quantify scheduling effectiveness
The Solution: A visual dashboard that:
- Shows overall attainment percentage across all work orders
- Compares scheduled vs. actual start and end times side-by-side
- Tracks on-time starts and on-time completions separately
- Identifies which work orders are falling behind
- Reveals patterns in schedule slippage
Who Uses Schedule Attainment:
- Production Planners: Identify why schedules aren't being met, improve planning accuracy
- Operations Managers: Improve on-time delivery performance, identify bottlenecks
- Plant Managers: Measure scheduling effectiveness with benchmarkable KPI
- Customer Service: Provide realistic delivery estimates based on actual progress
- Continuous Improvement Leads: Identify which processes need attention
Key Features
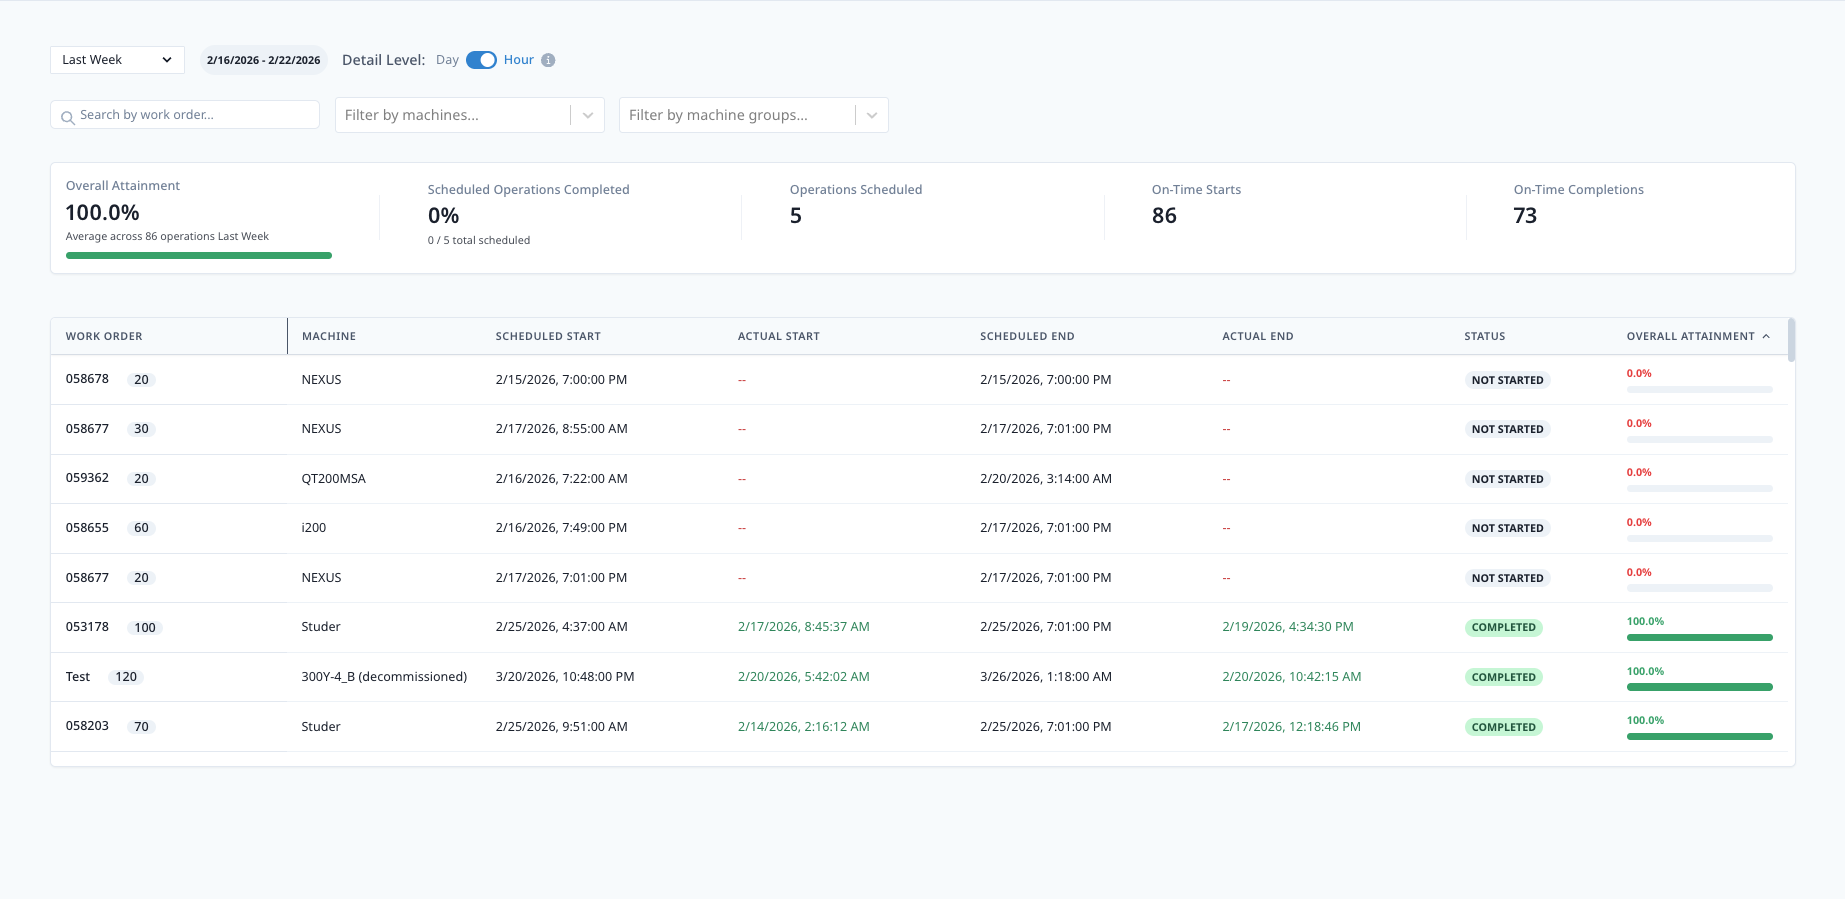
Overall Attainment Metrics
Schedule Attainment Percentage:
- Clear percentage showing how well actual execution matches plan
- Calculated across all work orders in selected time period
- Benchmarkable KPI for performance tracking
- Color-coded indicator (Green ≥90%, Yellow 70-89%, Red <70%)
Breakdown Metrics:
- On-Time Starts %: Percentage of jobs that started on schedule
- On-Time Completions %: Percentage of jobs that finished on schedule
- Total Operations Completed: Count of finished operations
- Average Variance: How far off schedule (in hours/minutes)
Dual-View Options
Day-Level View:
- Groups attainment by day
- Shows daily trends over time
- Useful for identifying problem days (e.g., Mondays consistently poor)
- Easier to spot weekly patterns
Hour-Level View:
- Groups attainment by hour of day
- Shows within-shift performance
- Useful for identifying problem hours (e.g., end of shift rush)
- Requires shorter date ranges (1 week maximum)
Side-by-Side Comparison
For Each Work Order:
| Work Order | Scheduled Start | Actual Start | Scheduled End | Actual End | Status |
|---|---|---|---|---|---|
| WO-12345 | 8:00 AM | 8:15 AM | 10:00 AM | 11:30 AM | ⚠️ Late |
| WO-12346 | 10:00 AM | 10:00 AM | 12:00 PM | 11:45 PM | ✅ Early |
| WO-12347 | 1:00 PM | 2:30 PM | 3:00 PM | In Progress | 🔴 Behind |
Color Coding:
- ✅ Green: On time or ahead
- ⚠️ Yellow: Slightly late (within tolerance)
- 🔴 Red: Significantly late
Operations Tracking
Metrics Displayed:
- Total Operations: Planned operations in time period
- Completed Operations: Finished operations
- In Progress Operations: Currently running
- Not Started Operations: Scheduled but not begun
- Completion Rate: Completed ÷ Total (percentage)
Flexible Date Filtering
Pre-Set Filters:
- Today
- Yesterday
- Last 7 Days
- Last 30 Days
- This Month
- Last Month
Custom Date Range:
- Select any start and end date
- Useful for analyzing specific periods (e.g., after process change)
Shift Filtering:
- View attainment by specific shift
- Compare first vs. second vs. third shift
- Identify shift-specific performance issues
Work Order Searchability
Quick Search:
- Search by work order number
- Search by part number
- Search by machine
- Search by operator
Use Cases:
- Customer inquiry: "What's the status of order WO-12345?"
- Quality issue: "When was lot L5678 produced?"
- Performance analysis: "How does Machine 5 perform on Part ABC?"
Accessing the Schedule Attainment Dashboard
Navigation:
- Go to Dashboards → Production → Schedule Attainment
- Or access via Production Schedule view → "View Attainment" link
Prerequisites:
- Production Schedule Intelligence (PSI) module enabled
- ERP integration configured
- Work orders imported with scheduled start/end times
- Actual production data captured via job tracking
Permissions:
- Manager or Executive role required
Understanding the Dashboard
Dashboard Layout
Top Section: Summary Metrics
- Overall Attainment %: Large, prominent display
- On-Time Starts %: Secondary metric
- On-Time Completions %: Secondary metric
- Total Operations: Count for context
Middle Section: Trend Chart
- Line or bar chart showing attainment over time
- X-axis: Time (days or hours)
- Y-axis: Attainment percentage
- Target line at 90% (or configured target)
- Hover for detailed breakdown
Bottom Section: Work Order List
- Detailed table of all work orders
- Sortable columns (click header to sort)
- Color-coded status indicators
- Expandable rows for operation details
Interpreting Attainment Percentage
Calculation:
Schedule Attainment % = (On-Time Operations ÷ Total Operations) × 100

Where "On-Time" = Started and completed within scheduled time window
Tolerance Settings:
- On-Time: Within ±15 minutes of scheduled time (default, configurable)
- Slightly Late: 16-60 minutes late
- Significantly Late: >60 minutes late
Example:
Total Operations: 100
Started/Completed On-Time: 75
Slightly Late: 15
Significantly Late: 10

Schedule Attainment: 75%
Performance Levels:
- 90-100%: Excellent (world-class)
- 80-89%: Good (typical high-performing)
- 70-79%: Fair (needs improvement)
- <70%: Poor (immediate action required)
Understanding Variances
Positive Variance:
- Job finished before scheduled end time
- Indicates:
- Efficient execution
- Or pessimistic scheduling (cycle time estimate too high)
Negative Variance:
- Job finished after scheduled end time
- Indicates:
- Downtime or delays
- Or optimistic scheduling (cycle time estimate too low)
Analyzing Patterns:
- Consistent positive variance: Update cycle time standards (reduce)
- Consistent negative variance: Investigate delays or update standards (increase)
- High variability: Process inconsistency, needs standardization
For Production Planners
Identifying Planning Issues
Patterns to Watch:
1. Consistent Start Delays
- Jobs rarely start on time
- Possible causes:
- Operators overwhelmed with too many jobs
- Setup time underestimated
- Materials not available when scheduled
- Previous job overruns delaying next job
2. Consistent Completion Delays
- Jobs frequently run late
- Possible causes:
- Cycle time estimates too optimistic
- Downtime not accounted for in schedule
- Quality issues causing rework
- Setup time longer than expected
3. Specific Machines with Poor Attainment
- One machine consistently misses schedule
- Possible causes:
- Machine-specific reliability issues
- Operator skill level
- Parts routed to this machine are more complex
- Machine capacity overestimated
4. Specific Parts with Poor Attainment
- One part consistently runs late
- Possible causes:
- Cycle time estimate incorrect
- Complex setup requirements
- Quality issues
- Material availability problems
Improving Planning Accuracy
Data-Driven Adjustments:
Update Cycle Time Standards:
- Filter to specific part number
- Review actual cycle times vs. scheduled
- Calculate average actual cycle time
- Update part master data in ERP
- Use updated standard for future schedules
Example:
Part: WIDGET-100
Scheduled Cycle Time: 10 minutes
Actual Cycle Times (last 30 jobs):
  - Average: 12.5 minutes
  - Min: 11 minutes
  - Max: 15 minutes

Recommendation: Update standard to 13 minutes (includes buffer)
Adjust Setup Times:
- Filter Schedule Attainment to job transitions
- Compare scheduled setup time vs. actual
- Identify parts with longest actual setup times
- Update setup standards in ERP
- Apply to future schedules
Account for Downtime:
- Review historical downtime data
- Calculate average downtime per shift
- Add buffer to scheduled durations
- Example: 8-hour job + 10% downtime buffer = 8.8-hour schedule
Refine Capacity Planning:
- Use actual attainment to validate capacity assumptions
- If attainment <80%, capacity overestimated
- Adjust future capacity plans accordingly
Communicating with Stakeholders
Weekly Schedule Review Meeting:
- Present overall attainment % (trend over 4 weeks)
- Highlight top 5 jobs that missed schedule (by hours late)
- Discuss root causes
- Propose adjustments to planning assumptions
- Set improvement targets for next week
Customer Service Updates:
- Use Schedule Attainment data to provide realistic ETAs
- "Based on actual performance, we're running 2 days behind schedule on this type of job"
- Proactively notify customers of delays
- Rebuild trust through transparent communication
For Operations Managers
Morning Production Meetings
Use Schedule Attainment Dashboard:
Review Yesterday:
- What was overall attainment % yesterday?
- Which jobs missed schedule? Why?
- Which jobs exceeded expectations? What went right?
- Any patterns (e.g., 2nd shift consistently behind)?
Plan Today:
- Which jobs scheduled for today are at risk?
- Do we need to expedite any jobs?
- Do we have capacity to make up for yesterday's delays?
- Are materials/tooling ready for scheduled jobs?
Set Daily Target:
- "Yesterday we hit 82% attainment. Today's target: 85%."
- Assign ownership: Who's responsible for improving?
- Follow up: Check attainment at mid-shift and end-of-shift
Real-Time Monitoring
During Shift:
Check Dashboard Every 2 Hours:
- Are jobs starting on time?
- Are in-progress jobs on track to finish on time?
- Red-flag jobs: Take immediate action
Intervention Strategies:
- Behind schedule: Add operator support, expedite materials
- Machine downtime: Deploy maintenance immediately
- Quality issues: Engage quality team, consider rework strategy
- Operator unavailable: Reassign from less critical jobs
Communication:
- Update production schedule (drag-and-drop to adjust)
- Notify affected operators of priority changes
- Alert customer service of any delays >1 day
Analyzing Performance Trends
Weekly Reviews:
Trend Analysis:
- Is attainment improving or declining?
- Week-over-week comparison
- Identify best day of week (replicate conditions)
- Identify worst day of week (investigate root causes)
By Shift:
- Compare first, second, third shift attainment
- Shift-specific issues:
- Operator skill levels
- Supervisor effectiveness
- Material availability (3rd shift often waits for parts)
- Communication gaps
By Machine Group:
- Mills vs. Lathes vs. Grinders
- Which asset types perform best?
- Which need capacity additions or process improvements?
For Continuous Improvement
Root Cause Analysis
Steps:
1. Identify Problem Jobs
- Sort by "Hours Late" (descending)
- Focus on top 20% (80/20 rule)
2. Drill Down
- Click work order to view details
- Review timeline: Where did delays occur?
- Check downtime events: What caused stops?
- Review cycle times: Slower than expected?
3. Categorize Root Causes
- Machine issues: Unplanned downtime, slow cycles
- Material issues: Late deliveries, shortages
- Operator issues: Skill gaps, availability
- Quality issues: Rework, scrap
- Planning issues: Unrealistic schedules
- Other: Unique circumstances
4. Quantify Impact
- How many hours lost per cause?
- What % of late jobs due to each cause?
- Prioritize: Focus on biggest contributor first
5. Implement Corrective Actions
- Machine: Preventive maintenance, repairs
- Material: Improve procurement process, increase safety stock
- Operator: Training, shift rebalancing
- Quality: Process improvements, tooling upgrades
- Planning: Update cycle time standards
6. Measure Improvement
- Track attainment before/after changes
- Calculate ROI of improvements
- Share success stories with team
Benchmarking
Internal Benchmarking:
- Compare similar machines
- Compare similar parts
- Compare shifts
- Identify best performers, replicate practices
External Benchmarking:
- Industry average schedule attainment: ~75-80%
- World-class: >90%
- Set realistic improvement targets based on industry data
Improvement Tracking
Before/After Analysis:
Example:
Problem: Machine 5 consistently 65% attainment
Root Cause: Frequent unplanned downtime (coolant pump failures)
Action: Replaced coolant pump, implemented PM schedule
Measurement Period: 4 weeks before, 4 weeks after

Before: 65% attainment
After: 88% attainment
Improvement: +23 percentage points
ROI: Pump cost $5K, saved ~40 hours/month of downtime = $2K/month savings
Payback: 2.5 months
Best Practices
Setting Realistic Targets
Start with Baseline:
- Measure current attainment for 4 weeks
- Establish baseline (e.g., 72%)
- Set incremental improvement targets:
- Month 1: 75%
- Month 2: 78%
- Month 3: 80%
Don't Set 100% Target:
- Unrealistic due to variability
- Demotivates team
- 85-90% is excellent performance
Regular Review Cadence
Daily:
- Morning: Review yesterday, plan today
- Mid-shift: Check for red-flag jobs
- End-of-shift: Confirm completion, prepare for next shift
Weekly:
- Monday: Review last week's attainment
- Trend analysis (4-week rolling average)
- Root cause analysis of late jobs
- Action items for improvement
Monthly:
- Executive summary presentation
- Month-over-month comparison
- Continuous improvement project updates
- Celebrate wins (teams that improved)
Cross-Functional Collaboration
Include in Reviews:
- Production planners (schedule accuracy)
- Operations supervisors (execution)
- Maintenance (machine reliability)
- Quality (rework impact)
- Materials (availability)
- Customer service (delivery commitments)
Shared Accountability:
- Schedule attainment is a team metric
- Don't blame individuals
- Focus on systemic improvements
Troubleshooting
Attainment Data Not Showing
Possible Causes:
- Production Schedule not enabled
- No work orders with scheduled dates
- ERP integration not syncing
- Date range filter excluding data
Solutions:
- Verify Production Schedule Intelligence module enabled
- Check ERP connector status (Settings → Integrations)
- Confirm work orders have scheduled start/end times
- Adjust date range filter
Attainment Seems Incorrect
Possible Causes:
- Scheduled times incorrect in ERP
- Actual times incorrect (machine connectivity issues)
- Tolerance settings too strict/loose
- Time zone mismatch
Solutions:
- Spot-check: Compare dashboard data to ERP and shop floor reality
- Verify machine connectivity and part counting accuracy
- Review tolerance settings (Settings → Production Schedule → Tolerances)
- Check time zone settings (Settings → Company → Time Zone)
Jobs Showing "On Time" But Actually Late
Possible Cause:
- Tolerance window too wide (e.g., ±2 hours)
Solution:
- Navigate to Settings → Production Schedule → Tolerances
- Adjust "On-Time Window" to tighter tolerance (e.g., ±15 minutes)
- Re-run attainment report
Can't Find Specific Work Order
Possible Causes:
- Work order not imported from ERP
- Work order outside selected date range
- Search syntax issue
- Work order cancelled in ERP
Solutions:
- Check ERP for work order existence
- Expand date range to "All Time"
- Search by partial work order number
- Verify work order status in ERP (Active vs. Cancelled)
Related Documentation
- Production Schedule Intelligence Guide: Dynamic scheduling and ETTC
- Job Tracking Guide: Real-time job progress tracking
- Reports Guide: Creating schedule performance reports
- ERP Integration Guide: ERP connector setup
Questions? Contact support@machinemetrics.com