Machine Settings Guide
- Accessing Machine Settings
- Adding New Machines
- General Information Tab
- Production and Operations Tab
- Data Collection Tab
- Data Mapping Tab
- Data Rules Tab
- Warning and Failure Thresholds Tab
- Tool Monitoring and Integration Tabs
- Configuration Checklist
- Decommissioning and Restoring Machines
This guide defines how to configure Machine Settings in MachineMetrics and can be used to train an AI to generate configuration instructions.
1. Accessing Machine Settings
1.1 From the Machine Menu
- Open the machine menu on the left-hand side.
- Select the machine you wish to configure.
- Click the gear icon in the top-right corner.
You will see the following tabs:
- General Information
- Production & Operations
- Data Collection
- Data Mapping
- Data Rules
- Warning and Failure Thresholds
- Tool Monitoring (if Tool Anomaly Detection is purchased)
- Integration
1.2 From the Assets > Machines Page
You can also access settings and add machines via Assets → Machines:
- From the left-hand menu, expand Assets.
- Click Machines.
- To open settings for an existing machine:
- Select the machine in the list.
- Use the tabs at the top (for example Overview, Production & Operations, Data Collection, Data Mapping, Data Rules, and related tabs — exact labels may vary by account features).
- To change the edge device for a machine:
- Open the machine from this page.
- Use the control on the page to assign a different edge device.
- To duplicate a machine configuration:
- Use the Duplicate option on this page to copy an existing machine setup.
2. Adding New Machines
2.1 Add a Single Machine
- Go to Assets → Machines.
- Click Add Machine (top-right corner).
- Enter:
- Machine Name
- IP Address
- Edge Device
- If you need to add more than one machine individually:
- Use the + Add Machine button in the top-right to add more rows.
- Click Save and Connect.
MachineMetrics will:
- Use the IP Address to auto-detect the connection type (e.g., FANUC, Haas, MTConnect, etc.).
- Return you to the Machines page showing:
- Machine list
- Connection status
- IP address
- Collection method
For machines where automatic assignment fails:
- You will see a blue button labeled Needs connecting.
- Click Needs connecting to open the settings for that machine.
- In the bottom-right corner, under Data Collection Methods:
- Click Add.
- Select the correct collection method (e.g., Haas, MTConnect, OPC UA).
- Enter the connection address and adapter script if required.
- Click Save.
- The system will then attempt to connect to the machine using the provided details.
2.2 CSV Import (Bulk Add)
- Go to Assets → Machines.
- Click Add Machine.
- Select CSV Import.
- Prepare a CSV file with the following columns (case sensitive):
machineName(required)machineMake(optional)machineModel(optional)serial(optional)year(optional)edgeSerialNumber(optional)ipAddress(optional)
CSV Example:
machineName,machineMake,machineModel,serial,year,edgeSerialNumber,ipAddress
Mill-001,Haas,VF-3,12345,2020,U461122,192.168.1.10
Lathe-002,Mazak,QTN-250,67890,2019,,192.168.1.11
Grinder-003,Studer,S22,24680,2021,U461122,192.168.1.12
- Follow the on-page guidance to ensure:
- Column names match exactly (case sensitive).
- Required field
machineNameis present.
- Upload the CSV.
- Once the machines appear in the table, click Save and Connect.
MachineMetrics will:
- Attempt to determine the machine connection type for each machine using the IP Address.
- Mark any machines that require manual setup with Needs connecting.
For any machine that says Needs connecting:
- Click the button.
- Configure Data Collection Methods as described above.
- Click Save to trigger the connection attempt.
3. General Information Tab
Use this tab to define core attributes of the machine.
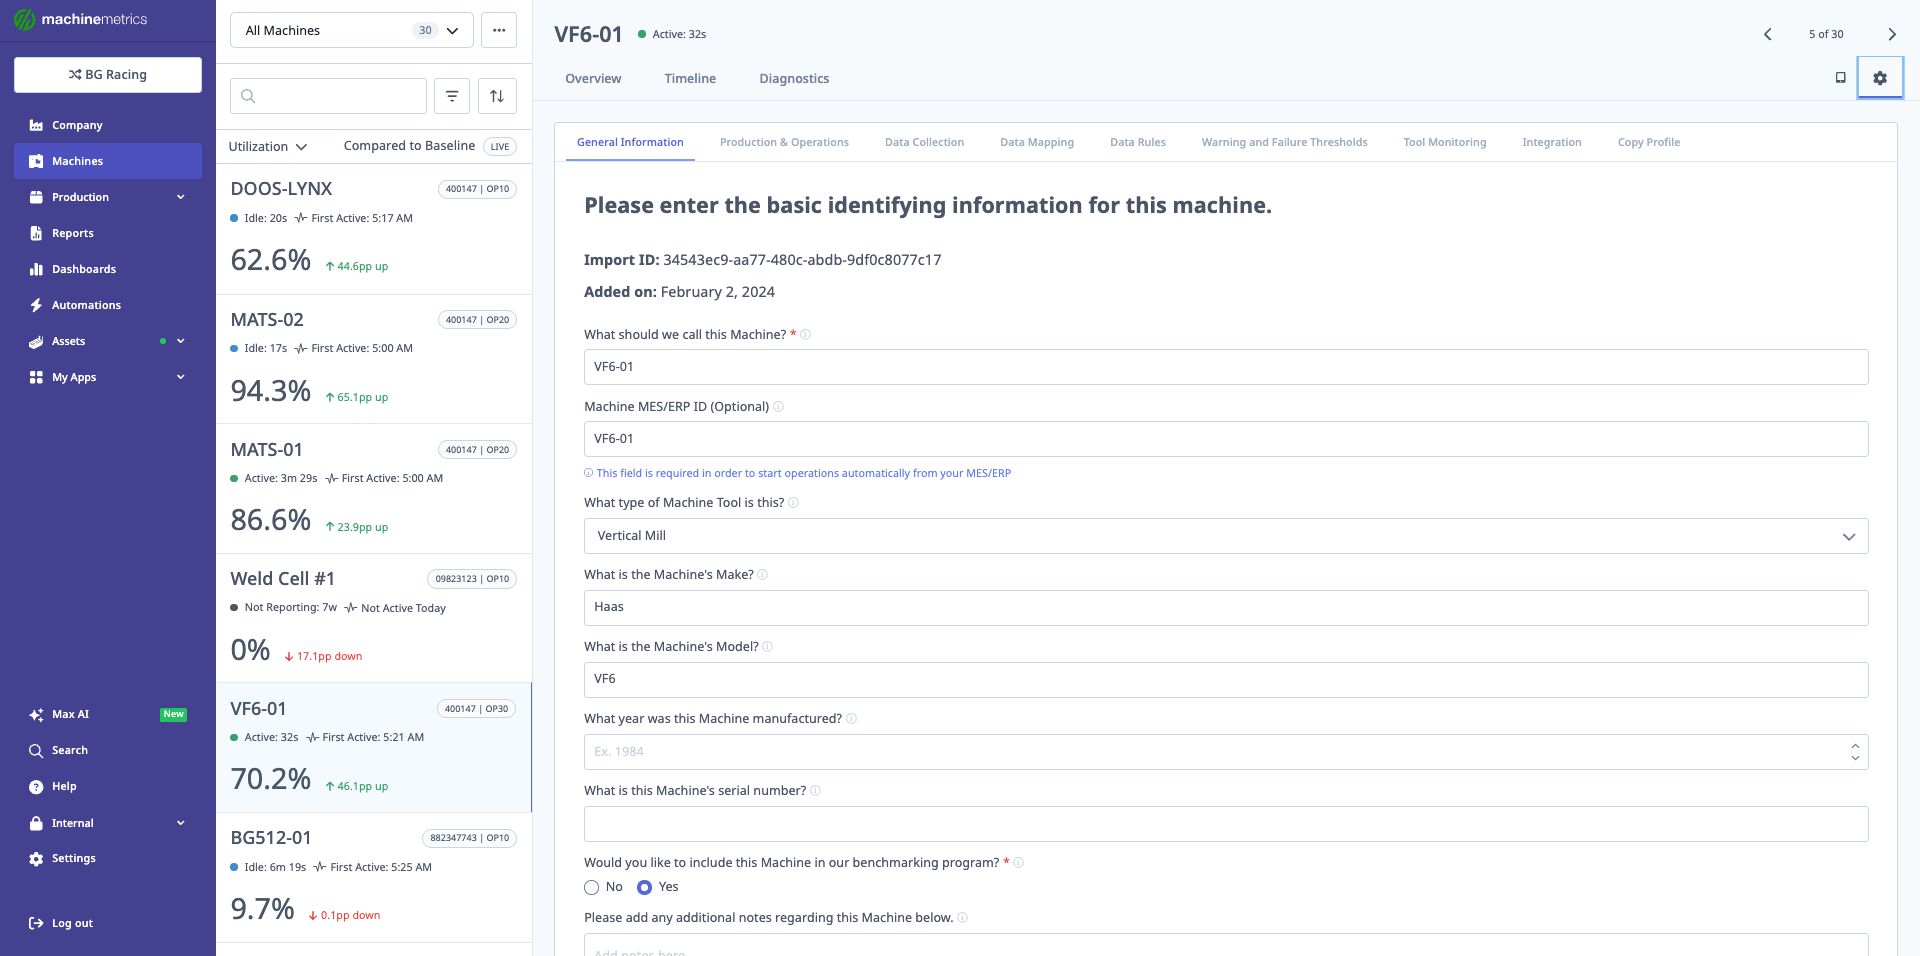
The General Information tab is where you enter basic identifying information for the machine, including machine name, ME/ERP ID, machine type, make, model, manufacturer, serial number, and whether to include the machine in benchmarking programs. This screenshot shows a sample machine (VF6-01) with its configuration details.
3.1 Core Fields
-
Machine ID
- System-generated identifier for the machine.
-
Date Added
- Timestamp when this machine was added to the account.
-
What should we call this machine?
- Human-friendly name and primary identifier for this machine.
- Use a naming convention meaningful to your operation.
-
What type of machine tool is this?
- Select the type:
- Mill
- Lathe
- CMM
- PLC
- Etc.
- Select the type:
-
What is the machine's make and model?
- Important for:
- Troubleshooting
- Support
- Determining likely connection methods
- Important for:
-
What year was the machine manufactured?
-
What is the machine's serial number?
- Useful if MachineMetrics needs to contact the machine tool builder on your behalf.
3.2 Benchmarking Program
- Include this machine in the benchmarking program?
- Enables anonymous comparison with all machines of the same type in MachineMetrics.
- Data (e.g., utilization) is anonymized and aggregated.
- Supports industry performance reporting without revealing customer identity.
3.3 Notes and Schedule
-
Notes regarding this machine
- Free-text field for:
- Setup notes (e.g., "in its own cell", "in a Fastems cell")
- Attached devices or automation
- Any information that helps with troubleshooting or context.
- Free-text field for:
-
Machine Schedule
- Assign the schedule this machine follows.
- Schedules are created in System Settings.
- Controls expected operating times and schedule-based reporting.
3.4 Controller and Decommission
-
Controller Make/Model
- Specify controller manufacturer and model.
- Supports:
- Connection selection
- Troubleshooting
-
Decommission
- Located at the bottom-left.
- Removes the machine from your active machine list when it is no longer in service.
- See Section 11 — Decommissioning and Restoring Machines for important details before using this option.
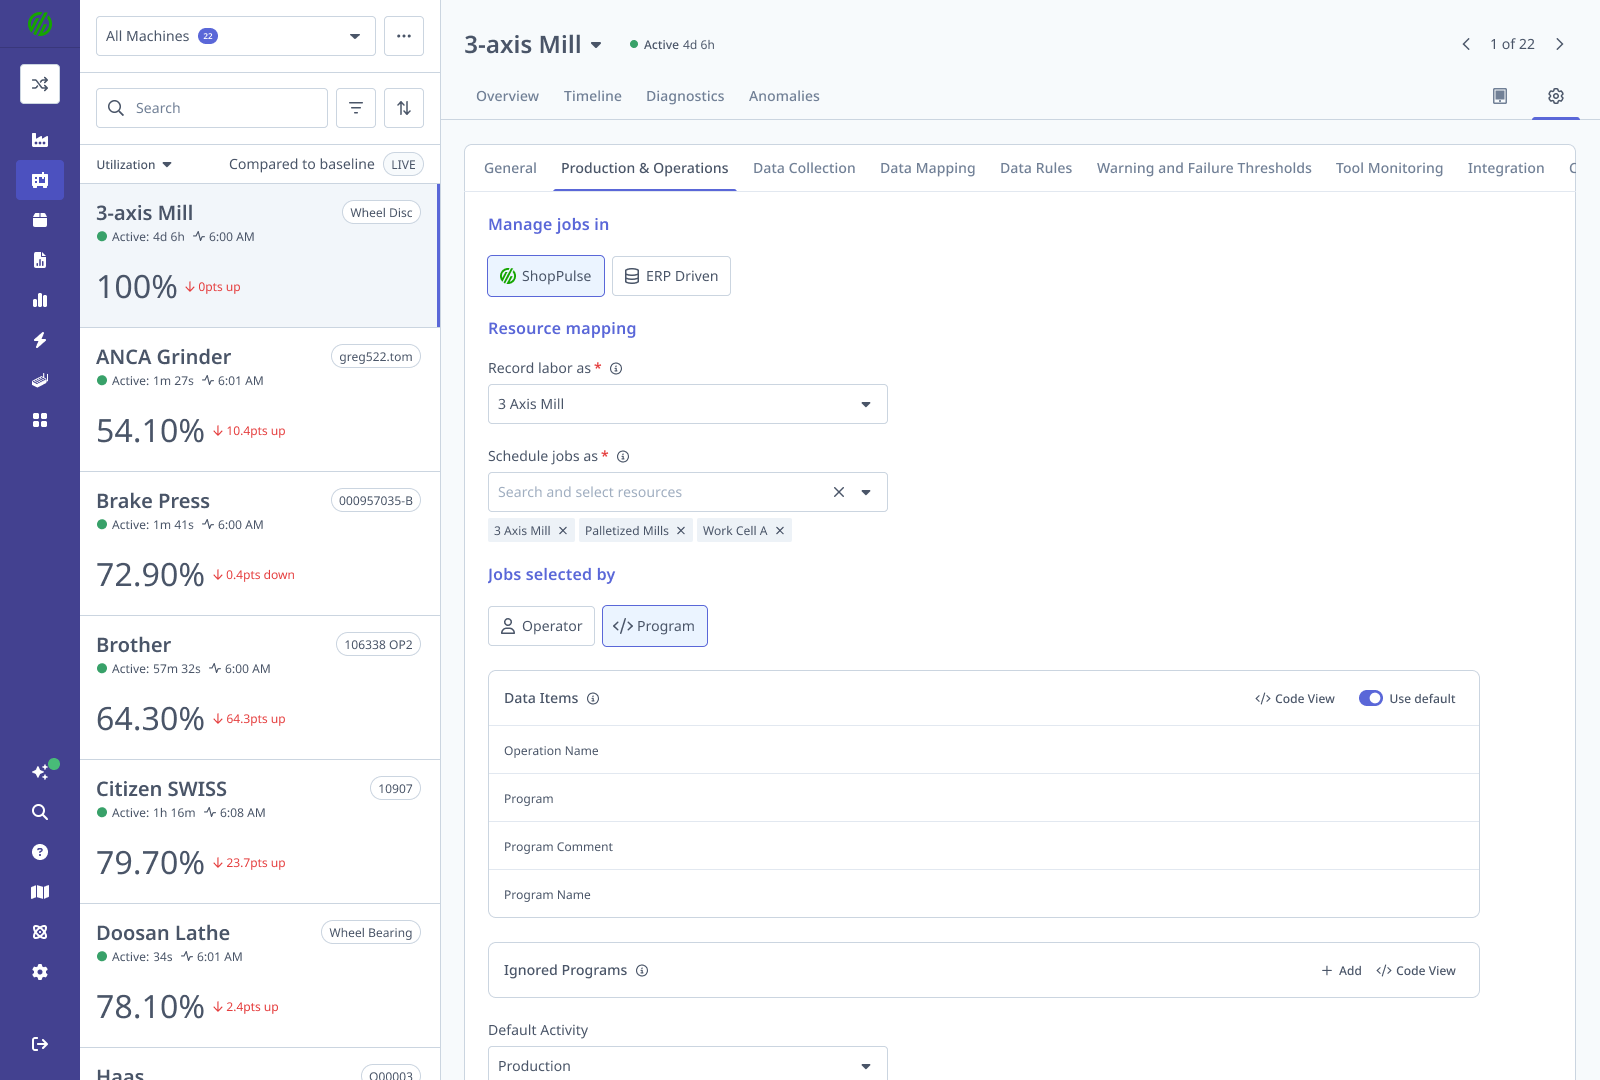
4. Production and Operations Tab
The Production & Operations tab on Machine Edit was overhauled to center on job management, ERP resource mapping, how jobs are selected (operator vs program / APM), and MES. The overview below matches the current product behavior described in Configuring a Machine's Production Settings — use that guide for full step-by-step detail, screenshots, FAQs, and troubleshooting.
4.1 Access and navigation
| Requirement | Details |
|---|---|
| Who | Manager, Executive, and IT Admin users. |
| Where | Machines in the main sidebar → select a machine → settings icon in the machine header → Production & Operations tab. |
4.2 Job management, ERP mapping, and MES
Manage jobs in
- ShopPulse — Operators manage jobs and submit labor tickets in MachineMetrics; data syncs to your ERP.
- ERP Driven — Jobs and labor are managed in the ERP; MachineMetrics reflects ERP state read-only. Jobs selected by is not available in this mode.
Record labor as / Schedule jobs as
- Record labor as — Single ERP resource labor tickets are attributed to. If Manage jobs in is ERP Driven, this must be an individual resource (resource groups are not supported in ERP Driven mode).
- Schedule jobs as — One or more ERP resources or resource groups that determine which jobs appear on this machine’s Dispatch Schedule.
Both must be set before MES can be enabled on the machine.
Jobs selected by (when Manage jobs in = ShopPulse)
- Operator — Operator picks jobs from the Dispatch Schedule. With MES off, Operators can create new operations may appear so operators can create jobs manually instead of only selecting scheduled work.
- Program — Jobs are tracked from the running program. Auto Production Monitoring (APM) matches programs to jobs using part/program data; see Auto Production Monitoring (APM) for Data Items, Ignored Programs, Default Activity, and Create run when operation changes (when MES is off, that setting controls when a new production run starts). With MES on, labor tickets drive run lifecycle instead.
Optional features (MES on + ShopPulse)
| Feature | What it does |
|---|---|
| Enable first article inspection | QA gate at setup → production. See First Article Inspection. |
| Enable shift handover | Structured end-of-shift handoff and AI summary for the next operator. See Shift Handover. |
Same toggles exist as FAI / Handover on MES Settings → Machines for bulk edits.
MES enablement
Enabling MES on the machine switches it to ERP-sourced operations with labor tickets; active operator sessions and jobs on that machine stop — a warning confirms before apply. Disabling MES has the same stop behavior; submit in-flight labor tickets first. Other machines are unaffected.
Uniform vs Flexible connector accounts
How global vs per-machine options interact depends on connector type (e.g. Uniform vs Flexible / Epicor Kinetic). See MES Settings. Your Solution Delivery Manager (SDM) can confirm which applies to your account.
4.3 Configuration summary
| MES | Manage jobs in | Jobs selected by | Result |
|---|---|---|---|
| Off | ShopPulse | Operator | No labor tickets; operator-driven jobs |
| Off | ShopPulse | Program | Program-driven tracking and APM; no labor tickets |
| On | ShopPulse | Operator | MES; operator picks jobs; labor tickets to ERP |
| On | ShopPulse | Program | MES; APM matching; operator confirms; labor tickets to ERP |
| On | ERP Driven | N/A (locked) | ERP-managed; MachineMetrics read-only |
4.4 Typical setup order and references
- Set Manage jobs in (ShopPulse vs ERP Driven).
- Map Record labor as and Schedule jobs as.
- Set Jobs selected by to Operator or Program (ShopPulse only).
- If Program, review program-matching defaults; see APM guide before changing advanced options.
- Enable MES on the machine when ready (after mapping and warnings acknowledged).
Also helpful
- Machine Production Settings — full UI walkthrough, tips, and FAQs.
- How to Use ShopPulse on MES-Enabled Machines — operator-facing MES behavior.
5. Data Collection Tab
Define how the system connects to and reads data from the machine.
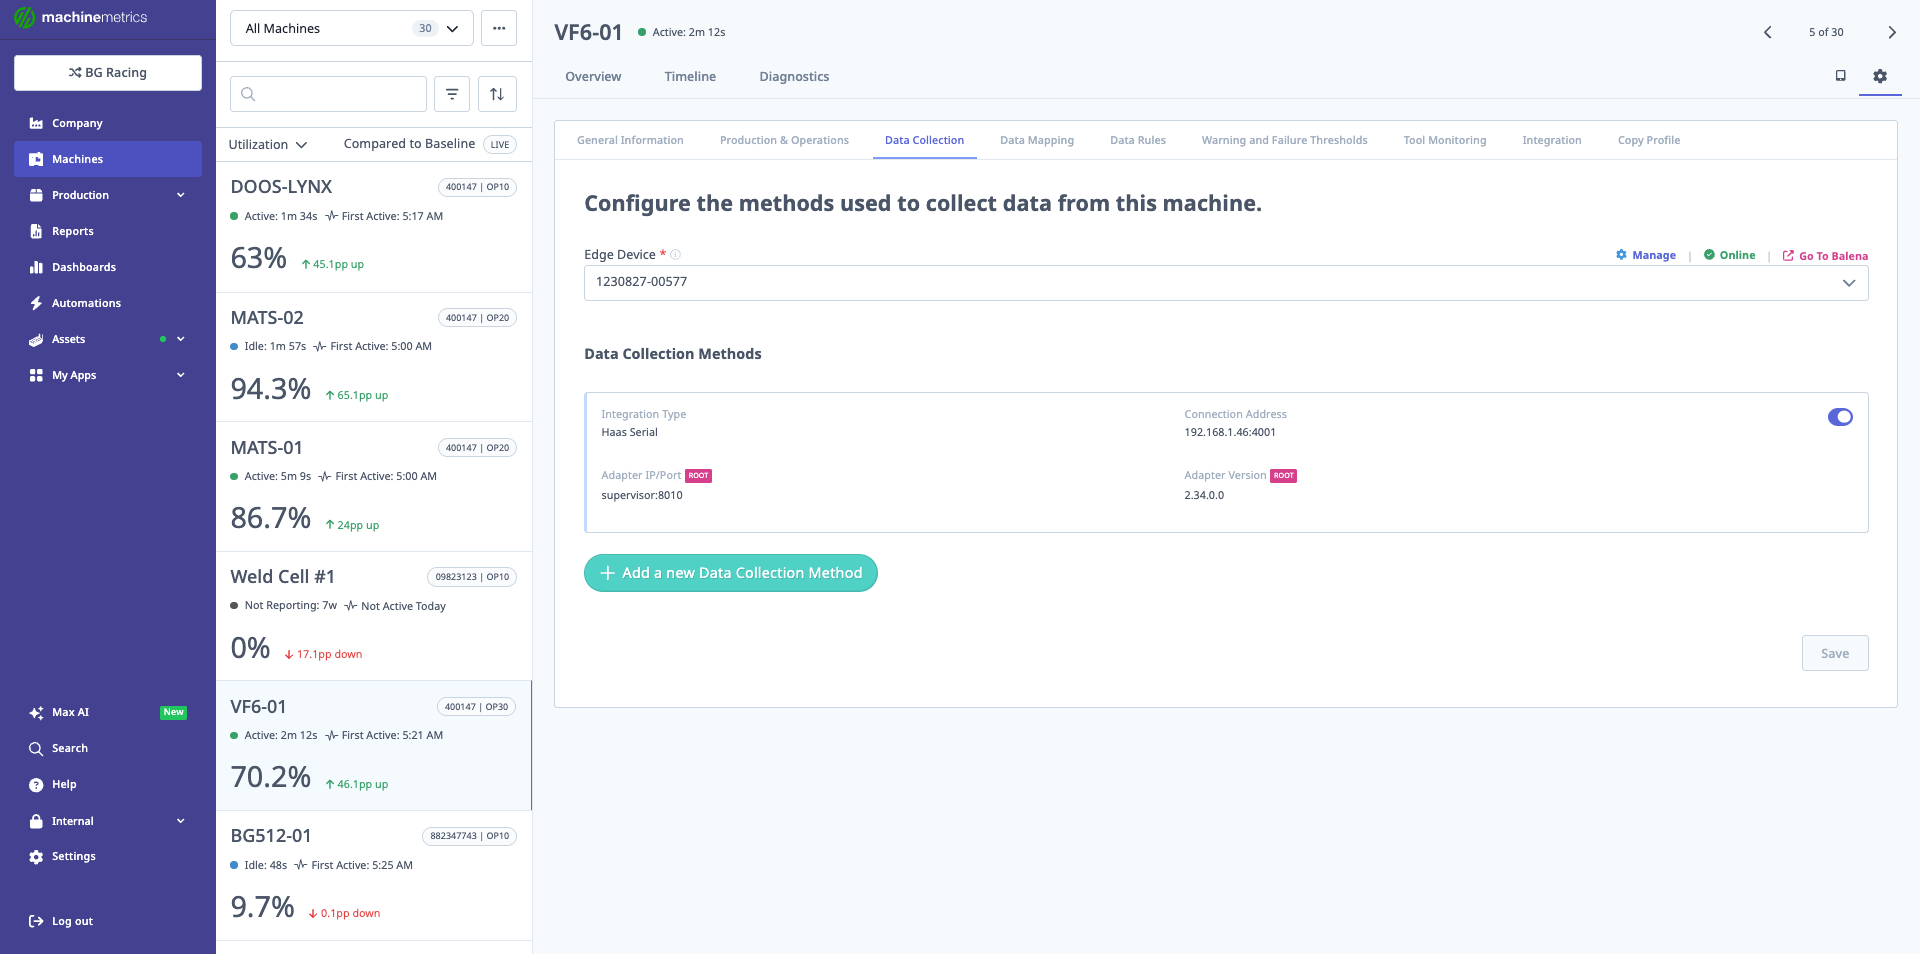
The Data Collection tab shows the configured adapters for the machine. In this example, a Haas Serial integration is configured at IP 192.168.1.46:4001 with adapter version 2.34.0.0, along with a supervisor adapter at port 8036. This tab is where you add, manage, or delete data collection methods.
5.1 Adding a New Data Collection Method
- Open the Data Collection tab.
- Click Add a new data collection method.
- Use the dropdown to select one of the supported connection types, such as:
- Allen Bradley
- Brother
- Citizen M700
- Digital IoT
- Ethernet/IP (for Allen Bradley)
- FANUC FOCAS (Serial)
- Heidenhain
- IO-Link
- JSON HTTP
- Mitsubishi M70 / M80 / M800
- Modbus
- MQTT
- MTConnect Adapter
- MTConnect Agent
- OPC UA
- Siemens Step 7
- Universal Robot
- Transform
5.2 Machine Connections (All Types Except Transform)
For standard machine connections:
- You must provide:
- Connection address (IP, URL, or endpoint).
- Many connections require:
- An adapter script, which:
- Handles reading data from the controller or PLC.
- Publishes metrics in a format MachineMetrics understands.
- An adapter script, which:
For adapter scripts and examples:
- Refer to the Machine Connections section of the MachineMetrics Support Portal.
5.3 Transforms
Transforms are a special type of data collection entry:
- They do not connect directly to a machine.
- Instead, they process data coming from an existing adapter.
Transforms follow In → Process → Out:
-
In
- Declare keys that identify which incoming data items you will use.
-
Process
- Use variables and built-in operators to:
- Combine data.
- Perform calculations.
- Derive new signals.
- Use variables and built-in operators to:
-
Out
- Define output data items.
- These output items appear like standard data items and can be:
- Mapped in Data Mapping.
- Used for part counting, program logic, or analytics.
Transforms enable advanced customization of your machine data.
6. Data Mapping Tab
Configure how all incoming data items are labeled and used.
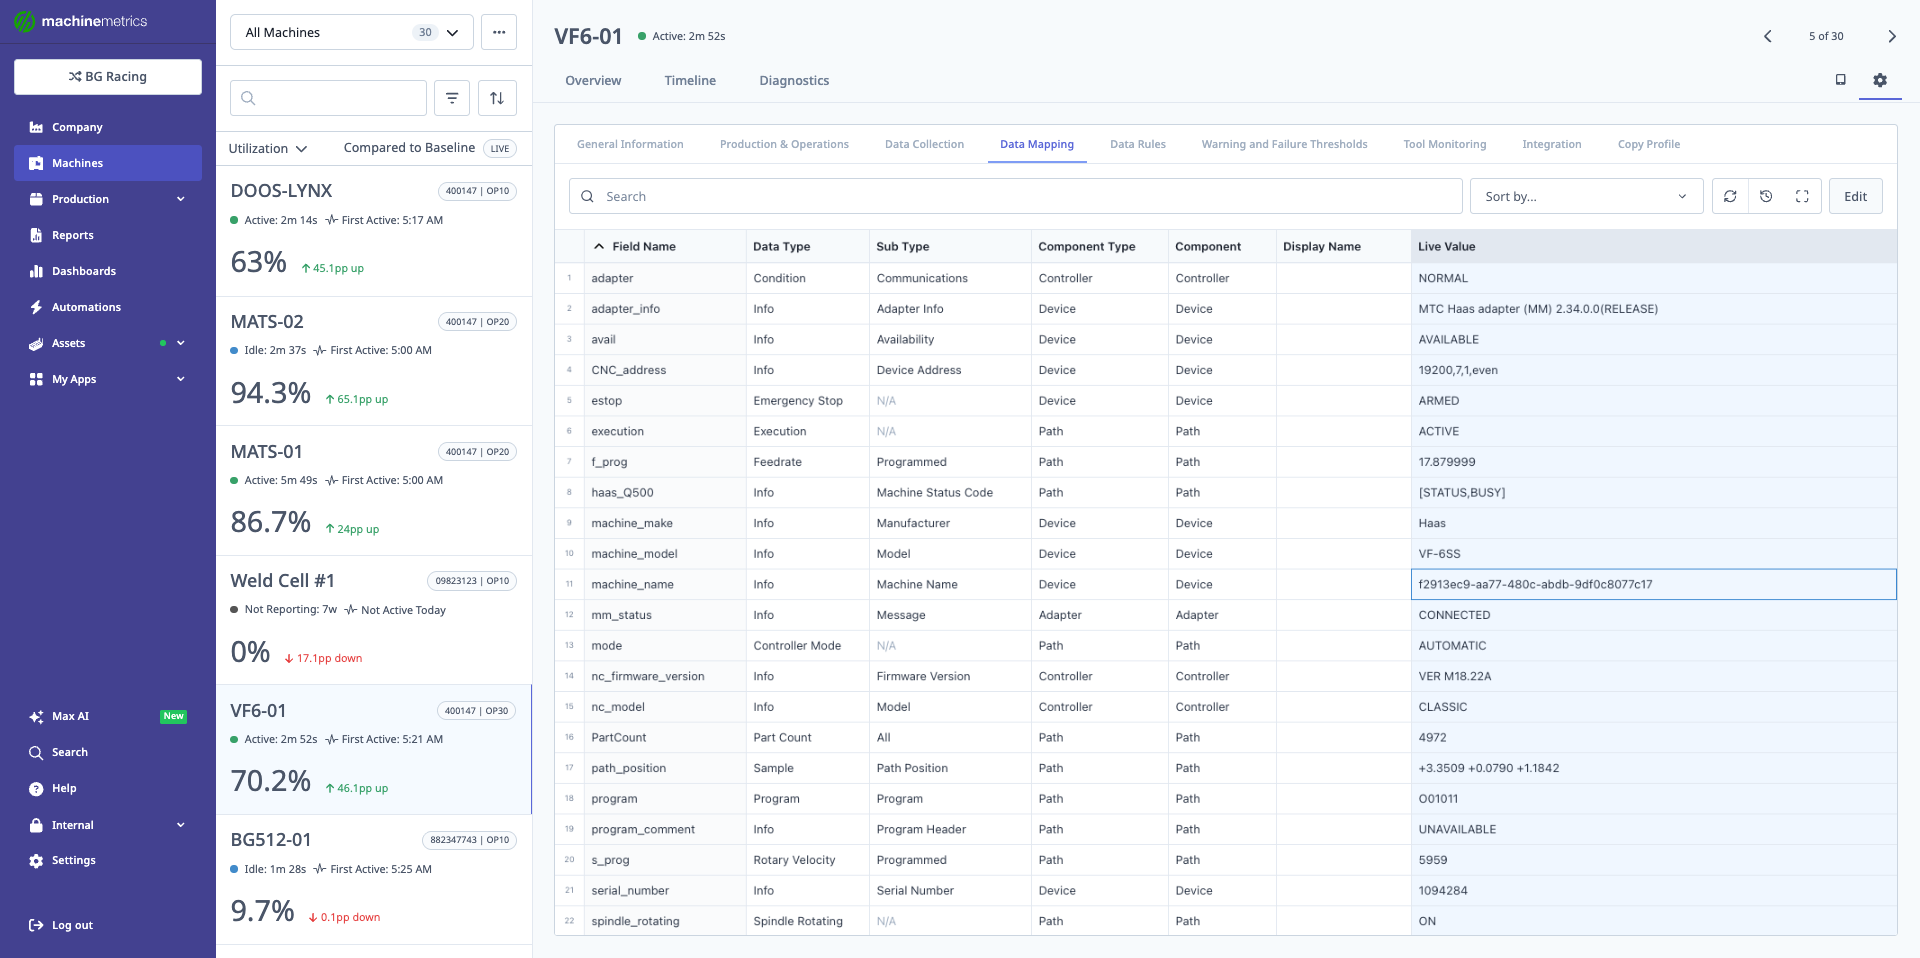
The Data Mapping tab displays all data items collected from the machine, showing field names, data types, sub types, component types, components, display names, and live values. This comprehensive view includes controller information, device details, and path data. You can search, sort, and edit data mappings to ensure all machine data is properly categorized and displayed.
6.1 Data Item Structure
The Data Mapping table shows:
-
Field Name
- Raw name from the machine or transform.
-
Data Type
-
Subtype
- Aids in organization and display in the Diagnostics tab.
-
Component / Component Type
- Indicates where the data belongs in the machine hierarchy.
6.2 Critical Mappings
For MachineMetrics features to work:
-
Program items:
- Must be mapped as
program. - Otherwise, they cannot be selected for program matching / APM Data Items on the Production & Operations tab (see APM).
- Must be mapped as
-
Part Count items:
- Must be mapped as
part count. - Otherwise, they cannot be used as:
- The data item for counting parts.
- Must be mapped as
-
Execution items:
- Must be mapped as
execution. - This supports:
- Running/idle states
- Utilization calculations
- Must be mapped as
6.3 Unmapped Data Items
- Any data item shown as unmapped:
- Will not be displayed.
- Will not be tracked in MachineMetrics.
Be sure to map all important signals, especially those required for production tracking and KPIs.
6.4 Editing, Importing, and Exporting Mapping
-
Edit Item:
- Use the Edit option to change:
- Data Type
- Subtype
- Component mapping
- Save changes to apply.
- Use the Edit option to change:
-
Export / Import:
- Export current mappings to a file.
- Modify them externally (or generate via AI).
- Re-import the mapping file.
Typical workflow with PLCs:
- Export PLC tags (e.g., from Allen Bradley).
- Use an AI (e.g., Claude) to generate a MachineMetrics mapping file.
- Import the file to quickly set up mapping.
6.5 Available Data Types and Sub Types Reference
When mapping data items, you must select from the following Data Types and Sub Types. Capitalization is critical — use these values exactly as shown.
How to read this reference:
- Bold entries are top-level Data Types
- Indented entries beneath a Data Type are its available Sub Types
- Data Types with no indented entries have no Sub Types and are standalone signals
Part and Count Metrics
PartCount
- Total
- All
- Good
- Bad
- Target
- Remaining
ScrapCount (no sub types)
NonconformCount (no sub types)
CorrectionCount (no sub types)
Machine State Signals
Execution (no sub types)
SpindleRotating (no sub types)
Cutting (no sub types)
EmergencyStop (no sub types)
ControllerMode (no sub types)
Time Tracking
AccumulatedTime
- Total Operating Time
- Total Running Time
- Total Cutting Time
- Total Spindle Run Time
- Operating Time
- Running Time
- Cutting Time
- Spindle Run Time
EquipmentTimer
- Loaded Time
- Working Time
- Operating Time
- Powered Time
- Delay Time
EquipmentMode
- Loaded
- Working
- Operating
- Powered
- Delay
Program and Progress
ProgramProgress (no sub types)
Program
- Program
- Subprogram
- Program Name
- Subprogram Name
ProgramComment
- Program Comment
- Subprogram Comment
Speed and Feed
Feedrate
- Actual
- Commanded
- Jog
- Programmed
- Rapid
RotaryVelocity
- Actual
- Commanded
- Programmed
Override
- Rotary Velocity
- Feed
- Rapid Feed
- Jog Feed
Variables and Registers
Variables
- Common
Register (no sub types)
Bit (no sub types)
MacMan
- Panel History
OutputSignal
- Dry Run
- Machine Lock
Process Measurements
Amplitude
- Actual
- Target
Flow
- Actual
- Target
Pressure
- Actual
- Target
- Lower Target
- Upper Target
Humidity
- Absolute
- Relative
- Specific
CutSize
- Length
- Radial
Condition Monitoring
Condition
- Position
- Temperature
- Load
- Actuator
- Angle
- Pressure
- Level
- Communications
- Hardware
- System
- Motion Program
- Logic Program
Sample Data Type
The Sample data type is used for analog sensor readings and has the most sub types:
Sample
- Acceleration
- Angular Acceleration
- Angular Velocity
- Amperage
- Angle
- Axis Feedrate
- Boolean
- Clock Time
- Concentration
- Conductivity
- Displacement
- Electrical Energy
- Fill Level
- Flow
- Frequency
- Length
- Linear Force
- Load
- Mass
- Path Feedrate
- Path Position
- PH
- Position
- Power Factor
- Pressure
- Resistance
- Rotary Velocity
- Sound Level
- Strain
- Surface Speed
- Temperature
- Tilt
- Tool Length
- Tool Radius
- Torque
- Volt Ampere
- Volt Ampere Reactive
- Velocity
- Viscosity
- Voltage
- Wattage
- Current Transducer
- Sensor 1
- Sensor 2
- Sensor 3
- Sensor 4
- Sensor 5
- Sensor 6
- Amplitude
- Custom
Info Data Type
The Info data type is used for discrete/event-based information and status values:
Info
- Actuator State
- Active Axes
- Availability
- Axis Coupling
- Axis Interlock
- Axis State
- Block
- Chuck Interlock
- Chuck State
- Controller Mode
- Coupled Axes
- Direction
- Display Language
- Door State
- End Of Bar
- Firmware Version
- Functional Mode
- Interface State
- Line
- Material
- Manufacturer
- Message
- Model
- Operator ID
- Pallet ID
- Part ID
- Part Number
- Path Mode
- Power State
- Program
- Program Edit
- Program Edit Name
- Program Comment
- Program Header
- Rotary Mode
- Serial Number
- Spindle Interlock
- Spindle Mode
- Tool Asset ID
- Tool Number
- Version
- Workholding ID
- Block Delete
- Coolant
- Dry Run
- Operation Mode
- Optional Stop
- Reset
- Single Block
- Machine Lock
- Tool Group
- Tool Suffix
- Sequence Number
- Unit Number
- Workpiece
- Number Active Axes
- Loaded Program Name
- Internal Coolant
- External Coolant
- System Type
- Adapter Info
- Device Address
- Machine Name
- Machine Status Code
- Message Event Code
- Downtime Code
- Cycle Rate
- Work Counter Codes
- Scan Interval
- Interlock
- Tool Cuts
- Operation Count
- Chuck Select
- Cut Area
- Calibration Interlock
- Operator Interlock
- Rework Count
- Cutting Mode
- Supervisor Override
- Cycle Start
- Custom
7. Data Rules Tab
Control primary metrics used for dashboards and reporting.
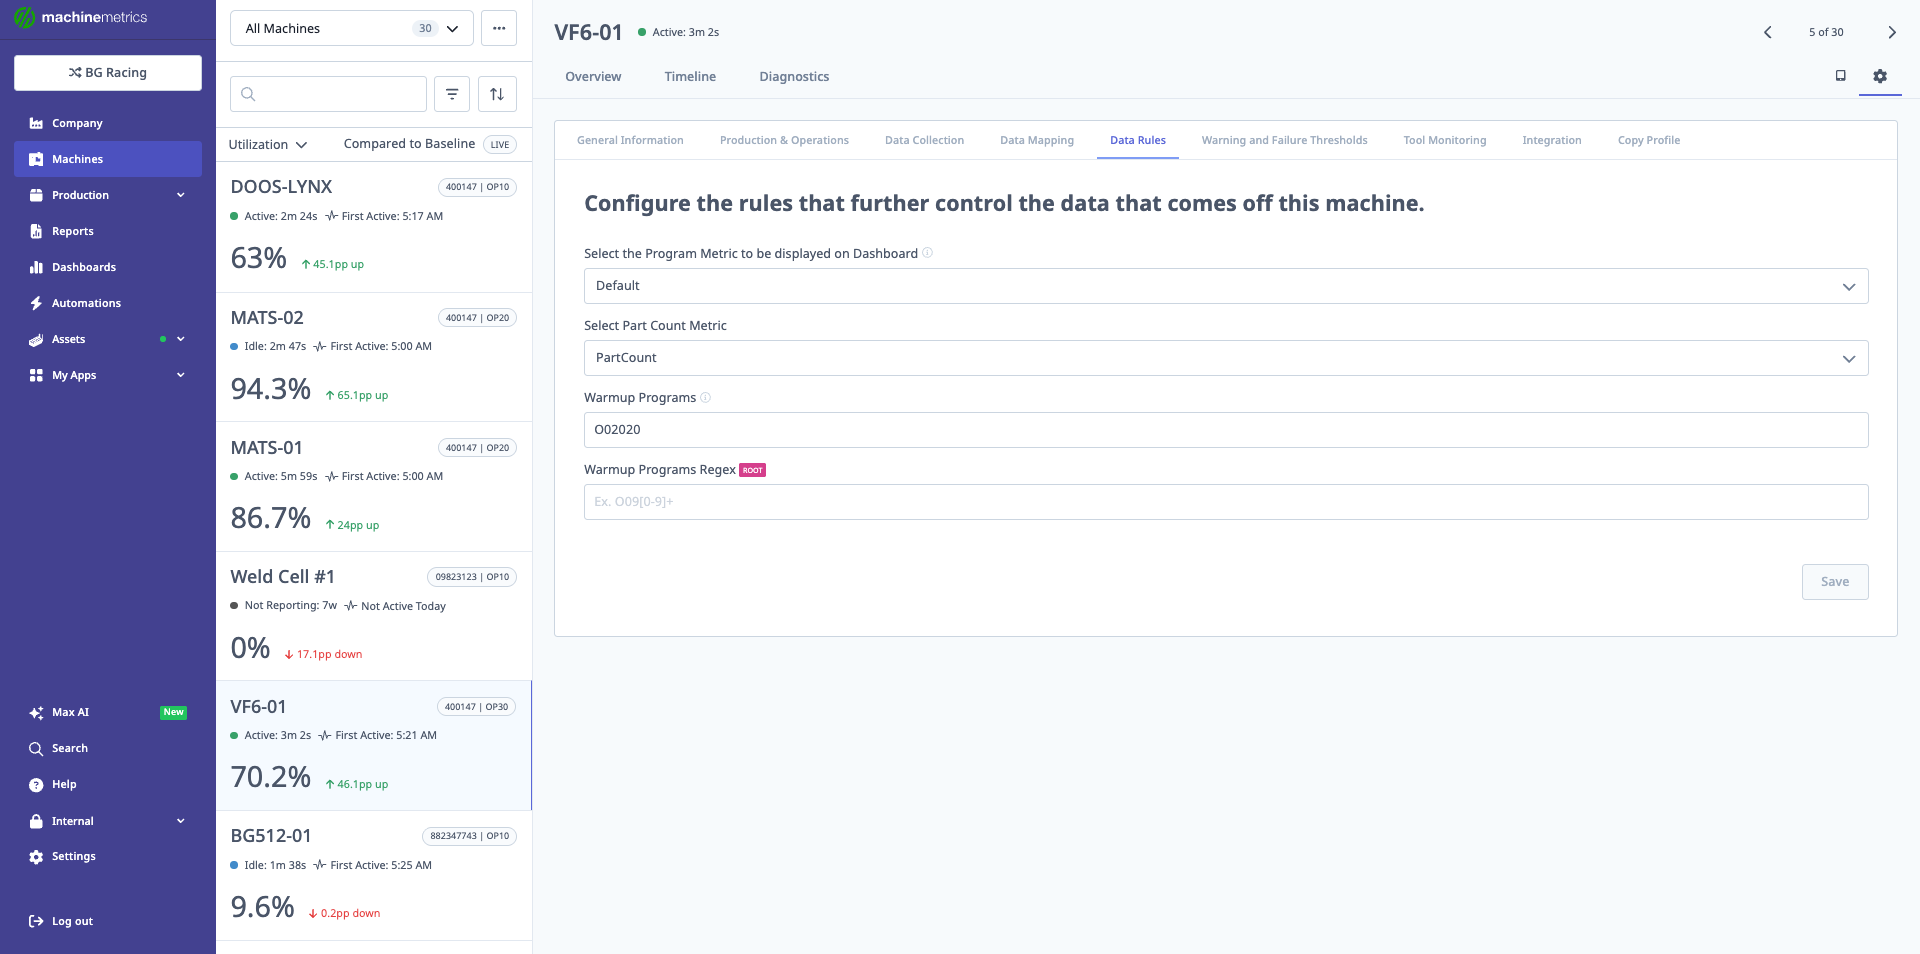
The Data Rules tab allows you to configure which metrics are displayed on dashboards and shop floor boards. Key settings include selecting the Program Metric (Default), Part Count Metric (PartCount), defining Warmup Programs (O00020), and specifying Warmup Programs Regex patterns. These rules control how production data is interpreted and displayed.
7.1 Program Metrics
- Select which program-related metric to display on:
- Dashboards
- Shop floor boards
7.2 Part Count Metric (Most Important Setting)
- Select Part Count Metric:
- Decide which data item is the authoritative part counter.
Available Options:
The dropdown includes several part count options based on your machine's available data items and configuration:
- Default (part_count, part_count2, total_part_count, total_part_count2)
- Production Run
- Virtual Part Counter
- Manual Counter
- Haas M30-Counter (for Haas machines)
How to Choose the Right Option
Default (Standard Part Count) - Most Common
This is the standard option and uses the machine controller's built-in part counter.
When to use:
- Machine has a reliable built-in part counter
- Controller properly increments the counter
- No double-counting issues
Common data items:
part_count- Primary counter from controllerpart_count2- Secondary counter (if machine has multiple paths)total_part_count- Accumulated total countertotal_part_count2- Secondary accumulated counter
⚠️ Avoiding Double Counts:
If you experience double counts, it's likely because multiple part count paths are being counted. In this case:
- Identify which path to count: Check if your machine has Path 1/Path 2 or multiple counters
- Select the specific counter: Choose
part_count(Path 1) ORpart_count2(Path 2), not both - Verify in Data Mapping: Ensure only ONE counter is mapped as the part count data item
Common scenarios:
- Mill-turn lathes with two paths: Select Path 1 (
part_count) unless Path 2 is your primary production path - Machines with multiple spindles: Choose the counter that represents completed parts, not work-in-progress
Haas M30-Counter - For Haas Machines with Double Counting
When to use:
- You have a Haas machine
- You're experiencing double counting issues
- Machine has multiple M30 counters
Why this option exists:
Haas mills typically have two M30 counters in their control. If both counters are mapped, the system will double-count each finished part.
Solution:
- Select "Haas M30-Counter" from the dropdown
- This tells the system to use only M30 Counter #1
- Prevents duplicate part counts
Alternative fix:
- Go to Data Mapping tab
- Unmap one of the M30 counters
- Keep only M30 Counter #1 mapped as part count
Virtual Part Counter (VPC) - AI-Powered Counting
When to use:
Use VPC when your machine does not have a reliable part counter or when controller part counts are:
- Missing or unavailable
- Inconsistent or unreliable
- Incorrectly programmed
- Different across similar machines in your fleet
What is Virtual Part Counter?
VPC uses artificial intelligence to automatically detect part completions by analyzing real-time machine signals:
- Tool number sequences
- Program execution states
- Machine activity patterns
- Controller mode changes
Instead of relying on the machine's built-in counter, VPC learns each machine's unique cycle patterns and counts parts automatically.
Key Benefits:
- No programming required: Works without configuring controller-specific part counting logic
- Self-learning: Automatically adapts to production changes
- Real-time accuracy: Counts parts as cycles complete
- Fleet-wide consistency: Standardizes part counting across different machine types
Requirements for VPC:
✅ Machine must have:
- Advanced controller with reliable data items (tool numbers, execution state, controller mode, program numbers)
- Connection via FANUC FOCAS, MTConnect, OPC-UA, or similar protocol
- Machine must output tool number data
- Not supported: I/O-only connections
✅ Production must have:
- Job tracking enabled (APM, ShopPulse, or ERP-driven)
- 3+ repetitive cycles per job
- Cycle times under 1 hour
Enabling Virtual Part Counter:
- Navigate to Machine Settings (gear icon) → Data Rules tab
- Find "Select Part Count Metric" dropdown
- Select "Virtual Part Counter" from the list
- Click "Save"
What Happens Next:
- VPC activates immediately
- For ongoing jobs: VPC starts counting after a brief warmup period (3-10 cycles)
- For new jobs: VPC learns from first few cycles, then backfills counts
- Counts appear in real-time on dashboards, reports, and operator tablets
Warmup Period:
- New jobs (never seen before): VPC needs to observe a few cycles before counting accurately
- Typical warmup: 3-10 cycles depending on complexity
- During warmup: Counts may not appear immediately but will backfill once model is confident
- Established jobs: No warmup needed; VPC counts from first cycle
Validation:
Check VPC accuracy using:
- Timeline View: Verify part count increments align with cycle completions
- Job Run Comparison: Compare VPC totals to manual hand counts
- Production Reports: Review counts in reports to ensure accuracy
When VPC May Not Work:
- Machines connected via Digital I/O only
- Machines that don't output tool number data
- Jobs with fewer than 3 repetitive cycles
- Cycle times exceeding 1 hour
- Non-repetitive one-off parts
Troubleshooting VPC:
| Issue | Solution |
|---|---|
| No counts appearing | • Verify job tracking is enabled • Check machine data: Tool number, execution state available? • Confirm 3+ repetitive cycles exist • Wait for warmup period on new jobs |
| Counts seem inaccurate | • Validate against Timeline view • Check cycle consistency • Verify cycle time under 1 hour • Compare to hand counts |
| VPC stopped counting mid-job | • Check machine connectivity • Verify job didn't change • Look for data gaps in Timeline |
Reverting to Controller Part Count:
If VPC doesn't work for your machine:
- Return to Machine Settings → Data Rules
- Change "Select Part Count Metric" back to your controller part count data item
- Click "Save"
Production Run - For Machines with Manual Interventions
When to use:
- Production includes frequent off-runs (setup, testing, trials)
- Operators make many manual interventions
- You want to count one cycle per production run change (not individual parts)
What it does:
Counts 1 cycle each time a production run changes, rather than counting every part.
Best for:
- Customers with high mix/low volume production
- Shops with significant setup and trial runs
- Machines where operators frequently stop/start/adjust between good parts
Example scenario:
- Operator sets up machine and runs 5 test parts (not counted)
- Operator starts production run for Job #123 → Count increments by 1
- Machine produces 50 parts on that run → Still shows count of 1
- Operator changes to Job #456 → Count increments by 1 (now total is 2)
Not recommended for:
- Standard part counting needs
- High-volume production where individual part counts matter
- Tracking actual quantities produced
Manual Counter - For Manual Stations Only
When to use:
- Machine is configured as a Manual Station in MachineMetrics
- Operators manually track production (no automated counter)
What it does:
Allows operators to manually enter part counts through the ShopPulse interface.
Availability:
- Only available on machines configured as Manual Stations
- Not available on CNC machines or automated equipment
How it works:
- Operator completes parts at manual station
- Operator enters count via ShopPulse tablet/interface
- System records manual count for reporting
See Also:
- Manual Stations Setup Guide for configuring manual workstations
7.3 Troubleshooting Double Counts
If you see duplicate or double part counts:
Step 1: Identify the Issue
- Check if machine has multiple counters (Path 1/Path 2, multiple M30s, multiple spindles)
- Look at Data Mapping tab - how many data items are mapped as "part count"?
- Check Data Rules tab - which part count metric is selected?
Step 2: Fix the Root Cause
Solution A - Use Data Rules (Recommended):
- Go to Data Rules tab
- Change "Select Part Count Metric" to the specific counter you want:
- For Haas machines: Select "Haas M30-Counter"
- For Path machines: Select
part_count(notpart_count2) - For dual-spindle: Select the primary spindle counter
- Save changes
Solution B - Fix Data Mapping:
- Go to Data Mapping tab
- Find all data items mapped as "part count"
- Unmap the secondary/duplicate counters
- Keep only ONE counter mapped as part count
- Save changes
Step 3: Verify Fix
- Watch machine Timeline for next few cycles
- Confirm part count increments by 1 (not 2) per completed part
- Check dashboards and reports show correct counts
7.4 Warmup Programs
Define program names or patterns that should be excluded from production counting and reporting.
What are Warmup Programs?
Warmup programs are non-production programs that operators run to prepare the machine, such as:
- Machine warmup routines
- Tool setter programs
- Calibration programs
- Test programs
- Setup verification programs
Why exclude them?
These programs should not be counted as production because they:
- Don't produce parts
- Artificially inflate cycle counts
- Skew production metrics and reports
- Create confusion in dashboards
How to Configure:
Option 1: Exact Program Names
- Enter specific program names (e.g.,
O00020,WARMUP,SETUP01) - Separate multiple programs with commas
- These will be excluded from production metrics
Option 2: Regex Patterns
- Use Warmup Programs Regex field for pattern matching
- Example patterns:
^O0002.*- Excludes all programs starting with O0002.*WARMUP.*- Excludes any program containing "WARMUP"^(SETUP|TEST|CALIB).*- Excludes programs starting with SETUP, TEST, or CALIB
Example:
- Warmup Programs:
O00020, TOOL_SETTER - Warmup Programs Regex:
^SETUP.*
This configuration excludes:
- Programs named exactly "O00020" or "TOOL_SETTER"
- Any program starting with "SETUP" (SETUP01, SETUP_MILL, etc.)
See Also:
- System Settings Guide - Virtual Part Counter for detailed configuration
- Production Analytics Guide for using part count data in reports
8. Warning and Failure Thresholds Tab
Configure machine status colors based on performance or condition thresholds.
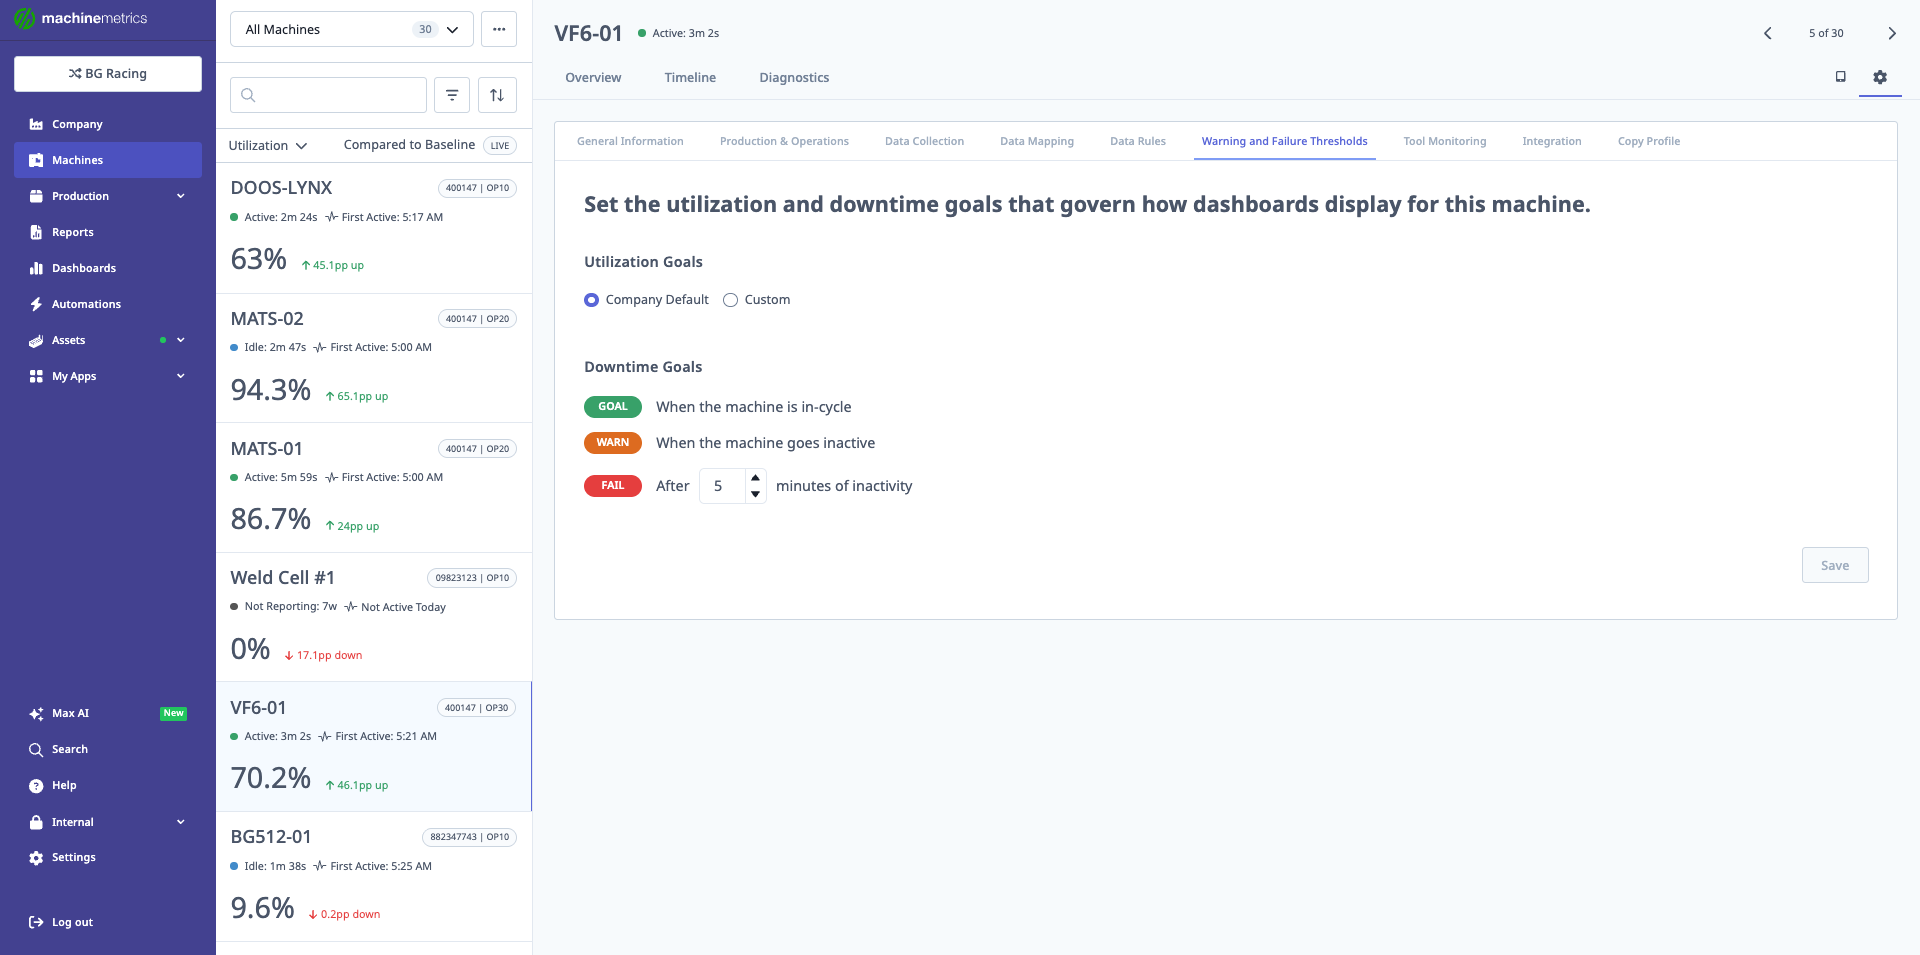
The Warning and Failure Thresholds tab sets the utilization and downtime goals that determine machine status colors on dashboards. In this example, utilization goals use Company Default settings, and downtime goals are configured with GOAL (green) when in-cycle, WARNING (orange) when inactive, and FAIL (red) after 5 minutes of inactivity. These thresholds help quickly identify underperforming machines.
8.1 Status Colors
Define the rules that determine when the machine appears:
- Green – Healthy / within target thresholds.
- Orange – Warning / approaching a limit.
- Red – Failure or outside acceptable thresholds.
8.2 Per-Machine vs Company Default
You can:
- Use company default thresholds:
- For consistent behavior across all machines.
- Or configure machine-specific thresholds:
- When machines have unique performance expectations or capabilities.
9. Tool Monitoring and Integration Tabs
Appear based on enabled features and purchased modules.
9.1 Tool Monitoring
- Visible when Tool Anomaly Detection is purchased.
- Use this tab to:
- Configure tool monitoring parameters.
- Define thresholds for detecting anomalies.
- Adjust alerting behavior related to tool health.
9.2 Integration
- Manage external integrations affecting this machine, such as:
- ERP systems
- Other third-party systems
- Actual options depend on:
- Which integrations are enabled for your account.
10. Configuration Checklist
Use this checklist when setting up or auditing a machine in MachineMetrics:
-
Machine added via Assets → Machines
-
For CSV imports, columns are correctly formatted (case sensitive):
machineName(required),machineMake,machineModel,serial,year,edgeSerialNumber,ipAddress(all optional exceptmachineName) -
System attempted auto-detection of connection type after Save and Connect
-
Any machines labeled Needs connecting have:
- Data Collection Method manually set
- Connection address entered
- Adapter script configured (if needed)
-
Machine appears with correct connection status, IP, and collection method
-
General Information:
- Machine name, type, make, model, year, serial set
- Machine schedule assigned
- Benchmarking participation decided
- Notes field updated with setup and context
- Controller make/model entered
-
Production & Operations:
- Manage jobs in set (ShopPulse vs ERP Driven) per your workflow
- Record labor as and Schedule jobs as mapped when using MES or preparing for MES
- Jobs selected by set (Operator vs Program) when ShopPulse is selected; Program path reviewed against APM defaults
- Optional MES features (first article inspection, shift handover) decided and toggled if needed
- MES enabled only after mappings are complete and operators notified (enable/disable stops active work on that machine)
-
Data Collection:
- Correct connection type selected (FANUC, MTConnect, OPC UA, etc.)
- Connection address verified
- Adapter script configured and working
- Transforms configured where needed (In → Process → Out)
-
Data Mapping:
- Program items mapped as
program - Part count items mapped as
part count - Execution items mapped as
execution - Important signals not left unmapped
- Mapping exported/imported if using AI-generated mapping from PLC tags
- Program items mapped as
-
Data Rules:
- Program metric selected for dashboards
- Select Part Count Metric set to the correct option:
- Default (part_count) for standard controller counting
- Haas M30-Counter if experiencing double counts on Haas machines
- Virtual Part Counter if controller counter is unreliable
- Production Run for high mix/low volume with manual interventions
- Manual Counter for manual stations only
- Verified no double counting (only one counter selected, check Data Mapping)
-
Warning and Failure Thresholds:
- Machine-specific or company default thresholds chosen
- Status color rules (green/orange/red) aligned with operational expectations
-
Tool Monitoring (if licensed):
- Tool anomaly detection configured
- Tool thresholds defined
-
Integration:
- ERP and other integrations configured (if applicable)
- ERP Driven job mode used where shop floor work is owned entirely in the ERP (see Section 4)
11. Decommissioning and Restoring Machines
11.1 What Decommissioning Does
Decommissioning a machine removes it from your active machine list in MachineMetrics. The machine will no longer appear in dashboards, shop floor boards, or live views.
Historical data is retained. All production data collected before decommissioning remains available in reporting. You will still be able to run historical reports that include the machine's past activity.
Once a machine is decommissioned, it cannot be restored to its previous state. If you need the machine active again, you must add it back as a new machine. Review section 11.3 before proceeding.
11.2 When to Decommission
Decommission a machine when:
- The machine has been permanently removed from your facility
- The machine is sold or scrapped
- You are replacing a machine with a new one and no longer need the old record
Do not decommission if the machine is only temporarily offline (maintenance, repairs, relocation). Simply disconnecting the data collection method is sufficient for temporary downtime.
11.3 How to Decommission a Machine
Prerequisites:
- Confirm you no longer need this machine to appear in live dashboards or reports
- Confirm you do not intend to reconnect this specific machine record
Steps:
- Go to Assets → Machines
- Select the machine you want to decommission
- Click the gear icon (top-right) to open Machine Settings
- Navigate to the General Information tab
- Click Decommission at the bottom-left of the page
- Confirm the action when prompted
[SCREENSHOT NEEDED: General Information tab with Decommission button highlighted at bottom-left]
The machine will be removed from your active list immediately.
11.4 Adding a Decommissioned Machine Back
If a machine needs to return to active monitoring after being decommissioned, add it back as a new machine. The previous machine record cannot be restored, but all historical data from the original machine remains in your reports.
Steps:
- Go to Assets → Machines
- Click Add Machine (top-right corner)
- Enter the machine details:
- Machine Name — use the same name as before if you want consistent reporting labels
- IP Address — confirm this matches the current network configuration
- Edge Device — select the Edge device the machine is connected to
- Click Save and Connect
- If the connection type is not auto-detected, click Needs connecting and configure the Data Collection Method manually (see Section 2.1)
- Reconfigure any custom settings:
[SCREENSHOT NEEDED: Add Machine dialog showing Machine Name, IP Address, and Edge Device fields]
The new machine record will have its own data history starting from the date it is re-added. The original machine's historical data remains accessible in reports but is stored under the old machine record. If consistent reporting across both periods is important to you, contact support@machinemetrics.com for guidance.
11.5 Common Questions
Will my historical reports break if I decommission a machine? No. Historical production data is retained and will continue to appear in reports for the decommissioned machine.
Can I duplicate an existing machine's settings before decommissioning? Yes. Before decommissioning, use the Duplicate option on the Assets → Machines page to copy the machine's configuration. You can then use the duplicate as the starting point when re-adding the machine.
I accidentally decommissioned a machine — what do I do? Contact support@machinemetrics.com as soon as possible. While decommissioning cannot be reversed through the UI, the support team may be able to assist depending on how recently it occurred.
Related Articles
- Connectivity Overview — Choose the right connection method
- FOCAS Connectivity Guide — Fanuc machine connections
- MTConnect Connectivity Guide — MTConnect protocol setup
- OPC-UA Connectivity Guide — OPC-UA configuration