Downtime & Quality Guide
Overview
What is Downtime & Quality Tracking?
Downtime & Quality Tracking provides visibility into when machines stop producing (downtime) and why parts are rejected (quality issues).
Key Capabilities:
- Automatic downtime detection: MachineMetrics detects when machines stop producing
- Categorization: Assign reasons to downtime events (maintenance, material, operator, etc.)
- Quality tracking: Log rejected parts with specific reasons
- OEE calculation: Downtime and quality directly affect OEE components
- Root cause analysis: Identify top downtime and quality issues for improvement
Why Track Downtime & Quality:
- Understand what's causing lost production time
- Identify improvement opportunities (80/20 rule)
- Calculate accurate OEE (Availability, Performance, Quality)
- Enable automated workflows (notify maintenance, material handlers)
- Track improvement initiatives (before/after comparisons)
Who Uses This:
- Operators: Categorize downtime and reject parts in real-time
- Supervisors: Review and categorize uncategorized events
- Maintenance Teams: Analyze downtime by reason, respond to alarms
- Quality Teams: Track reject reasons, identify quality trends
- Continuous Improvement Teams: Use Pareto charts to prioritize initiatives
- Executives: Monitor OEE components, track improvement progress
Downtime Tracking
What is Downtime?
Downtime is any period when a machine leaves a productive state (in-cycle) and enters an idle state.
Downtime Types:
- Planned Downtime: Scheduled events (breaks, PM, shift meetings)
- Unplanned Downtime: Unscheduled events (breakdowns, waiting for material, alarms)
- Microstops: Very short stops (< configurable threshold, e.g., 60 seconds)
- Long Downtime: Stops exceeding microstop threshold
Key Distinction:
- Planned vs. Unplanned affects how downtime is reported (separate categories in reports)
- Both affect OEE Availability equally (see Impact on OEE)
Automatic Downtime Tracking (ADT)
How ADT Works: MachineMetrics automatically detects downtime without operator input.
Detection Process:
- MachineMetrics monitors machine state continuously
- Machine transitions from in-cycle (producing) to idle (stopped)
- Downtime event begins (timestamp recorded)
- Machine resumes production (downtime event ends, timestamp recorded)
- Event stored with duration and timestamps
No Operator Input Required for Detection:
- Downtime detection is automatic
- Classification (assigning reasons) can be automatic or manual
Benefits:
- 100% capture of downtime events
- Precise timestamps (to the second)
- No operator burden for detection
- Real-time visibility into machine status
Downtime States
Machine States:
- Active (In-Cycle): Machine is producing parts
- Inactive (Idle): Machine is stopped (downtime)
- Disconnected: No data from machine (connectivity issue)
- Setup: Machine in setup mode (if activity tracking enabled)
State Visualization:
- Color-coded on dashboards:
- Green: Active
- Yellow: Inactive
- Red: Disconnected or Alarm
- Blue: Setup
- Timelines show state changes over time
- See Timelines Dashboard
Downtime Categories
What are Downtime Categories?
Downtime Categories (also called "Downtime Reasons") classify downtime events by root cause.
Purpose:
- Understand why downtime occurred
- Enable root cause analysis (Pareto charts)
- Trigger automated workflows (notify specific personnel)
- Track improvement initiatives
Example Categories:
- Setup/Changeover
- Waiting for Material
- Waiting for Operator
- Tooling Issues
- Maintenance (Planned, Unplanned)
- Quality Issues
- Operator Break
- Facility Issues (power, air pressure)
- Uncategorized
Downtime Category Hierarchy
Hierarchical Structure: Downtime categories can have multiple levels (parent → subcategory → sub-subcategory).
Format: Use pipe (|) separator
Parent | Subcategory | Sub-subcategory
Examples:
Tooling | Tool Change | End of Life
Tooling | Tool Break | Complete Break
Tooling | Tool Unavailable

Maintenance | Planned Maintenance | PM Schedule
Maintenance | Unplanned Maintenance | Breakdown

Material | Material Unavailable
Material | Incorrect Material
Benefits of Hierarchy:
- Broad Analysis: View all "Tooling" issues
- Specific Analysis: Drill down to "Tool Break" → "Complete Break"
- Targeted Workflows: Notify maintenance for "Tool Break", notify tool crib for "Tool Unavailable"
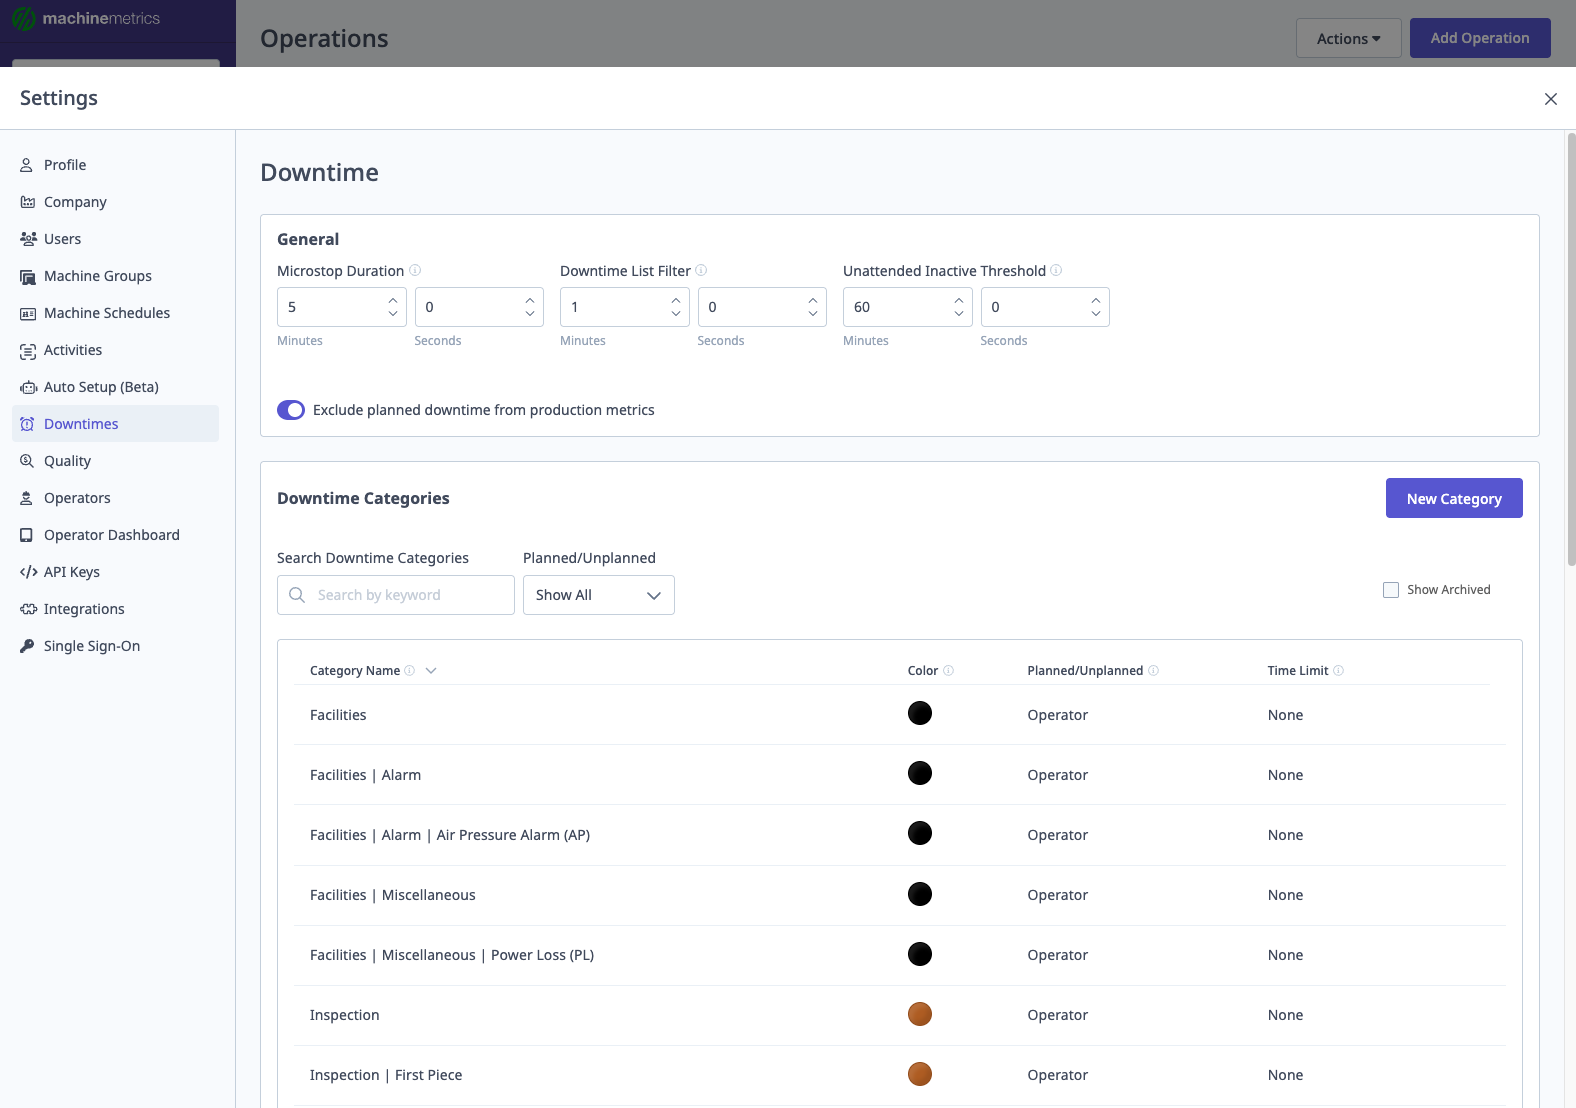
Configuring Downtime Categories
Access:
- Navigate to Settings → Downtimes → Downtime Categories
- Click "+ New Category"
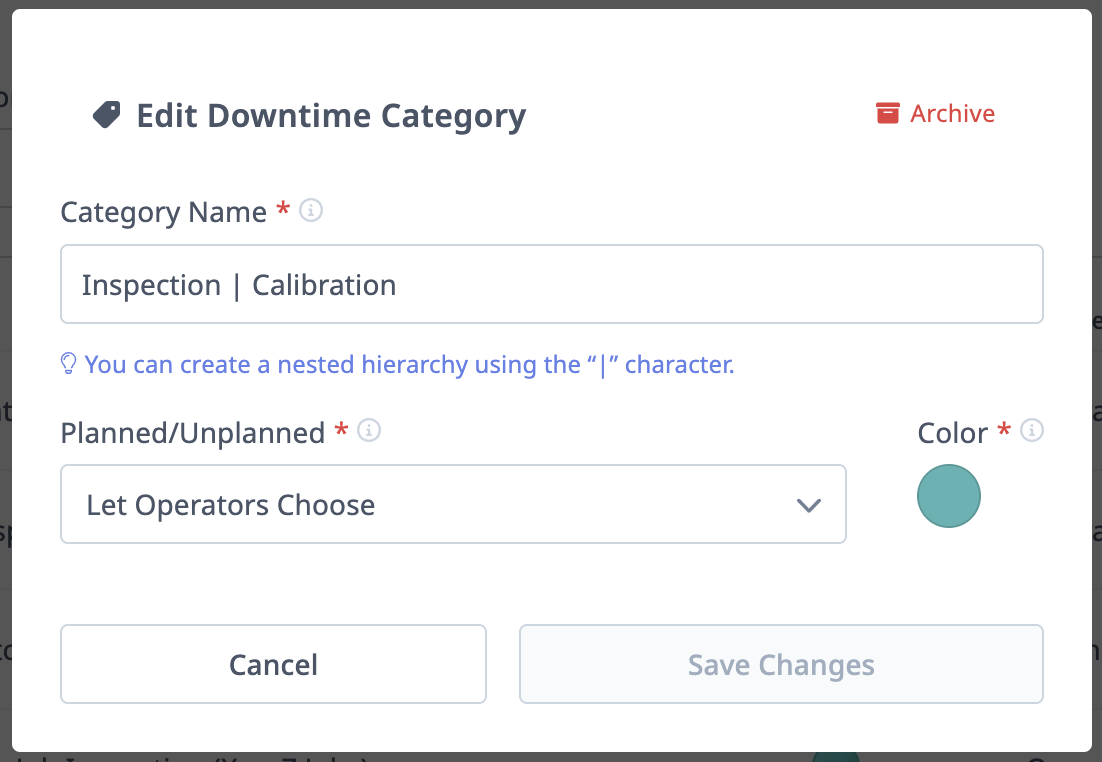
Fields:
1. Category Name
- Enter name
- For hierarchy: Use
|separator (e.g.,Tooling | Tool Break) - Important: Each level requires its own entry
- Create parent:
Tooling - Create subcategory:
Tooling | Tool Break - Create sub-subcategory:
Tooling | Tool Break | Complete Break
- Create parent:
2. Planned/Unplanned Behavior
- Planned or Unplanned: Operator chooses when categorizing
- Unplanned: Always marked as unplanned
- Planned: Always marked as planned
- Planned with Limit: Planned up to X minutes, then becomes unplanned
- Example: "Operator Break" planned for 15 minutes; if break exceeds 15 minutes, excess is unplanned
3. Color
- Assign color for visual identification (dashboards, reports, timelines)
- Use consistent colors for related categories
4. Archive
- Archive obsolete categories (not deleted)
- Archived categories hidden from operator selection
- Historical data retained
Sample Downtime Categories
Best Practice Categories:
Facilities
  ├─ Air Pressure Alarm
  └─ Power Loss

Inspection
  ├─ First Piece
  └─ QA Inspection

Machine
  ├─ Calibration
  ├─ Alarm
  ├─ Planned Maintenance
  ├─ Unplanned Maintenance
  └─ Preventative Maintenance

Material
  ├─ Incorrect Material
  └─ Material Unavailable

Operator
  ├─ Break Period
  ├─ Manual Machining
  ├─ Operator Unavailable
  ├─ Running Multiple Machines
  ├─ Supervisor Interruption
  └─ Training

Process
  ├─ Part Changeover
  ├─ Offset Change Needed
  ├─ Program Support Needed
  └─ Setup

Tooling
  ├─ Tool Unavailable
  └─ Tool Change
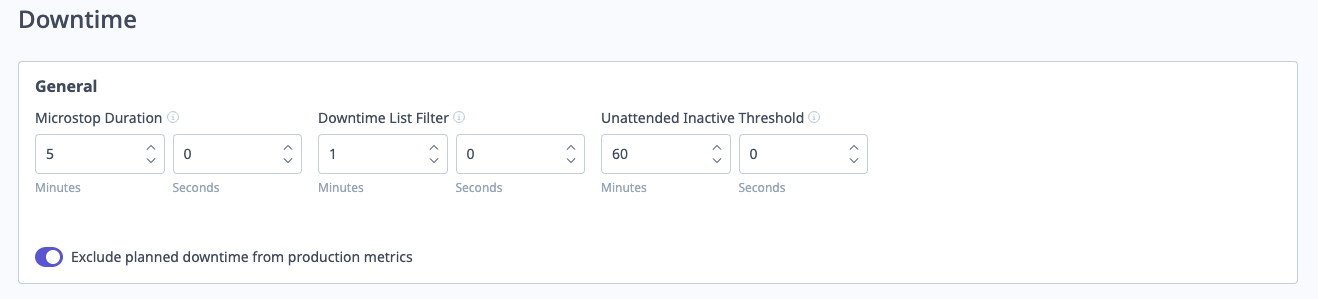
General Downtime Settings
Access: Settings → Downtimes → General
Key Settings:
1. Microstop Duration (seconds)
- Threshold separating microstops from long downtime
- Example: 60 seconds
- Stops < 60 sec = Microstops (typically not categorized)
- Stops ≥ 60 sec = Long downtime (prompted for categorization)
2. Downtime List Filter (seconds)
- Hides events shorter than this from operator categorization list
- Reduces clutter (operators don't see very short stops)
- Example: 30 seconds filters out stops < 30 sec
3. Unattended Inactive Threshold (minutes)
- During unattended shifts, how long machine can be idle before marked as "unscheduled"
- Affects Availability calculation
- Example: 30 minutes
- If idle > 30 min during unattended shift, time becomes unscheduled (doesn't hurt availability)
4. Exclude Planned Downtime from Production Metrics
- Toggle to exclude planned downtime from scheduled time
- Impact on OEE: See Impact on OEE section
- Enabled: Planned downtime excluded from Availability and Performance (not from Quality)
- Disabled: All downtime affects Availability equally
Automatic Downtime Classification
What is Automatic Downtime Classification (ADC)?
ADC automatically assigns downtime categories based on machine data (alarms, states, signals, schedules).
Benefits:
- No operator input required
- Consistent categorization
- Categorizes events operators can't see (overnight shifts, breaks)
- Reduces uncategorized downtime
Use Cases:
- Auto-classify breaks and lunch (scheduled)
- Auto-classify specific alarms (e.g., way lube low → Maintenance)
- Auto-classify based on machine states (e.g., door open → Setup)
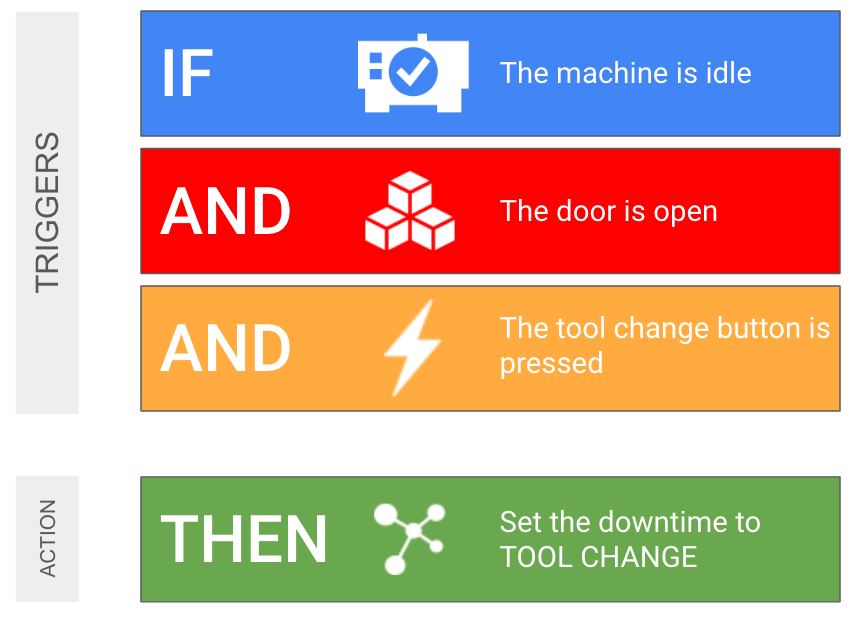
- Auto-classify based on PLC signals (e.g., tool release button → Tool Change)
How ADC Works
Rule-Based System: ADC uses rules with triggers and actions.
If [Trigger] Then [Categorize as X]
Example:
If Alarm Code = "P/S 101"
Then Categorize as "Maintenance | Way Lube Low"
Accessing ADC
Navigation:
- Click My Apps in sidebar
- Select Auto Downtime Lab
- Click "Downtime Rules" tab
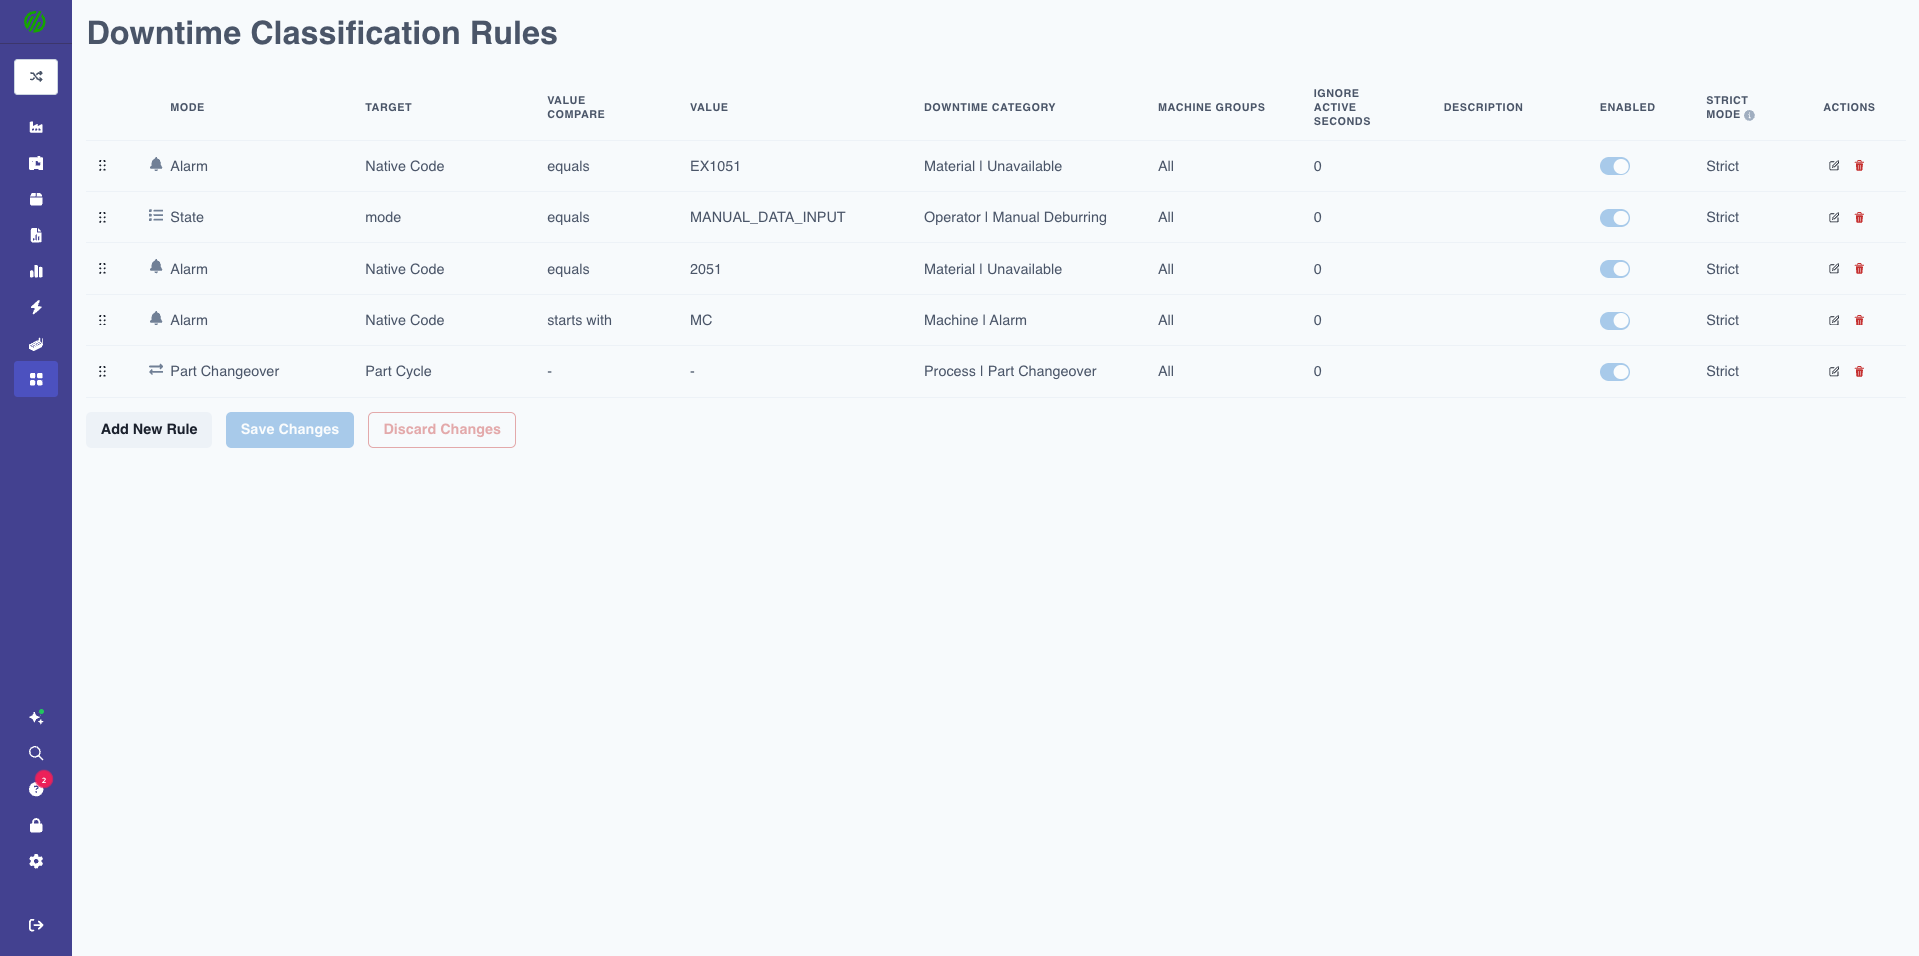
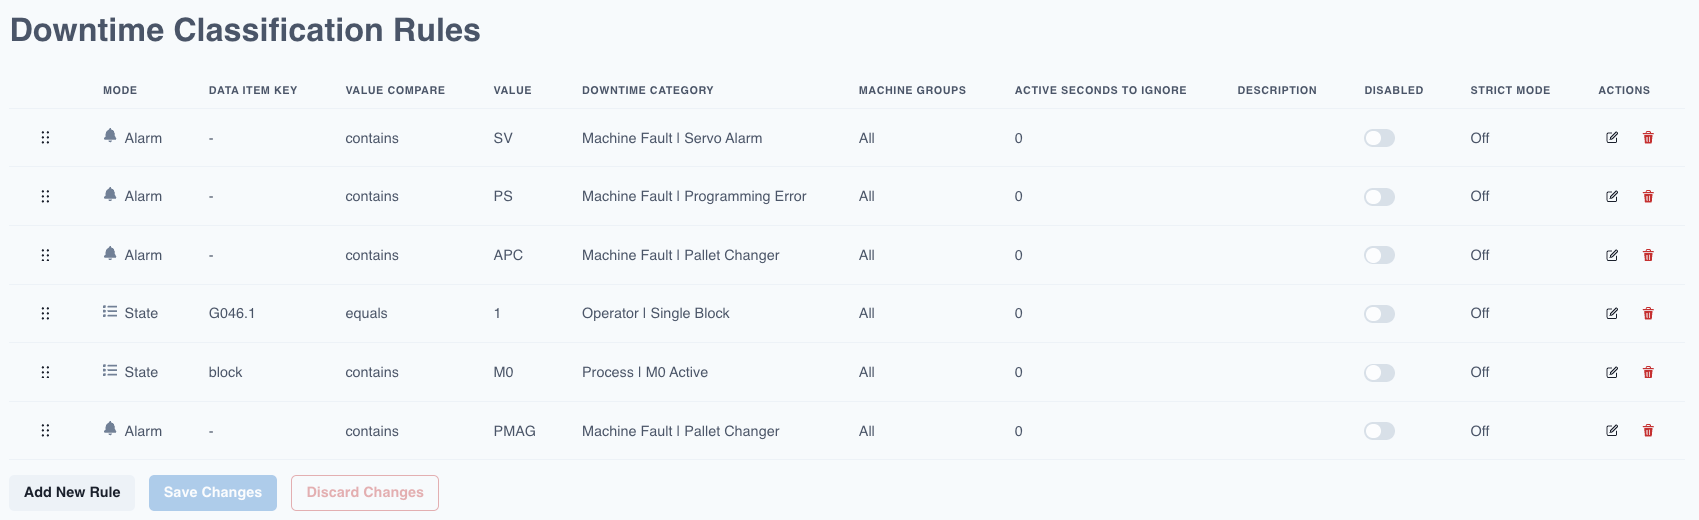
Creating ADC Rules
Step-by-Step:
1. Click "Create Rule"
2. Select Trigger Type:
- Alarm: Match specific alarm codes
- Alarm-message: Match text within alarm descriptions
- State: Use live state of diagnostic data items
- IO/PLC Signals: Match specific I/O addresses
- Time-based: Scheduled events (cron expressions)
- Setup: Setup activities
3. Configure Trigger:
- Comparison operator: Equals, Contains, Starts With, Greater Than, Less Than, etc.
- Value to match: Alarm code, text string, state value, etc.
4. Select Downtime Category:
- Choose from configured downtime categories
5. Configure Mode:
- Off: Rule disabled
- Normal: Applies category to full downtime duration
- Strict Start: Starts category when trigger activates (even mid-downtime)
- Strict End: Ends category when trigger deactivates
- Strict: Category only applied while trigger is active (precise boundaries)
6. Set Active Seconds to Ignore (optional):
- Prevents rule from firing if state change is very brief
- Example: 5 seconds = ignore state changes < 5 seconds
7. Click "Save"
ADC Trigger Types
Trigger Type 1: Alarm
Use Case: Categorize downtime based on specific alarm codes.
Configuration:
- Trigger: Alarm
- Comparison: Is Equal To, Starts With, Contains
- Value: Alarm code (e.g., "P/S 101")
- Category: Downtime category to apply
Example:
If Alarm = "P/S 101" (Way Lube Low)
Then Categorize as "Maintenance | Way Lube Low"
Mode: Normal
Benefits:
- Consistent categorization of known alarms
- No operator input required
- Enables automated workflows (notify maintenance)
Trigger Type 2: Alarm-message
Use Case: Categorize downtime based on text in alarm message (when codes aren't unique enough).
Configuration:
- Trigger: Alarm-message
- Comparison: Contains, Starts With, etc.
- Value: Text string (e.g., "coolant")
- Category: Downtime category to apply
Example:
If Alarm Message Contains "coolant"
Then Categorize as "Maintenance | Coolant Issue"
Mode: Normal
Trigger Type 3: State
Use Case: Categorize based on machine diagnostic data items (door open, tool released, etc.).
Configuration:
- Trigger: State
- Data Item: Select from available data items
- Comparison: Equals, Greater Than, etc.
- Value: State value
- Category: Downtime category to apply
Example:
If Data Item "Door Status" = "Open"
Then Categorize as "Operator | Door Open"
Mode: Strict (only while door is open)
Common State Triggers:
- Door open/closed
- Chuck open/closed
- Tool released
- Cycle stop button pressed
- Safety interlock triggered
Trigger Type 4: IO/PLC Signals
Use Case: Categorize based on PLC signals or I/O addresses.
Configuration:
- Trigger: IO
- Address: PLC address or I/O channel
- Comparison: Equals, Greater Than, etc.
- Value: Signal value
- Category: Downtime category to apply
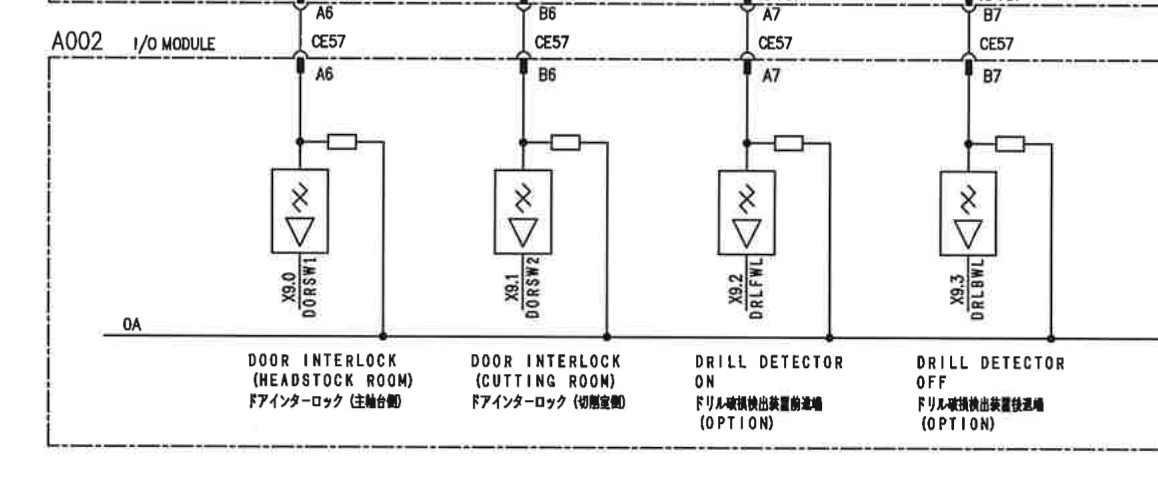
Example:
If IO Address "DI1" = 1 (Tool release button pressed)
Then Categorize as "Tooling | Tool Change"
Mode: Strict (only while button is pressed)
Note: Requires PLC connectivity or I/O module (Sealevel, Advantech, LabJack).
Trigger Type 5: Time-based (Scheduled)
Use Case: Auto-categorize scheduled events (breaks, lunch, shift meetings).
Configuration:
- Trigger: Time-based
- Cron Expression: Defines schedule (e.g., "every day at 10 AM for 15 minutes")
- Category: Downtime category to apply
- Mode: Strict (recommended for precise timing)
Example:
Trigger: Time-based
Cron: "0 10 * * *" (Every day at 10 AM)
Duration: 15 minutes
Category: "Operator | Break Period"
Mode: Strict
Cron Expression Format:
* * * * *
│ │ │ │ │
│ │ │ │ └─ Day of week (0-6, Sunday = 0)
│ │ │ └─── Month (1-12)
│ │ └───── Day of month (1-31)
│ └─────── Hour (0-23)
└───────── Minute (0-59)
Common Cron Examples:
0 10 * * *: Every day at 10:00 AM0 12 * * 1-5: Monday-Friday at 12:00 PM (lunch)30 14 * * *: Every day at 2:30 PM
Important: Always use Strict mode for scheduled events to prevent overlapping or extended classifications.
Trigger Type 6: Setup
Use Case: Categorize downtime during setup activities.
Configuration:
- Trigger: Setup
- Setup Activity Type: Select activity type (if Setup Stages enabled)
- Category: Downtime category to apply
Example:
If Setup Activity = "First Article Inspection"
Then Categorize as "Inspection | First Piece"
Mode: Strict
Understanding Rule Modes (Strict vs. Normal)
Rule Mode controls how the downtime category boundaries are applied relative to the trigger event. Choosing the correct mode is critical for accurate categorization.
Mode Options
| Mode | Start Behavior | End Behavior | Best For |
|---|---|---|---|
| Off | Rule disabled | Rule disabled | Temporarily disabling rules |
| Normal | Start of downtime | End of downtime | General categorization (alarms, issues) |
| Strict | When trigger activates | When trigger deactivates | Precise events (breaks, specific states) |
| Strict Start | When trigger activates | End of downtime | Events with known start, variable end |
| Strict End | Start of downtime | When trigger deactivates | Events with variable start, known end |
Mode: Off
Rule is disabled and will not fire.
Use Case: Temporarily disable a rule without deleting it.
Mode: Normal (Non-Strict)
Category is applied to the entire downtime event that contains the trigger.
Behavior:
- Category starts at the beginning of the downtime (when machine went idle)
- Category ends at the end of the downtime (when machine resumes)
- Trigger just determines which category to apply
Example:
Scenario: Machine goes idle at 1:00 PM
          Alarm "Way Lube Low" fires at 1:05 PM
          Machine resumes at 1:30 PM

Rule: If Alarm = "Way Lube Low" → Categorize as "Maintenance"
Mode: Normal

Result: Downtime from 1:00 PM to 1:30 PM categorized as "Maintenance"
        (Full 30 minutes, not just from alarm time)
Best For:
- Alarms that explain the entire downtime
- General categorization where you want the full event captured
- When the trigger may occur slightly after downtime starts
Mode: Strict
Category is applied only while the trigger is active.
Behavior:
- Category starts exactly when trigger condition becomes true
- Category ends exactly when trigger condition becomes false
- Downtime before/after trigger remains uncategorized (or categorized by other rules)
Example:
Scenario: Scheduled break from 12:00 PM to 12:30 PM
          Machine was idle from 11:55 AM to 12:35 PM

Rule: If Time Window = "12:00-12:30" → Categorize as "Break"
Mode: Strict

Result:
- 11:55 AM to 12:00 PM: Uncategorized (or other rule)
- 12:00 PM to 12:30 PM: "Break" (exactly 30 minutes)
- 12:30 PM to 12:35 PM: Uncategorized (or other rule)
Best For:
- Scheduled events (breaks, meetings, shift changes)
- State-based triggers with precise boundaries (door open, chuck open)
- When you need exact timing accuracy
Mode: Strict Start
Category starts when trigger activates, but ends when downtime ends (machine resumes).
Behavior:
- Category starts exactly when trigger condition becomes true
- Category ends when machine resumes running (normal end of downtime)
- Useful when you know when an event started but not when it will end
Example:
Scenario: Machine goes idle at 1:00 PM
          Operator presses "Tool Change" button at 1:10 PM
          Machine resumes at 1:45 PM

Rule: If Button = "Tool Change" → Categorize as "Tool Change"
Mode: Strict Start

Result:
- 1:00 PM to 1:10 PM: Uncategorized
- 1:10 PM to 1:45 PM: "Tool Change" (from button press to machine running)
Best For:
- Events triggered by operator action
- Situations where the trigger marks the start but the duration is variable
- Tool changes, part changeovers, quality holds
Mode: Strict End
Category starts at beginning of downtime, but ends when trigger deactivates.
Behavior:
- Category starts when downtime begins (machine goes idle)
- Category ends exactly when trigger condition becomes false
- Useful when you know when an event ended but not when it started
Example:
Scenario: Machine goes idle at 1:00 PM
          Safety interlock active from before 1:00 PM
          Interlock released at 1:20 PM
          Machine resumes at 1:25 PM

Rule: If Interlock = Active → Categorize as "Safety"
Mode: Strict End

Result:
- 1:00 PM to 1:20 PM: "Safety" (from downtime start to interlock release)
- 1:20 PM to 1:25 PM: Uncategorized (or other rule)
Best For:
- Events where the trigger was already active when downtime began
- Situations where clearing a condition marks a transition
- Safety interlocks, material waiting conditions
Mode Decision Guide
Use this flowchart to choose the right mode:
-
Is the trigger timing precise?
- NO → Use Normal mode
- YES → Continue to #2
-
Do you need the category to match the trigger exactly?
- YES → Use Strict mode
- NO → Continue to #3
-
Which boundary is important?
- Start is important (trigger marks beginning) → Use Strict Start
- End is important (trigger marks ending) → Use Strict End
Saving Rules
Important: ADC rules require two save actions:
- Save the individual rule: Click the green checkmark (✓) at the end of the rule row
- Save all changes: Click "Save Changes" at the bottom of the page
If you only click the checkmark but not "Save Changes," your rules will be lost when you navigate away.
Enabling/Disabling Rules:
- Toggle the Enabled switch on each rule row
- Remember to click "Save Changes" after toggling
ADC Best Practices
1. Keep Rules Simple
- Use minimum triggers required
- Avoid overly complex logic
- Test one rule at a time
2. Prioritize High-Value Events
- Focus on repeatable, high-frequency downtime
- Examples: Breaks, common alarms, tool changes
- Don't create rules for rare, one-off events
3. Use Strict Mode Appropriately
- Strict: For events with precise boundaries (breaks, specific state changes)
- Normal: For events where full downtime should be categorized (alarms, general issues)
4. Set Active Seconds to Ignore
- Prevents false triggers from brief state changes
- Example: 5 seconds for door state (ignore quick door open/close)
5. Document Your Rules
- Maintain list of PLC addresses and their meanings
- Note which data items are used for which rules
- Update documentation when rules change
6. Validate Results
- Review Timelines Dashboard after creating rule
- Check if downtime is categorized as expected
- Adjust rule if needed
Manual Downtime Categorization
Why Manual Categorization?
Not All Downtime Can Be Auto-Classified:
- ADC requires known, repeatable triggers
- Some downtime is unpredictable (ad-hoc issues)
- Operators have context machines don't (e.g., "waiting for forklift")
Manual Categorization:
- Operators select downtime reason from tablet
- Supervisors can categorize retroactively
Operator Categorization (Real-Time)
Three Methods:
Method 1: Current Downtime Pop-Up (Most Common)
When: Pop-up appears on Operator Dashboard when downtime exceeds "Long" threshold.
Steps:
- Pop-up appears in bottom right of tablet
- Operator taps "Categorize"
- Selects downtime reason from list
- (Optional) Adds note for context
- Taps "Save"
- Downtime categorized
Benefits:
- Immediate (while event is fresh)
- Most accurate (operator knows exactly what happened)
- Reduces uncategorized downtime
See Also: Categorizing Downtime in Operator Dashboard Guide
Method 2: Categorize Button (On-Demand)
When: Operator wants to categorize events later (didn't categorize immediately).
Steps:
- Tap "Categorize" button in Navigation Bar (shows red badge with count)
- List of uncategorized events appears
- Select event to categorize
- Choose downtime reason
- (Optional) Add note
- Tap "Save"
Use Case:
- Operator was busy during downtime (dismissed pop-up)
- Reviewing downtime at end of shift
Method 3: All Downtime Tab
When: Reviewing all downtime for shift (categorized and uncategorized).
Steps:
- Open "All Downtime" tab on Operator Dashboard
- Filter to show uncategorized events
- Tap uncategorized event
- Select downtime reason
- (Optional) Add note
- Tap "Save"
Use Case:
- End-of-shift review
- Identifying patterns (multiple events of same type)
Supervisor Categorization (Retroactive)
Who: Managers, Executives, or operators (retroactively categorize past events)
Where:
- Operator Dashboard: Access from web or tablet
- Timelines Dashboard: Visual timeline view (web only)
Timelines Dashboard (Preferred for Batch):
- Navigate to Dashboards → Timelines
- Select date range and machines
- Uncategorized downtime shown (yellow segments without labels)
- Click segment to open detail panel
- Select downtime category
- (Optional) Add note
- Click "Save"
- Segment updates with category and color
Batch Categorization:
- Select multiple segments (if same reason)
- Apply category to all at once
- Saves time for repetitive categorization
See Also: Timelines Dashboard
Adding Notes to Downtime
Purpose:
- Provide additional context
- Explain root cause
- Track corrective actions taken
Example Notes:
- "Waiting for bar stock delivery from warehouse"
- "Tool #3 broke at 2:30 PM - replaced with backup"
- "Setup taking longer due to complex fixture alignment"
- "Operator training new employee on setup procedure"
Where Notes Appear:
- Downtime Reports (Events Table)
- Timelines Dashboard (click event for details)
- Downtime analysis exports (CSV)
Quality Tracking
What is Quality Tracking?
Quality Tracking logs rejected parts during production, enabling root cause analysis of quality issues.
Key Capabilities:
- Operators reject parts in real-time (Operator Dashboard)
- Quality team adjusts rejected parts retroactively (post-inspection)
- Reject reasons hierarchy (parent → subcategory)
- Quality affects OEE (Quality component)
- Quality reports (Pareto charts, trends)
Rejecting Parts (Real-Time)
Operator Workflow:
- Operator identifies rejected part(s)
- Taps "Reject Parts" button on Operator Dashboard (available from any tab)
- Enters number of parts to reject
- Selects reject reason from hierarchy
- Chooses Scrap or Non-Conforming
- (Optional) Adds note for context
- Taps "Save"
Example:
Quantity: 3
Reason: Quality Issues → Out of Tolerance → Dimension A Oversize
Type: Scrap
Note: "Measured 1.005", spec is 1.000" ±0.002""
See Also: Parts Produced and Rejected in Operator Dashboard Guide
Adjusting Rejected Parts (Retroactive)
When: Quality inspection occurs after production (post-job inspection).
Who: Quality Management Team, Managers, Executives
Where: Machine Quality page or Parts tab on Machine Overview
Step-by-Step:
- Navigate to Machines → Select Machine
- Click Quality tab or Parts tab
- Find production run to adjust
- Click "Adjust Rejected Parts"
- Enter quantity:
- Positive number: Add rejects (e.g., +5 = 5 more rejects)
- Negative number: Remove rejects (e.g., -2 = remove 2 rejects, corrects over-rejection)
- Select reject reason
- Choose Scrap or Non-Conforming
- Remove from Good Parts checkbox:
- Checked: Rejected parts subtracted from good parts count
- Unchecked: Good parts count unchanged (if already accounted for)
- (Optional) Add note
- Click "Save"
Use Cases:
- Post-production inspection finds additional rejects
- Operator over-rejected (correct by entering negative number)
- Rework parts initially rejected but later fixed (adjust count)
[Recommended Image]: Screenshot of Adjust Rejected Parts interface
Scrap vs. Non-Conforming
Scrap:
- Part is unusable
- Cannot be reworked
- Total loss
Non-Conforming:
- Part is outside spec
- May be reworked or used with deviation approval
- Potential recovery
Configuration: Reject reasons can have fixed behavior (always Scrap or always Non-Conforming) or let operator choose.
Reject Reasons
What are Reject Reasons?
Reject Reasons classify why parts are rejected.
Purpose:
- Root cause analysis (identify top quality issues)
- Pareto charts (80/20 rule)
- Targeted improvement initiatives
- Track quality improvement over time
Example Reject Reasons:
- Dimensional Issues
- Surface Finish
- Cosmetic Defects
- Tool Issues (dull tool, tool break)
- Process Issues (incorrect speeds/feeds)
- Material Issues (material defect)
Reject Reason Hierarchy
Hierarchical Structure:
Same as downtime categories, using pipe (|) separator.
Format:
Parent | Subcategory | Sub-subcategory
Examples:
Dimensional | Out of Specification | Groove | Diameter Big
Dimensional | Out of Specification | Groove | Diameter Small
Dimensional | Out of Specification | Drill | Hole Size Big
Dimensional | Out of Specification | Drill | Hole Size Small

Surface Finish | Rough Surface
Surface Finish | Scratches

Tooling Issues | Dull Tool
Tooling Issues | Tool Break
Tooling Issues | Wrong Tool

Material Issues | Material Defect
Material Issues | Incorrect Material
Benefits:
- Broad Analysis: View all "Dimensional" issues
- Specific Analysis: Drill down to "Diameter Big" for specific feature
- Targeted Improvements: Focus on specific root causes
Configuring Reject Reasons
Access:
- Navigate to Settings → Quality → Reject Reasons
- Click "+ Add Reason"
Fields:
1. Reason Name
- Enter name
- For hierarchy: Use
|separator (e.g.,Dimensional | Out of Specification) - Important: Each level requires its own entry
- Create parent:
Dimensional - Create subcategory:
Dimensional | Out of Specification - Create sub-subcategory:
Dimensional | Out of Specification | Groove
- Create parent:
2. Scrap/Non-Conforming Behavior
- Scrap or Non-Conforming: Operator chooses
- Scrap: Always marked as scrap
- Non-Conforming: Always marked as non-conforming
3. Color
- Assign color for visual identification (reports, dashboards)
4. Archive
- Archive obsolete reasons (not deleted)
- Archived reasons hidden from operator selection
- Historical data retained
[Recommended Image]: Screenshot of Reject Reasons configuration interface
Sample Reject Reasons
Best Practice Hierarchy:
Dimensional
  ├─ Out of Specification
  │   ├─ Groove
  │   │   ├─ Diameter Big
  │   │   └─ Diameter Small
  │   ├─ Drill
  │   │   ├─ Hole Size Big
  │   │   └─ Hole Size Small
  │   └─ Thread
  │       ├─ Pitch Out of Spec
  │       └─ Depth Out of Spec

Surface Finish
  ├─ Rough Surface
  ├─ Scratches
  └─ Chatter Marks

Cosmetic
  ├─ Burrs
  ├─ Chips/Nicks
  └─ Discoloration

Tooling Issues
  ├─ Dull Tool
  ├─ Tool Break
  └─ Wrong Tool

Material Issues
  ├─ Material Defect
  └─ Incorrect Material

Process Issues
  ├─ Incorrect Program
  ├─ Incorrect Speeds/Feeds
  └─ Incorrect Setup
Impact on OEE
OEE Components
OEE Formula:
OEE = Availability × Performance × Quality
Three Components:
- Availability: Running time vs. scheduled time
- Performance: Ideal cycle time vs. actual cycle time
- Quality: Good parts vs. total parts produced
How Downtime Affects OEE
Availability Component:
Availability = (Running Time / Scheduled Time) × 100%
Key Points:
- All downtime reduces Availability (planned, unplanned, uncategorized)
- Categorizing downtime (planned vs. unplanned) does NOT change OEE calculation
- Categorization is for reporting and analysis only
- Planned and unplanned downtime affect Availability equally
- Setup impact: Planned setup can be excluded from scheduled time (configuration setting)
- If excluded: Planned setup does not hurt Availability or Performance
- If not excluded: Planned setup reduces Availability
Performance Component:
Performance = (Ideal Cycle Time / Actual Cycle Time) × 100%
Key Points:
- Downtime does not directly affect Performance
- Performance is calculated only over scheduled time (excluding planned setup if configured)
- Slow cycles (not downtime) reduce Performance
Quality Component:
- Not affected by downtime
- Only affected by rejected parts (see below)
How Quality Affects OEE
Quality Component:
Quality = (Good Parts / Total Parts Produced) × 100%
Key Points:
- Rejected parts directly reduce Quality
- Quality calculated over entire scheduled period (including setup if configured)
- 100% Quality = no rejects
- Examples:
- 200 total parts, 150 good, 50 rejected = 75% Quality
- 100 total parts, 100 good, 0 rejected = 100% Quality
Impact on OEE:
Example:
Availability: 80%
Performance: 90%
Quality: 75%

OEE = 0.80 × 0.90 × 0.75 = 0.54 = 54%
If Quality improves to 90%:
OEE = 0.80 × 0.90 × 0.90 = 0.648 = 64.8%
Key Insight:
- Even small quality improvements significantly impact OEE
- Reducing rejects is often fastest way to improve OEE
Planned vs. Unplanned Downtime
Important Clarification:
Categorizing downtime as "Planned" vs. "Unplanned" does NOT change OEE calculation.
Purpose of Categorization:
- Reporting: Separate planned vs. unplanned in reports
- Analysis: Understand controllable (unplanned) vs. expected (planned) downtime
- Workflows: Trigger different actions based on category
- NOT for OEE: Both affect Availability equally
Exception: Planned Setup (if configured)
- Setting: "Exclude planned downtime from production metrics"
- If enabled: Planned setup excluded from scheduled time
- Does not hurt Availability or Performance
- Still included in Quality calculation
- If disabled: All downtime affects OEE equally
Aggregated OEE (Multiple Machines)
When viewing OEE for multiple machines, each component is weighted.
Formulas:
Aggregated Availability = Σ(Scheduled Time × Availability) / Σ(Scheduled Time)

Aggregated Performance = Σ(Ideal Part Time × Parts × Performance) / Σ(Ideal Part Time × Parts)

Aggregated Quality = Σ(Parts × Quality) / Σ(Parts)

Aggregated OEE = Aggregated Availability × Aggregated Performance × Aggregated Quality
Key Point: Weighted by scheduled time, ideal part time, and parts produced.
Downtime and Quality Reports
Downtime Report
Purpose: Analyze downtime patterns by category, machine, and time period.
Access: Navigate to Reports → Downtime
Report Sections:
1. Downtime Pareto Chart
- Bar chart showing top downtime categories
- Sorted by duration (minutes)
- Includes occurrences (count)
- Pareto line (cumulative percentage)
2. Downtime Events Table
- List of all downtime events
- Columns:
- Start Time: When downtime began
- Duration: Length of event
- Machine: Which machine
- Reason: Downtime category
- Message: Operator notes
- Planned: Planned/Unplanned status
- Sortable: Click column headers
- Searchable: Text search (Machine, Reason, Message)
- Clickable: Click event to categorize/recategorize
3. Downtime By Machine
- Stacked bar chart
- Each bar = one machine
- Colors = downtime categories
- Shows which machines have most downtime
Filters:
- Date/Time Range: Select period
- Machine or Machine Group: Filter to specific machines
- Shift: Filter to specific shift
- Include Uncategorized: Show/hide uncategorized downtime
Use Cases:
- Identify top downtime drivers (Pareto principle)
- Compare downtime across machines
- Track improvement initiatives (before/after)
- Justify capital investments (downtime reduction value)
See Also: Downtime Report
Quality Report
Purpose: Analyze rejected parts by reason and identify quality trends.
Access: Navigate to Reports → Quality
Report Sections:
1. Rejected Parts Pareto Chart
- Bar chart showing top reject reasons
- Sorted by count (number of parts)
- Pareto line (cumulative percentage)
2. Rejects Table
- List of all rejected parts
- Columns:
- Time: When reject occurred
- Machine: Which machine
- Job: Associated production run
- Part Count: Number of parts rejected
- Reason: Reject reason
- Message: Operator notes
- Type: Scrap or Non-Conforming
- Sortable: Click column headers
- Searchable: Text search
3. Rejects By Machine
- Table showing rejection data per machine
- Total rejects
- Breakdown by reject reason
Filters:
- Date/Time Range: Select period
- Machine or Machine Group: Filter to specific machines
- Shift: Filter to specific shift
- Rejection Reason: Filter to specific reason
Use Cases:
- Identify top quality issues (Pareto)
- Track scrap reduction initiatives
- Compare quality across machines/shifts
- Justify process improvements or tooling investments
See Also: Quality Report
OEE Report
Purpose: Analyze OEE and its components (Availability, Performance, Quality).
Access: Navigate to Reports → OEE
Report Sections:
1. Metric Summaries
- Percentages for:
- OEE
- Availability
- Performance
- Quality
- OOE (Overall Operations Effectiveness)
- TEEP (Total Effective Equipment Performance)
2. Line Chart
- OEE components over time
- Clickable metrics (show/hide)
- Trend visualization
3. Tables
- Shifts Table: OEE data by shift
- Machine Groups Table: OEE data by machine group
- Machines Table: OEE data per machine
- OEE Summary by Metric: Summary percentages
Filters:
- Date/Time Range: Select period
- Machine or Machine Group: Filter to specific machines
- Shift: Filter to specific shift
Use Cases:
- Track OEE trends over time
- Identify which component (A/P/Q) limits performance
- Compare shift performance
- Benchmark machines against each other
See Also: OEE Report and Understanding Your Data Guide
Report Builder (Custom Reports)
Purpose: Create custom reports combining downtime, quality, and other metrics.
Access: Navigate to Reports → Create Report
Capabilities:
- Select specific metrics (downtime by category, rejected parts, OEE components)
- Group by time, machine, shift, operation
- Filter to specific machines, shifts, date ranges
- Save and share reports
See Also: Report Builder
Best Practices
Downtime Tracking Best Practices
1. Categorize Downtime as It Occurs
- Most accurate when fresh
- Use operator pop-up (immediate method)
- Review uncategorized at end of shift
2. Use Clear, Intuitive Category Names
- Names should be obvious to operators
- Examples:
- ✅ "Waiting for Material"
- ✅ "Tool Change"
- ❌ "Category 1"
- ❌ "Misc"
3. Create Hierarchies for Granularity
- Parent categories for broad analysis
- Subcategories for specific root causes
- Don't go too deep (2-3 levels max)
4. Use ADC for Repeatable Events
- Breaks and lunch (scheduled)
- Common alarms (way lube, coolant)
- Known machine states (door open, tool release)
5. Review Uncategorized Downtime Weekly
- Identify patterns
- Create ADC rules for common events
- Batch categorize manually if needed
6. Train Operators on Why It Matters
- "Your input helps us improve"
- Show reports and improvements resulting from data
- Recognize operators who consistently categorize
7. Keep Microstop Threshold Reasonable
- Too low: Operators overwhelmed with pop-ups
- Too high: Miss significant downtime
- Recommended: 30-60 seconds
Quality Tracking Best Practices
1. Create Specific Reject Reasons
- Avoid generic "Quality Issues"
- Use hierarchy: "Dimensional | Out of Spec | Feature X"
- Specific reasons enable targeted improvements
2. Add Notes for Context
- What was the measurement?
- What is the spec?
- Was it close or way off?
Example Note:
"ID measured 1.505", spec is 1.500" +0.002/-0.000. Out of tolerance by 0.003". Tool may be worn."
3. Reject Parts in Real-Time
- Don't wait until end of shift
- Immediate rejection more accurate
- Reduces uncategorized rejects
4. Perform Post-Production Inspection
- Quality team inspects sample or all parts
- Adjust rejected parts retroactively if needed
- Captures quality issues operators didn't catch
5. Use Reject Data for Improvement
- Review Quality Report weekly
- Identify top reject reasons (Pareto)
- Prioritize improvements (tooling, process, training)
6. Track Improvement Initiatives
- Before/after comparisons
- Example: "Implemented new tooling → 50% reduction in 'Dull Tool' rejects"
ADC Best Practices
1. Start Simple
- Begin with one or two high-value rules (breaks, common alarms)
- Test and validate
- Add more rules incrementally
2. Use Strict Mode Appropriately
- Strict: For precise events (breaks, specific state changes)
- Normal: For general events (alarms, broad categories)
3. Document PLC Addresses
- Maintain list of I/O addresses and meanings
- Update when PLC changes
- Share with team
4. Set Active Seconds to Ignore
- Prevents false triggers
- Example: 5 seconds for door state
5. Validate Rules After Creation
- Review Timelines Dashboard
- Check if downtime is categorized correctly
- Adjust rule if needed
Data Quality for Accurate OEE
For Accurate OEE:
1. Categorize All Downtime
- Reduces "uncategorized" events
- Enables root cause analysis
- Enables automated workflows
2. Reject Parts with Specific Reasons
- Use subcategories (not just parents)
- Add notes for context
3. Configure Shifts Correctly
- Set up shifts in Settings
- Assign shifts to machines
- Update when shift schedules change
4. Set Scheduled Time Appropriately
- Define attended vs. unattended shifts
- Mark planned downtimes (PM, breaks)
- Configure unattended inactivity threshold
5. Validate Data Regularly
- Spot-check reports against shop floor reality
- Investigate anomalies (sudden OEE drops, unusual downtime spikes)
- Correct data issues promptly
Getting Help
Common Questions
"Downtime not being detected"
- Check machine connectivity (is data flowing?)
- Verify execution state (is "in-cycle" signal working?)
- Check Assets → Machines → Select Machine → Execution configuration
"Downtime pop-up not appearing on tablet"
- Check microstop threshold (is downtime long enough?)
- Check Downtime List Filter (is downtime filtered out?)
- Verify Operator Dashboard settings
"ADC rule not working"
- Verify trigger value matches exactly (alarm code, state value)
- Check trigger mode (Strict vs. Normal)
- Check Active Seconds to Ignore (is state change too brief?)
- Review Timelines Dashboard to see if rule applied
"Quality affecting OEE more than expected"
- Review Quality Report (how many rejects?)
- Check reject reasons (are operators over-rejecting?)
- Verify part count accuracy (are good parts correct?)
- Formula: Quality = Good Parts / Total Parts
"Planned downtime still affecting OEE"
- Important: All downtime affects OEE equally (planned/unplanned categorization is for reporting only)
- Exception: Planned setup can be excluded (Settings → Downtimes → General → "Exclude planned downtime from production metrics")
Before Contacting Support
Gather Information:
- Machine name(s)
- Downtime category or reject reason affected
- Screenshot of issue (Timelines, Reports, Operator Dashboard)
- Expected behavior vs. actual behavior
- When issue started (recent change?)
Try These Steps:
- Refresh page (F5 or Cmd+R)
- Check machine connectivity (Machines List Dashboard)
- Verify configuration (Settings → Downtimes or Quality)
- Review ADC rules (if using ADC)
- Check Timelines Dashboard (visual confirmation)
Contact Support
MachineMetrics Support:
- Email: support@machinemetrics.com
- Include:
- Machine name(s)
- Downtime category or reject reason
- Screenshot of issue
- Expected behavior vs. actual behavior
- Steps to reproduce
For Training:
- Request downtime/quality tracking training session
- Ask about ADC setup and configuration
- Schedule operator training for categorization best practices
Next Steps:
- Configure downtime categories: Downtime Categories
- Set up ADC rules: Automatic Downtime Classification
- Configure reject reasons: Reject Reasons
- Review reports: Downtime and Quality Reports
- Understand OEE impact: Understanding Your Data Guide
Questions? Contact support@machinemetrics.com