Reports Guide
Overview
What are Reports?
Reports provide comprehensive, exportable views of your MachineMetrics data for analysis, sharing, and decision-making.
Key Capabilities:
- Analyze historical performance trends
- Compare machines, shifts, and time periods
- Export data to CSV for external analysis
- Schedule automatic report delivery via email
- Create custom reports with specific metrics and groupings
- Share standardized reports across your organization
Report Types:
- Out-of-the-Box Reports: Pre-configured reports for common use cases (OEE, Downtime, Utilization, etc.)
- Custom Reports (Report Builder): Build your own reports with selected metrics, groupings, and filters
- Scheduled Reports: Automatically delivered reports on a recurring schedule
- Weekly Summary Reports: Automated weekly emails with utilization and downtime summaries
Who Uses Reports:
- Operations Managers: Review weekly/monthly performance trends
- Plant Managers: Compare shift performance, benchmark machines
- Maintenance Supervisors: Analyze downtime patterns, alarm frequency
- Continuous Improvement Teams: Identify improvement opportunities, track initiatives
- Executives: High-level summaries for stakeholder meetings
- External Stakeholders: Exportable data for customers, auditors, consultants
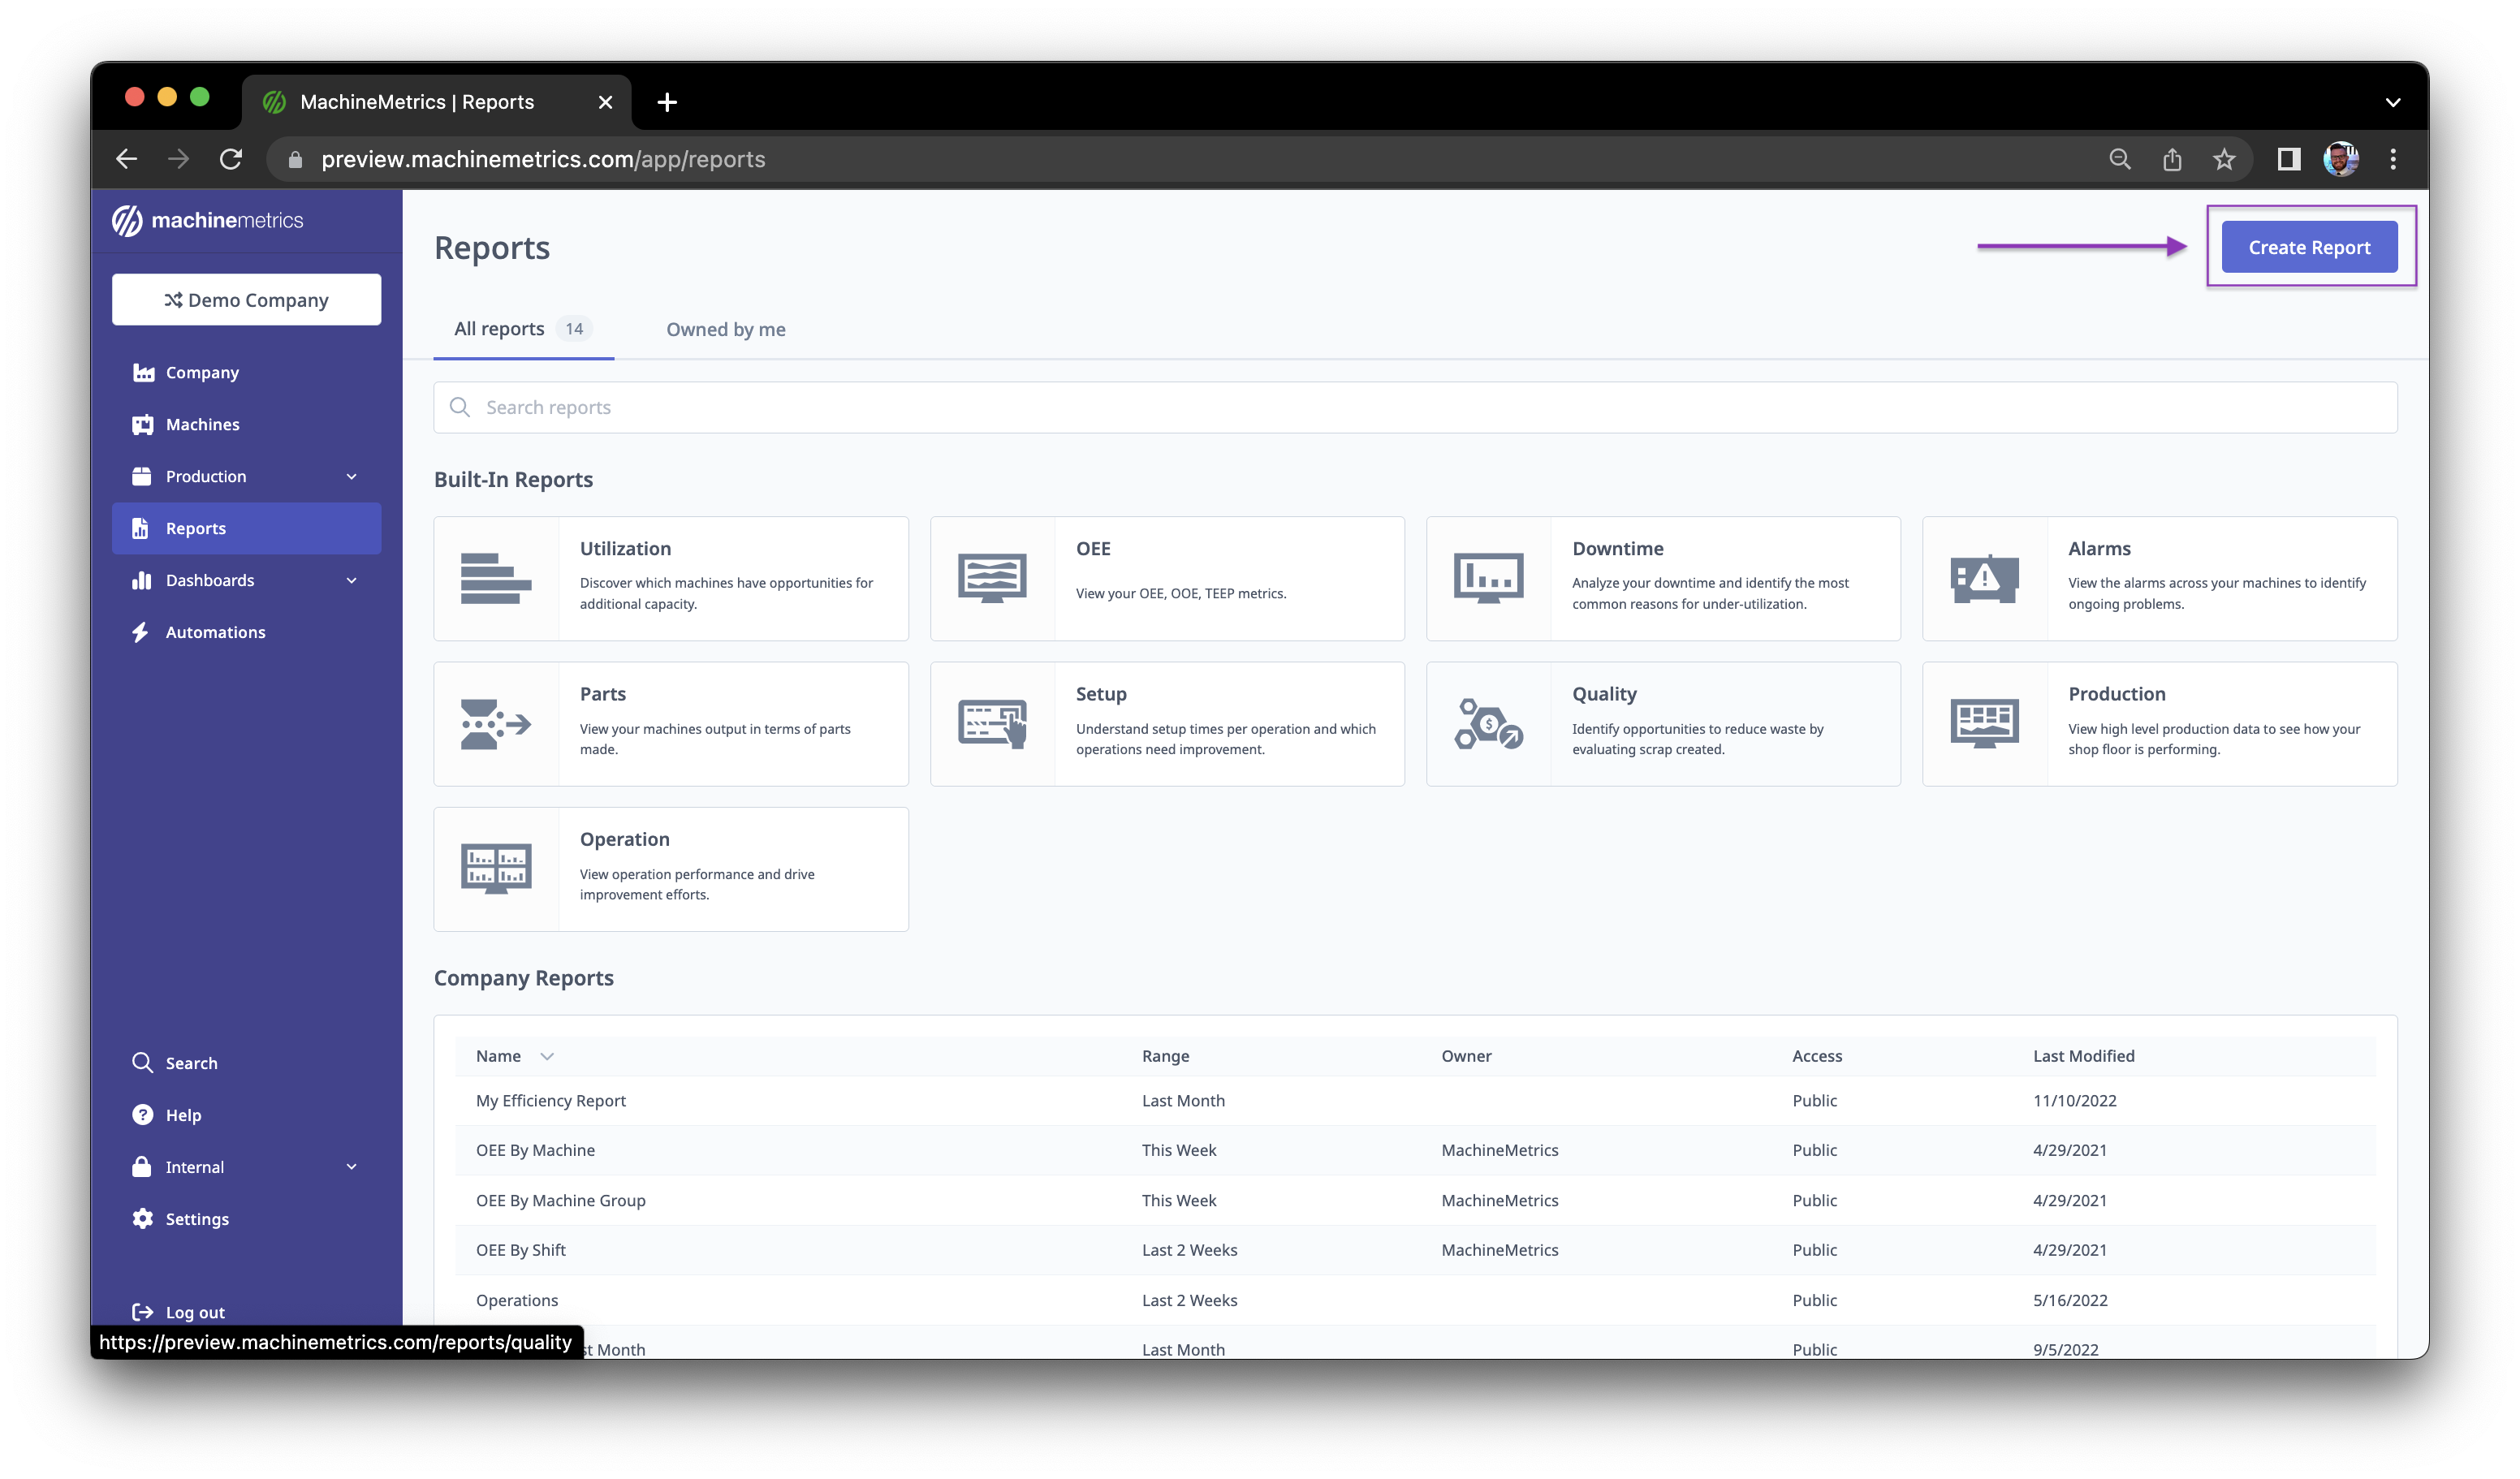
Reports Landing Page
Accessing Reports
Navigation:
- Click Reports in the main sidebar
- Reports Landing Page displays all available report tiles
Reports Landing Page Sections:
- Out-of-the-Box Reports: Pre-configured report tiles (Alarms, Downtime, OEE, etc.)
- Company Reports: Saved custom reports shared across your organization
- Owned By Me: Your personal saved reports
- Create Report: Button to launch Report Builder
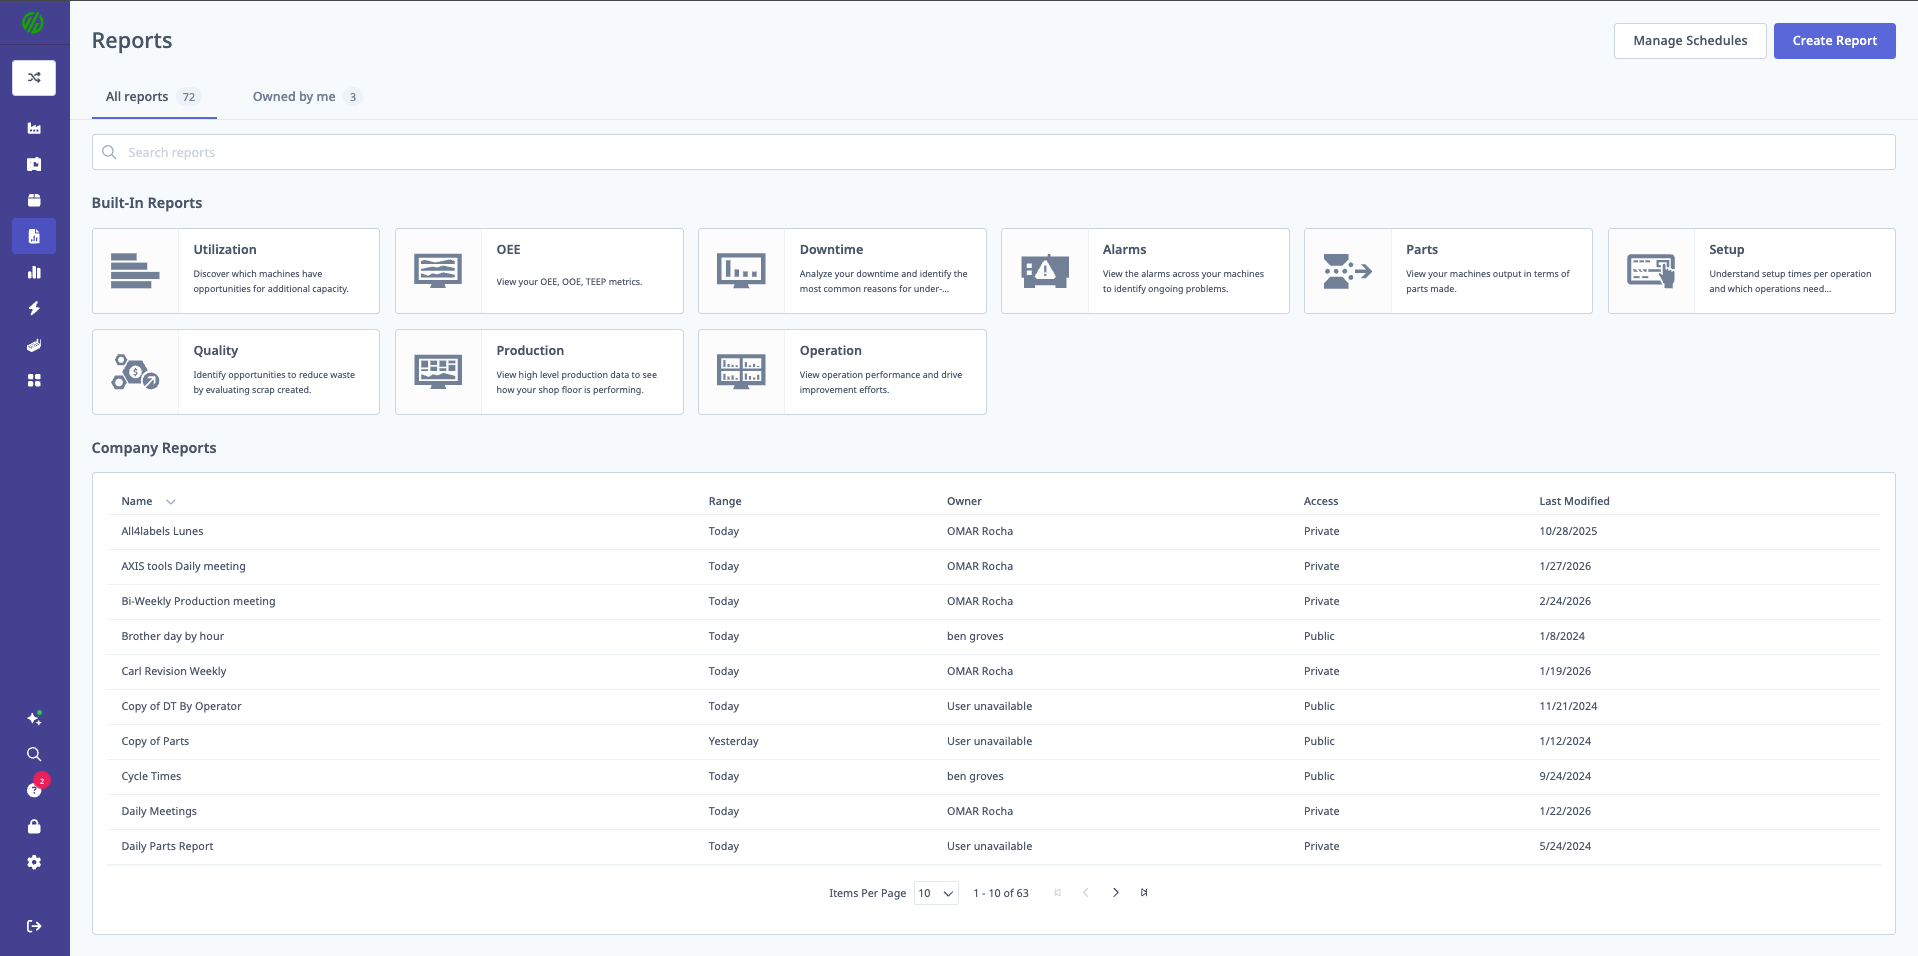
Report Tiles
Each Tile Shows:
- Report name
- Report type (icon)
- Last modified date (for saved reports)
- Creator name (for saved reports)
- Actions menu (⋮) for saved reports
Actions Menu:
- Load: Open the report
- Edit: Modify report settings (if you have access)
- Save as Copy: Duplicate report for your own customization
- Delete: Remove report (creator or IT Admin only)
Out-of-the-Box Reports
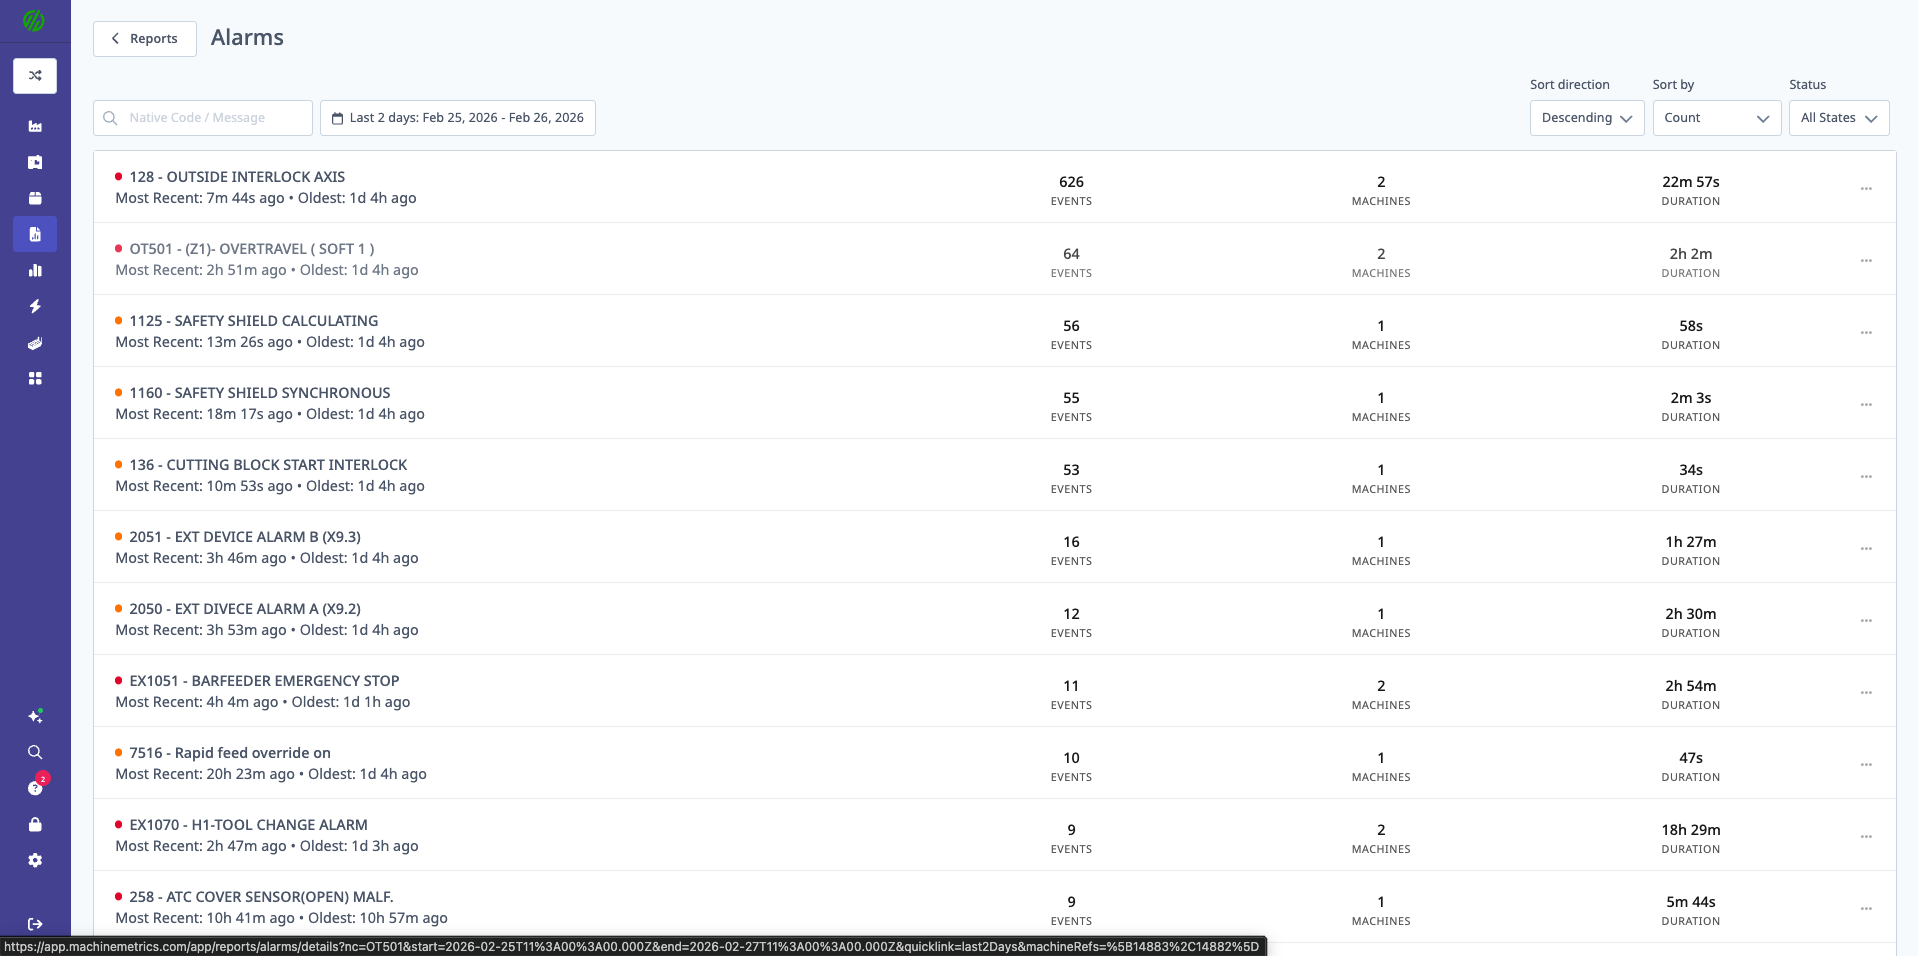
Alarms Report
Purpose: View and analyze alarms from all machines.
Data Displayed:
- Alarm Status: Warning or Fault
- Native Code: Machine's alarm code (e.g., "P/S 101")
- Native Message: Machine's alarm message
- Count: Total occurrences
- Duration: Total time in alarm state
- Latest: Most recent occurrence timestamp
- Summary Totals: Total events, machines affected, total duration
Filters:
- Date/Time Range: Select period to analyze
- Status: Warning, Fault, or both
- Native Code/Message: Search for specific alarms
- Machine: Filter to specific machines
Use Cases:
- Identify most frequent alarms
- Find chronic alarm issues
- Prioritize maintenance based on alarm duration
- Compare alarm frequency across machines
Workflow Integration:
- Click Create Workflow from alarm summary
- Automate responses to specific alarms
- See Automations & Workflows Guide
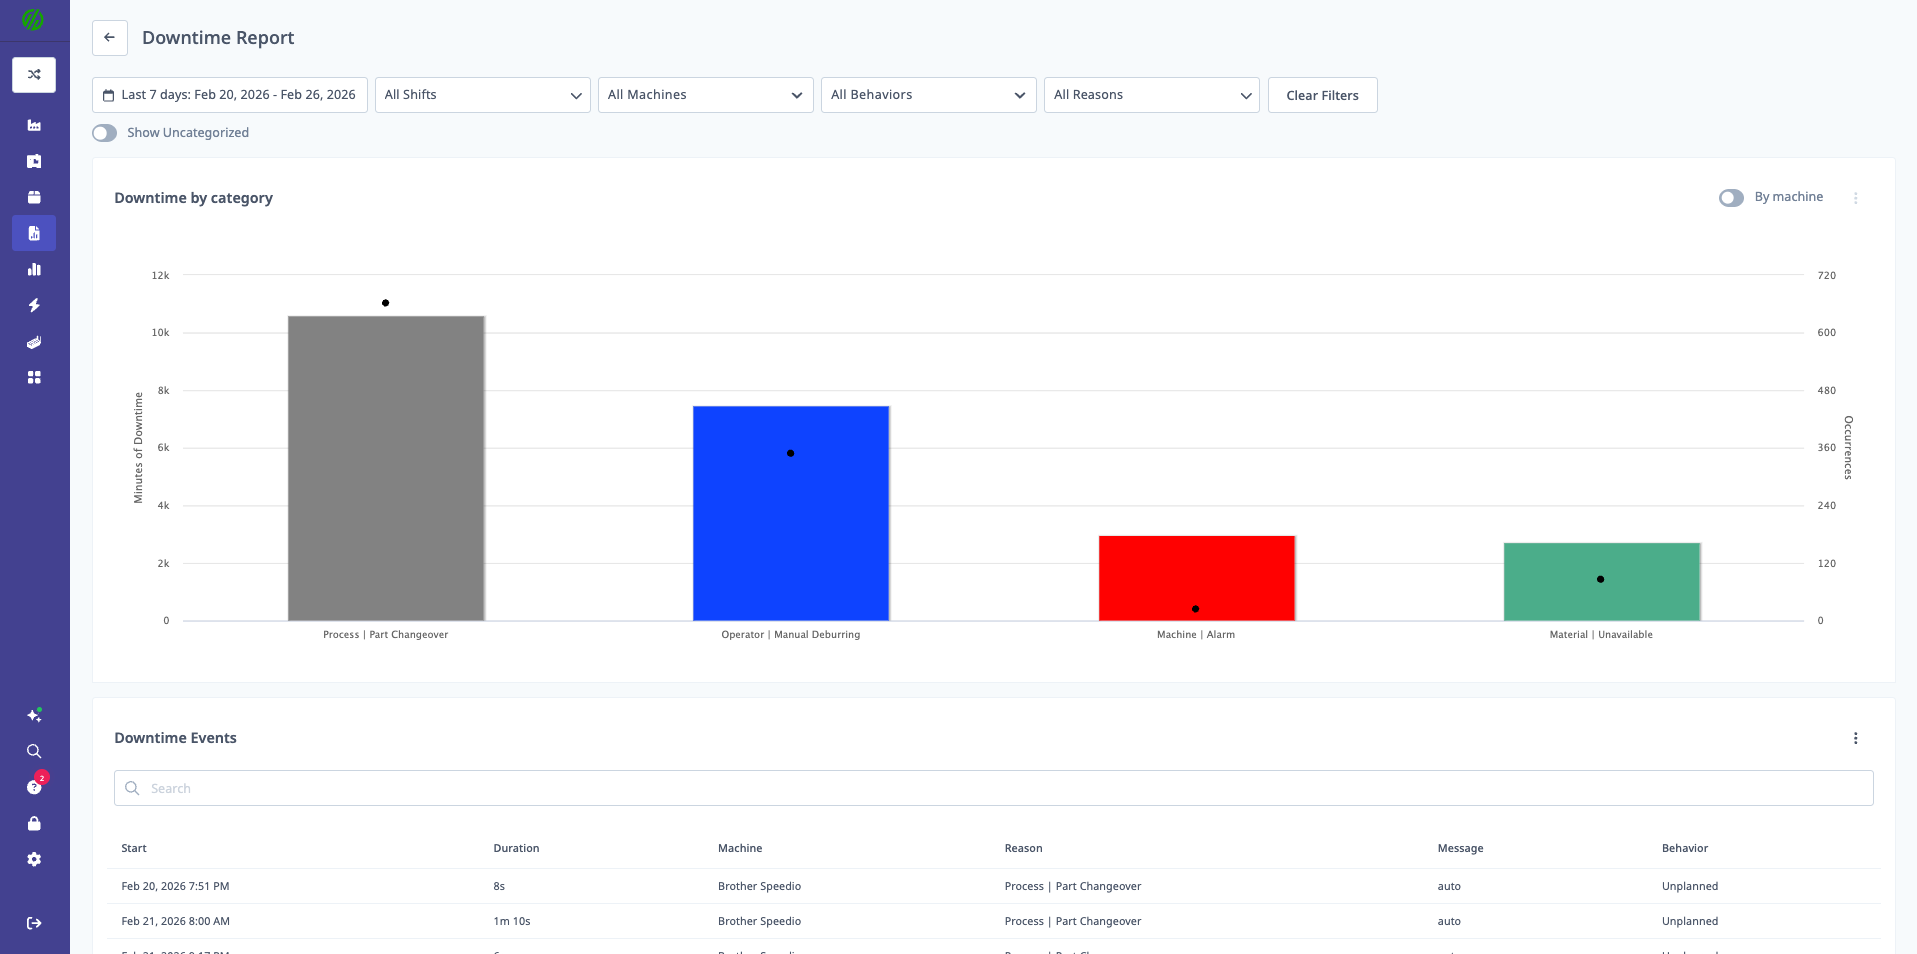
Downtime Report
Purpose: Analyze downtime patterns by category, machine, and time period.
Data Displayed:
Downtime Pareto Chart:
- Top downtime categories by duration (minutes)
- Number of occurrences per category
- Pareto analysis (80/20 rule visualization)
Downtime Events Table:
- Start Time: When downtime began
- Duration: Length of downtime event
- Machine: Which machine experienced downtime
- Reason: Downtime category
- Message: Operator comment/note
- Planned: Checkbox indicating if downtime was planned
Downtime By Machine:
- Stacked bar chart showing downtime by category per machine
- Color-coded by downtime reason
Filters:
- Date/Time Range
- Machine or Machine Group
- Shift
- Include Uncategorized: Show/hide uncategorized downtime
Use Cases:
- Identify top downtime drivers (Pareto principle)
- Compare downtime across machines
- Track improvement initiatives (before/after analysis)
- Justify capital investments (downtime reduction value)
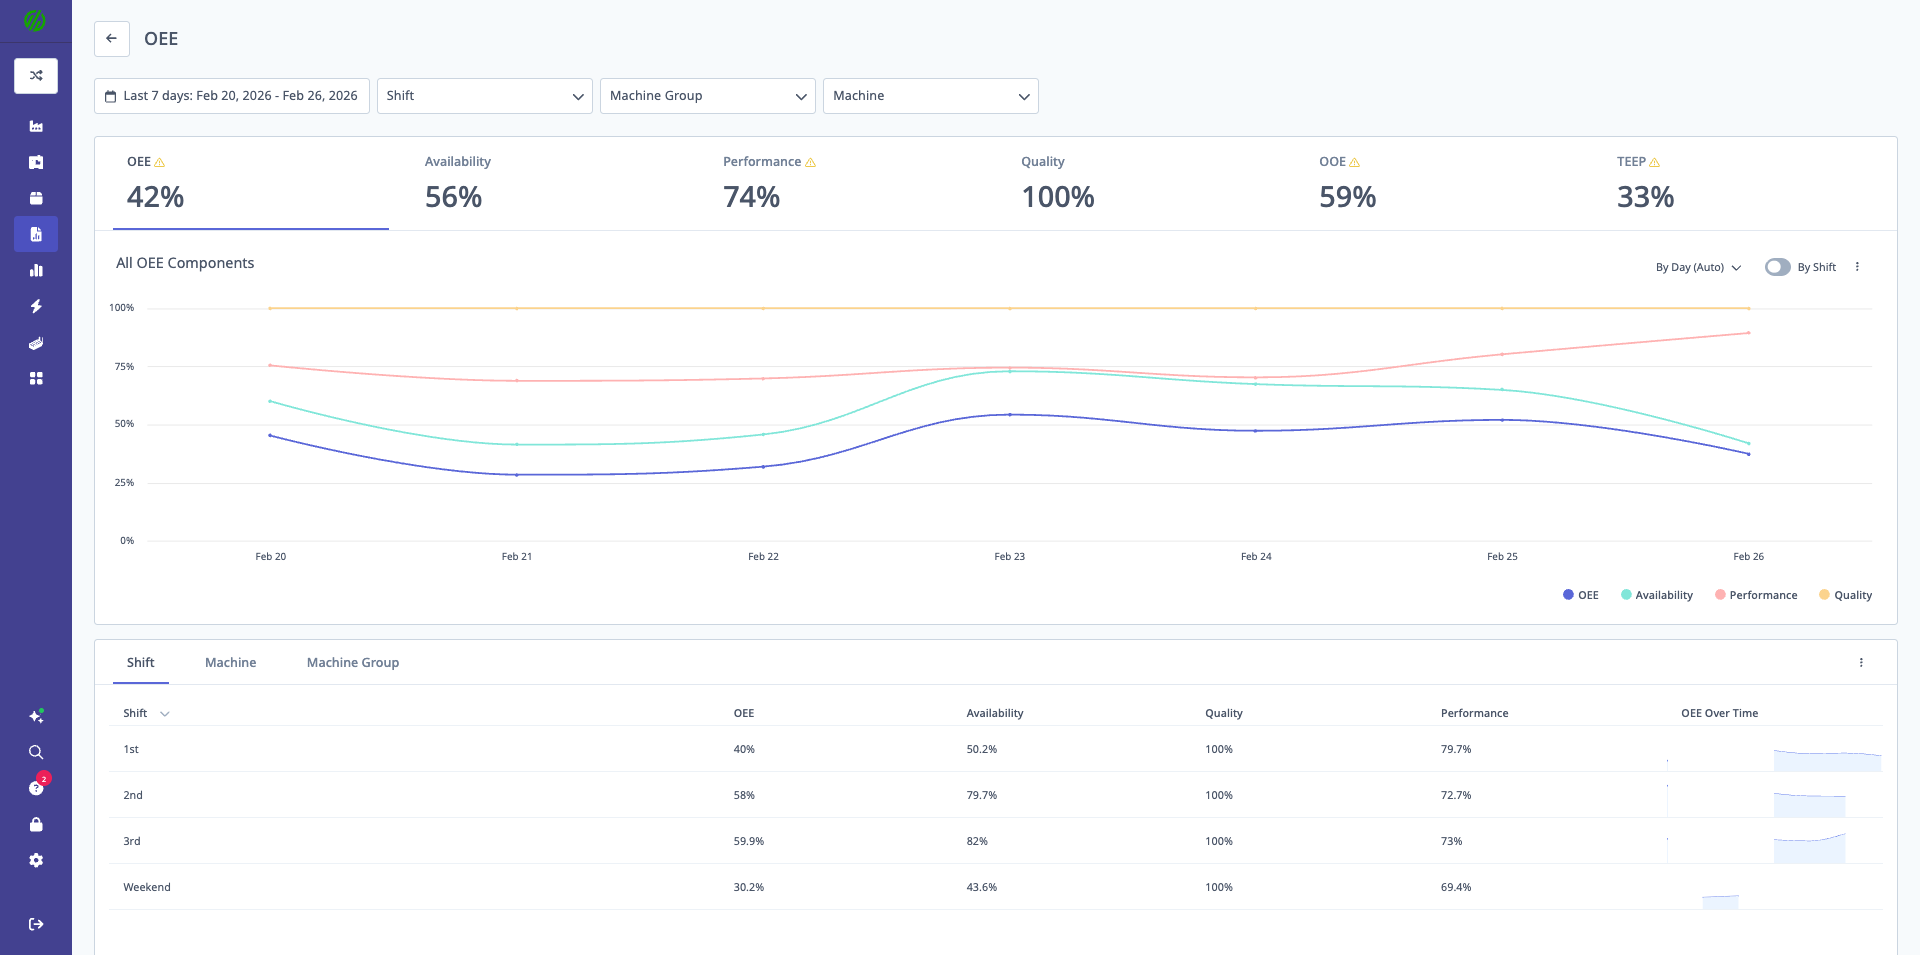
OEE Report
Purpose: Analyze Overall Equipment Effectiveness and its components.
Metrics Displayed:
- OEE %: Overall Equipment Effectiveness
- Availability %: Percentage of scheduled time machine is running
- Performance %: Actual vs. ideal cycle time
- Quality %: Good parts vs. total parts produced
- OOE %: Overall Operations Effectiveness
- TEEP %: Total Effective Equipment Performance
Visualizations:
- Line Charts: OEE components over time
- Tables: Metrics by Shift, Machine Group, or Machine
- Summary: Average values for selected period
Grouping Options:
- By Day, Week, Month, Quarter
- By Shift
- By Machine or Machine Group
Use Cases:
- Track OEE trends over time
- Identify which component (A/P/Q) limits performance
- Compare shift performance
- Benchmark machines against each other
Note: This is a Report Builder-based report. See Report Builder for customization options.
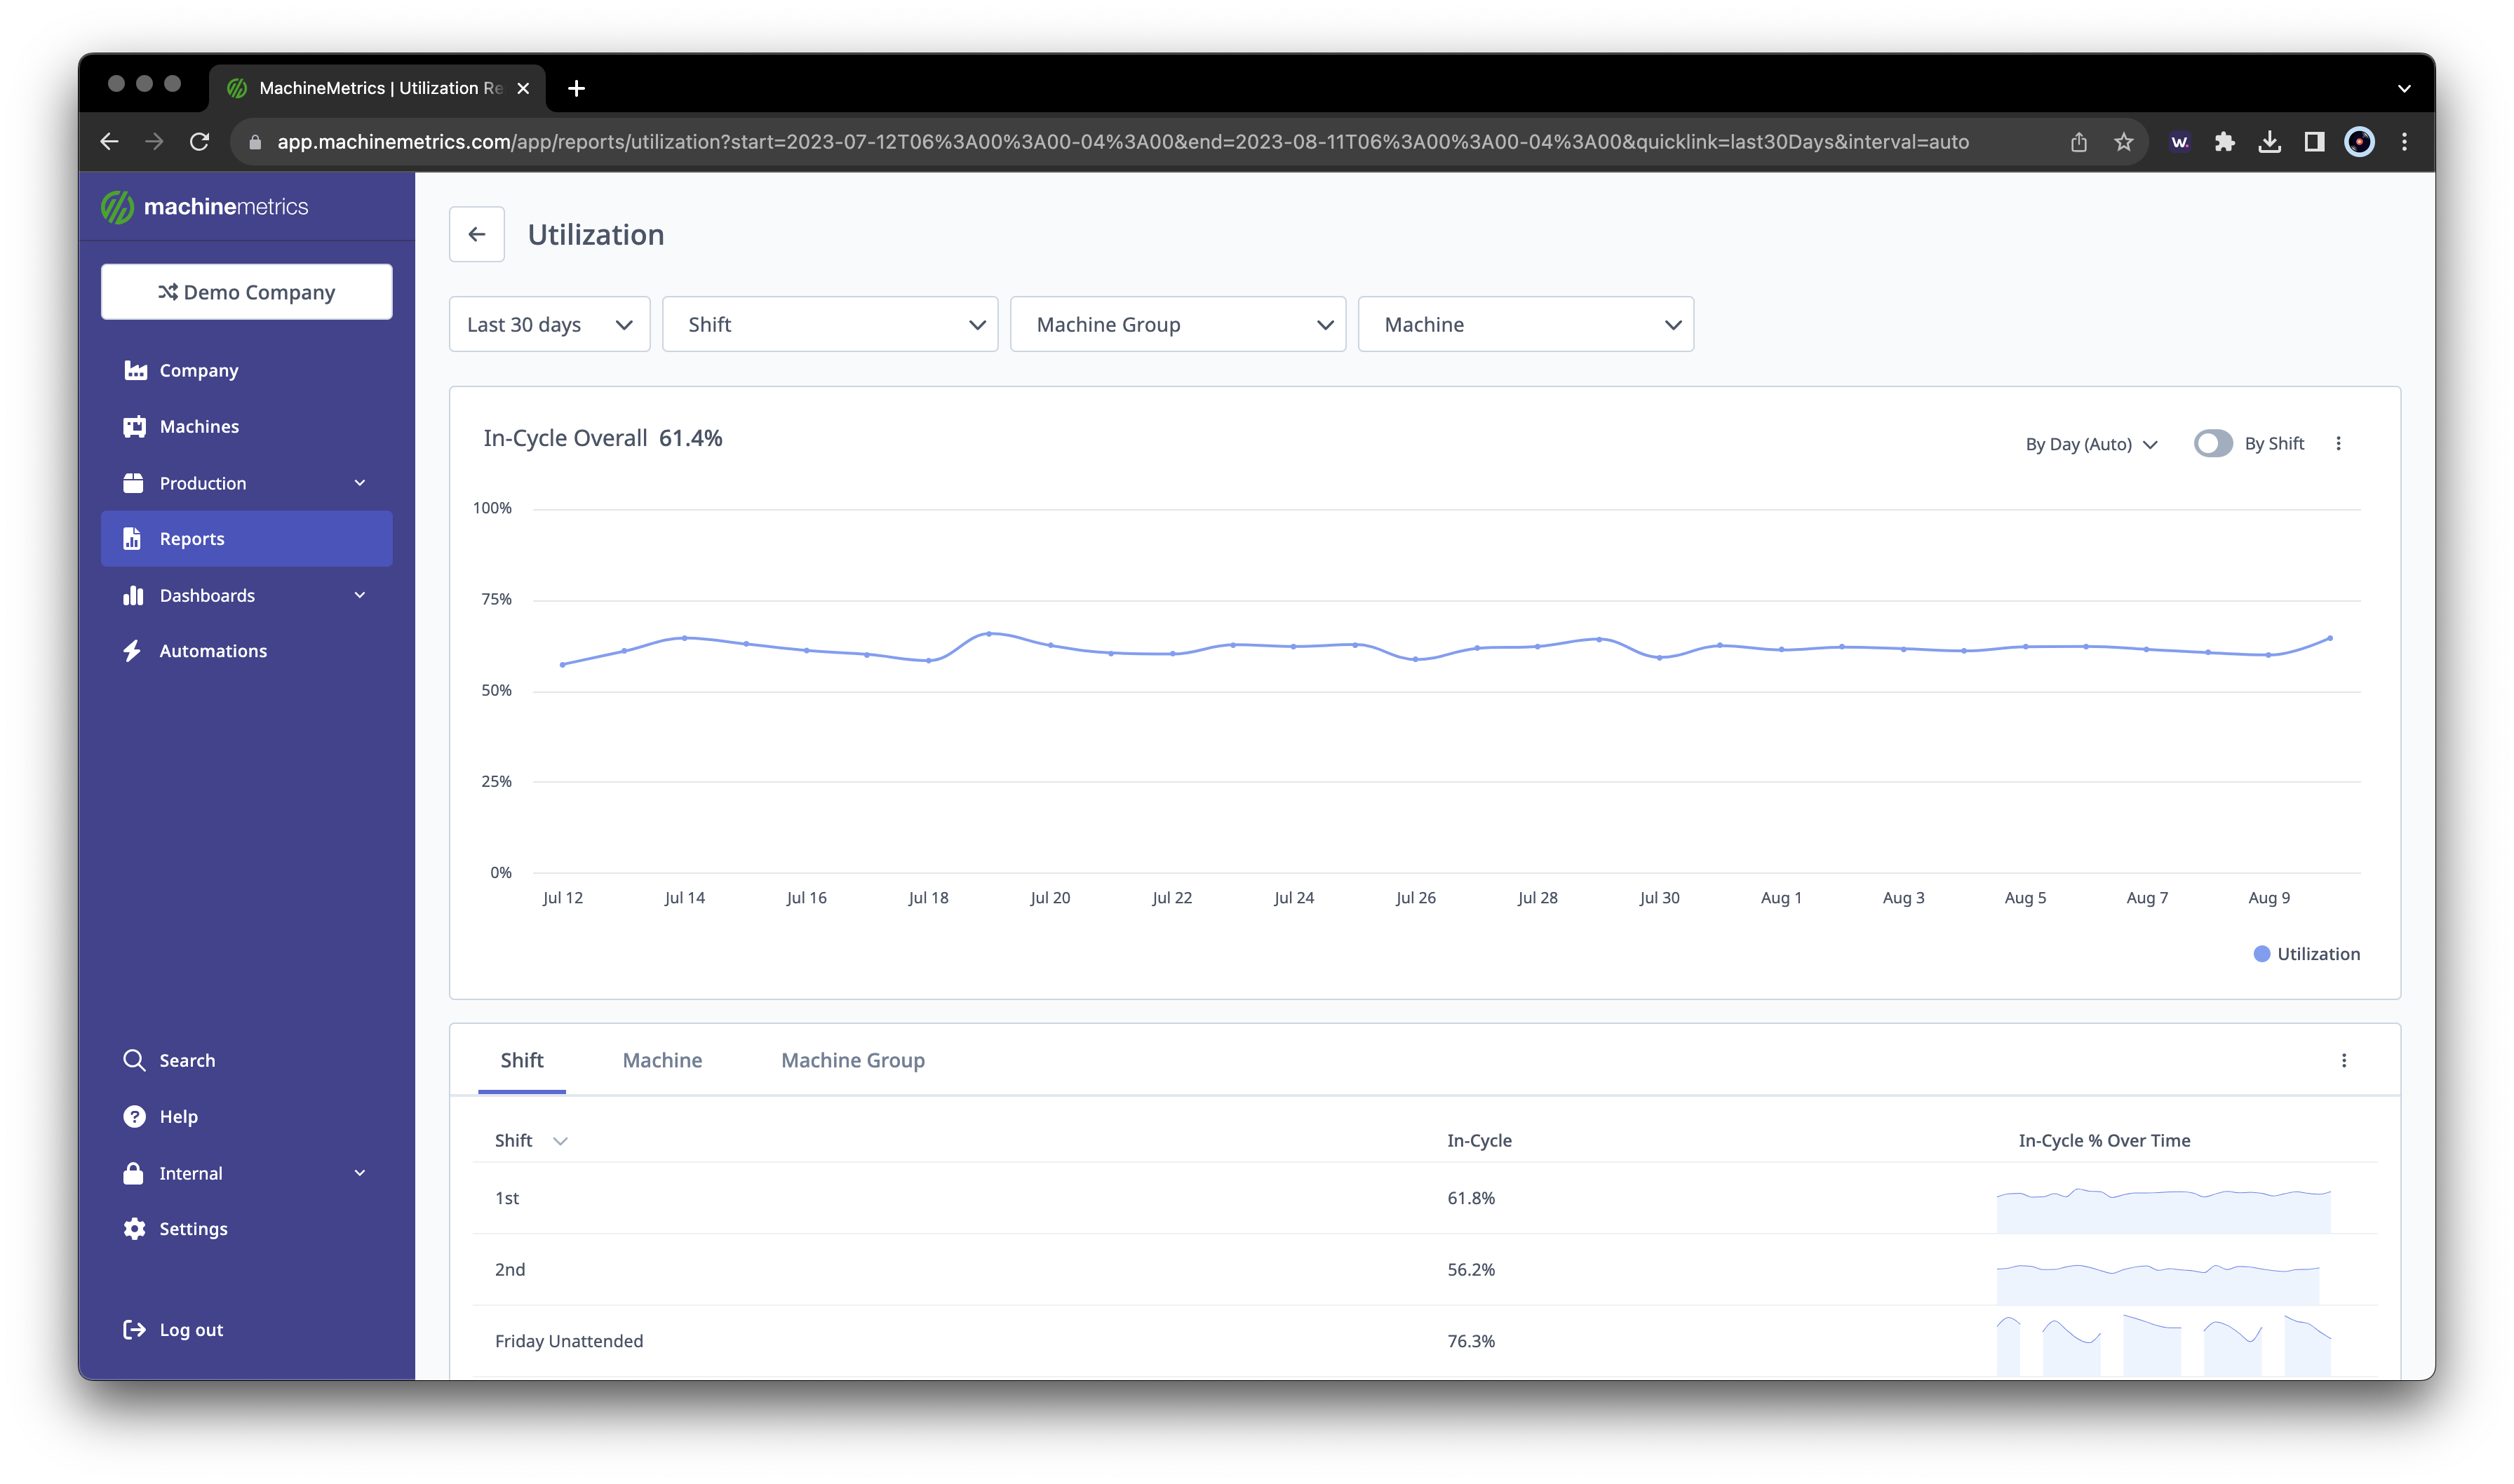
Utilization Report
Purpose: Analyze machine utilization across different states.
Utilization Types:
- In-Cycle: Percentage of time machine is in-cycle
- Spindle-Rotating: Percentage of time spindle is rotating (if supported)
- In-Cut: Percentage of time actively cutting material (if supported)
Visualizations:
- Line Charts: Utilization trends over time
- Tables: Utilization by Shift, Machine Group, or Machine
- Time Grouping Controls: Adjust granularity (Hour, Day, Week, Month)
Grouping Options:
- By Hour, Day, Week, Month, Quarter
- By Shift
- By Machine or Machine Group
Use Cases:
- Identify underutilized machines
- Compare shift utilization
- Track utilization improvements
- Benchmark against industry standards
Note: In-Cycle is standard. Spindle-Rotating and In-Cut require specific machine connectivity.
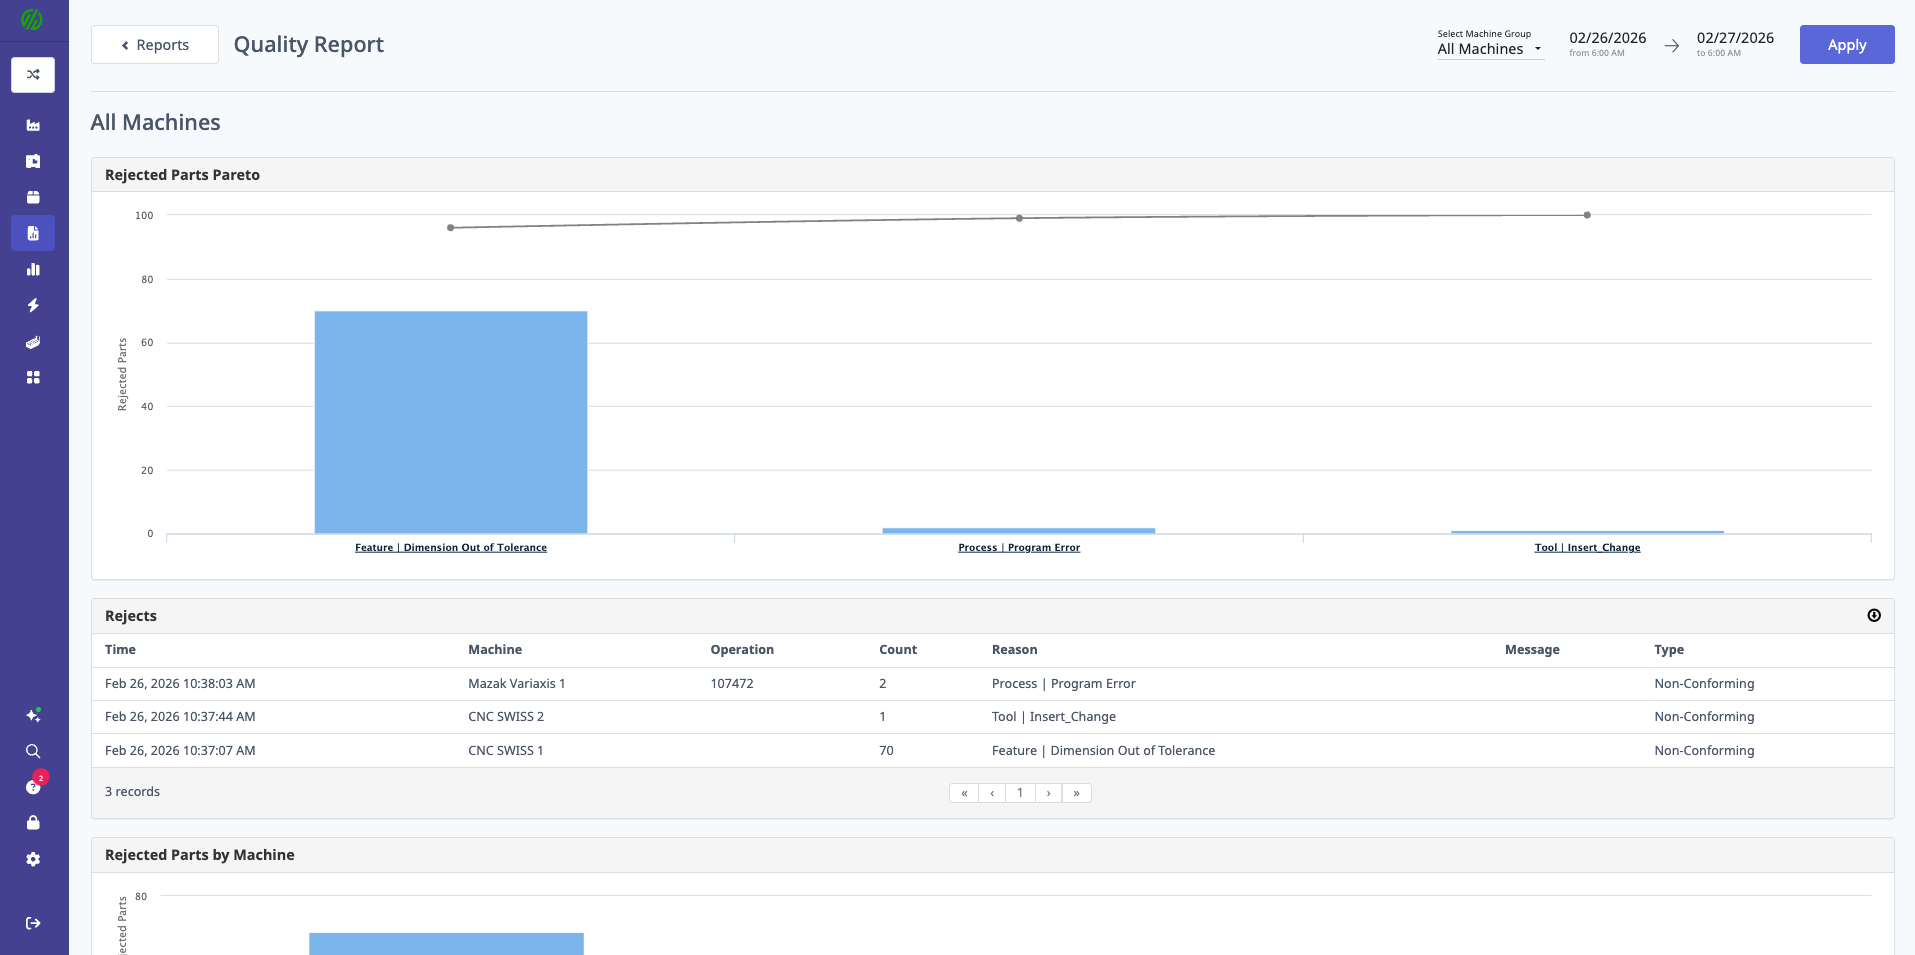
Quality Report
Purpose: Analyze rejected parts by reason and identify quality issues.
Data Displayed:
Rejected Parts Pareto:
- Top rejection reasons by count
- Pareto chart showing 80/20 breakdown
Rejects Table:
- Time: When reject occurred
- Machine: Which machine
- Job: Associated production run
- Part Count: Number of parts rejected
- Reason: Rejection category
- Message: Operator notes
- Type: Rejection type
Rejects By Machine:
- Bar chart showing rejects by machine
- Color-coded by rejection reason
Filters:
- Date/Time Range
- Machine or Machine Group
- Shift
- Rejection Reason
Use Cases:
- Identify top quality issues
- Track scrap reduction initiatives
- Compare quality across machines/shifts
- Justify process improvements or tooling investments
Note: Supports retroactive adjustments if reject data is corrected.
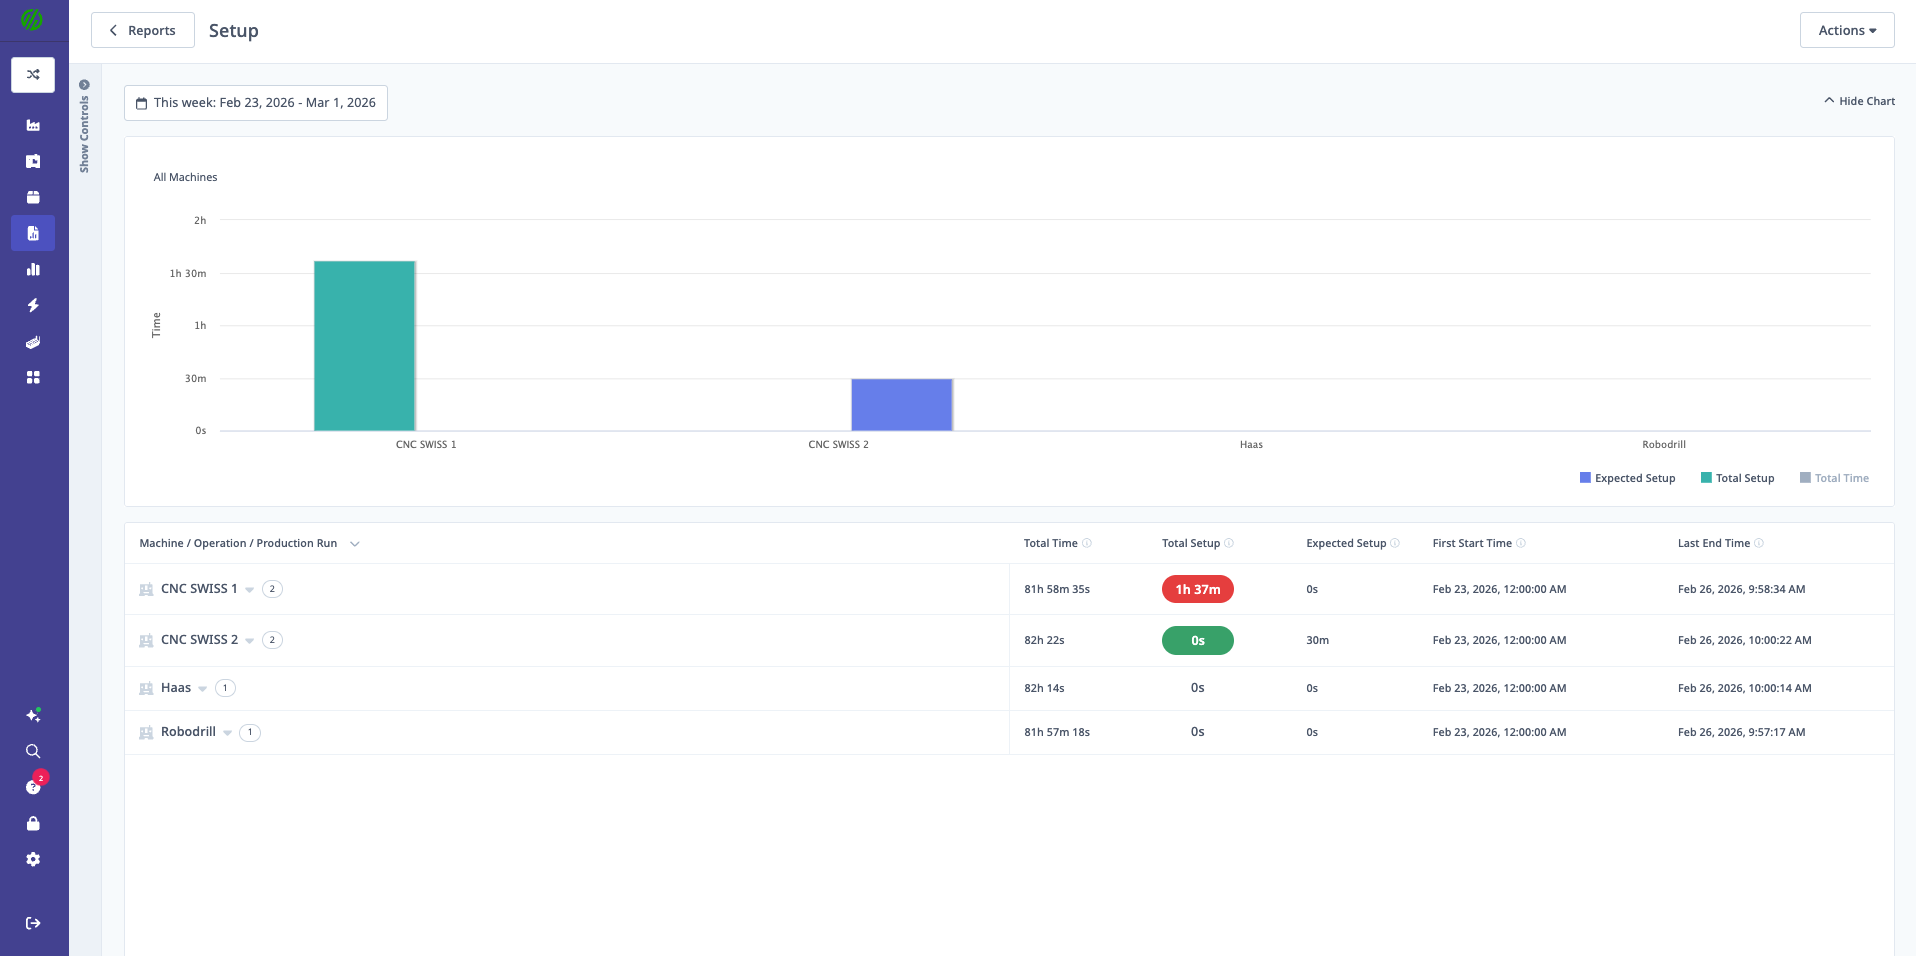
Setup Report
Purpose: Compare actual setup time vs. expected setup time.
Data Displayed:
- Total Setup Time: Actual time spent in setup mode
- Expected Setup Time: Planned setup time from operation definition
- Difference: Actual minus expected (color-coded)
- Machine: Which machine performed setup
- Operation: Which operation was set up
- Production Run: Associated run
Color Coding:
- Green: Setup time under expected
- Yellow: Setup time slightly over expected
- Red: Setup time significantly over expected
Grouping:
- By Machine
- By Operation
- By Production Run
Use Cases:
- Identify operations requiring setup time reduction
- Compare setup efficiency across machines/operators
- Track setup improvement initiatives
- Optimize changeover processes
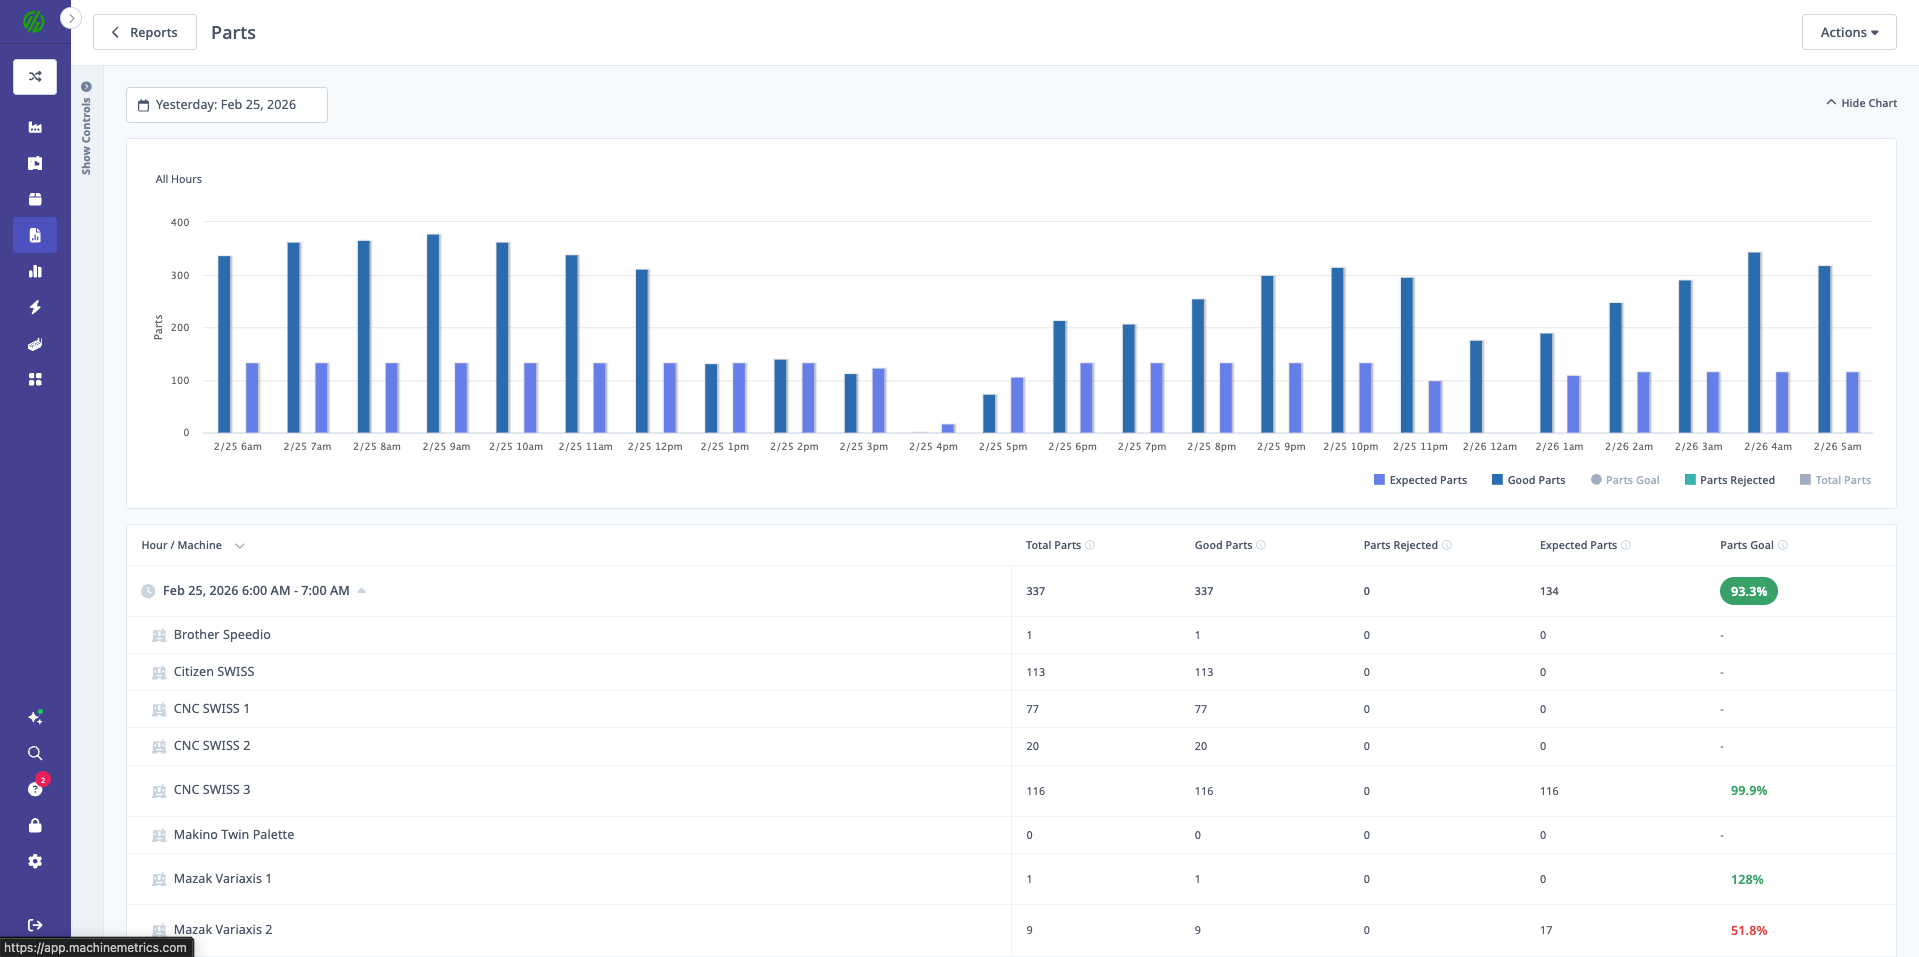
Parts Report
Purpose: Analyze parts production data.
Data Displayed:
- Total Parts Produced: All parts (good + rejected)
- Good Parts: Parts that passed quality checks
- Rejected Parts: Scrap or rework parts
- Parts Goal: Target vs. actual production
Default Grouping:
- By Hour
- By Machine
Customization:
- Change groupings via Report Builder
- Add filters for specific operations, shifts, or date ranges
Use Cases:
- Track daily/weekly production totals
- Compare production across machines
- Identify production gaps vs. goals
- Analyze production trends over time
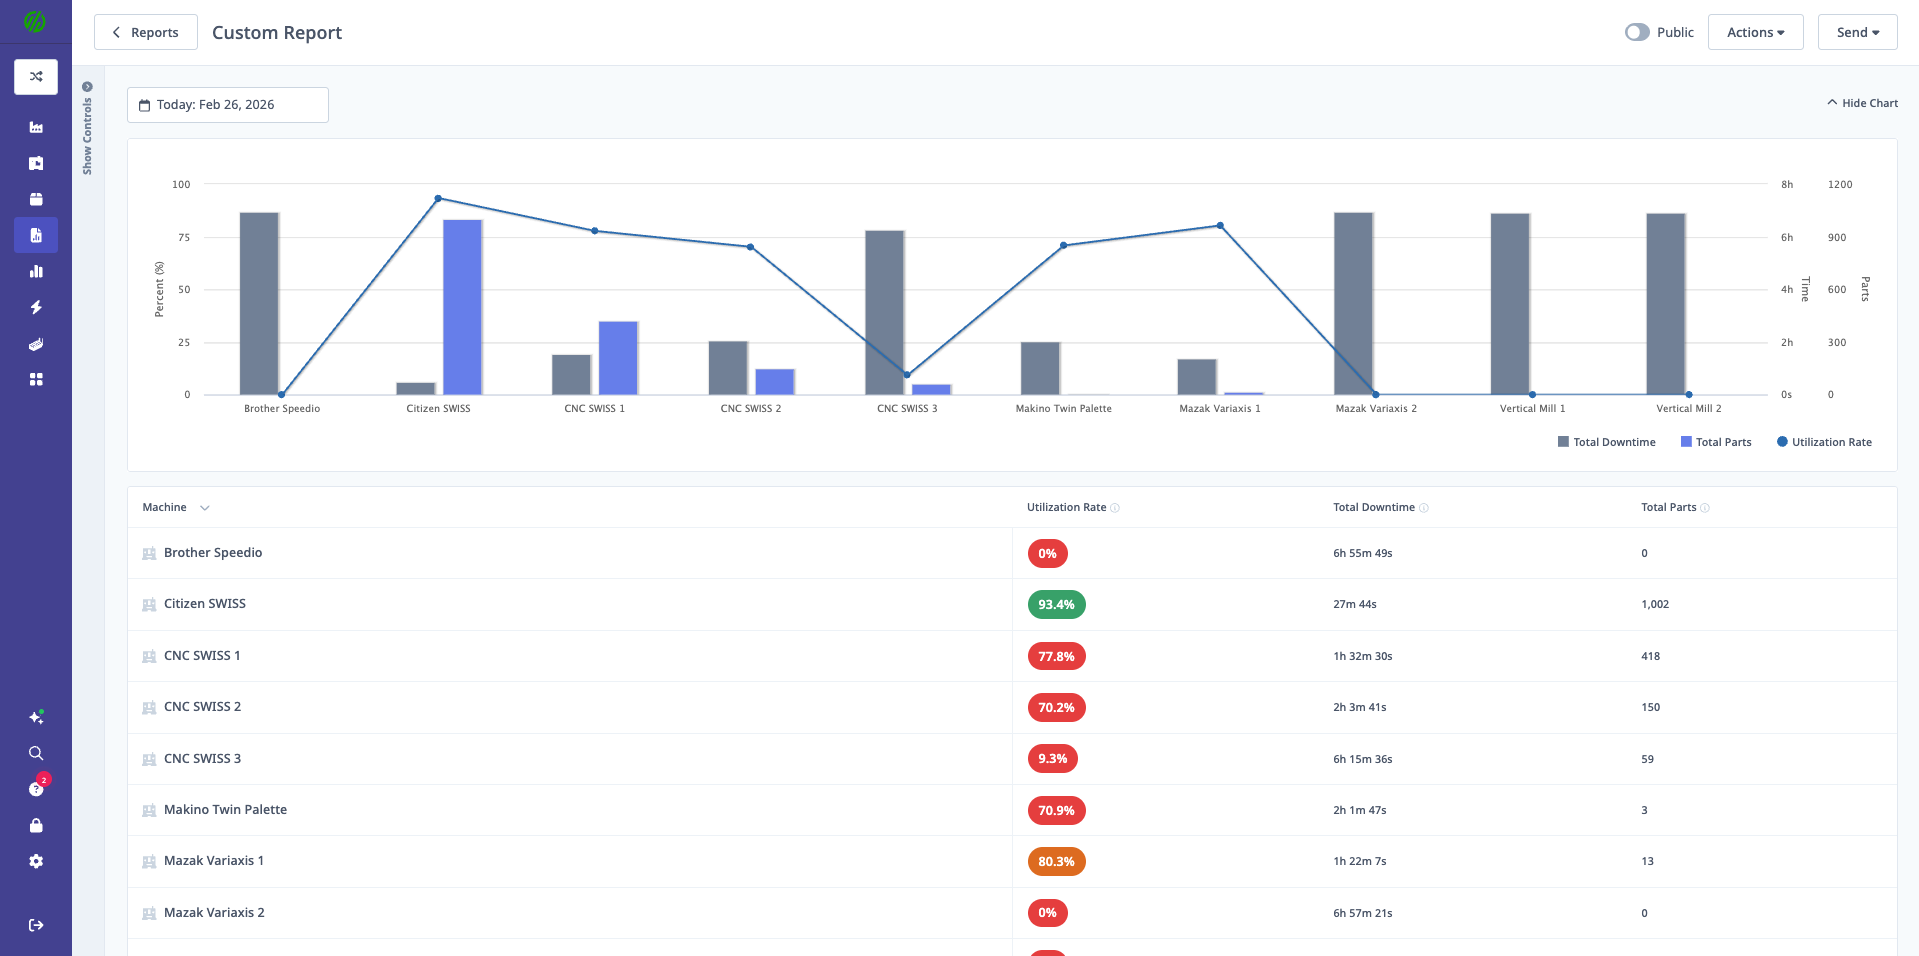
Production Report
Purpose: Comprehensive production data analysis (fully customizable).
Data Displayed:
- Production metrics (customizable via Report Builder)
- Default includes: Parts produced, OEE, cycle times, downtime
Customization:
- This is a Report Builder-based report
- Add/remove metrics as needed
- Change groupings and filters
- See Report Builder for full customization options
Use Cases:
- Custom production analysis for specific needs
- Combine multiple metrics in one view
- Create standardized production reports for regular reviews
Report Builder (Custom Reports)
What is Report Builder?
Report Builder lets you create custom reports with:
- Selected metrics (choose what matters to you)
- Custom groupings (by time, machine, shift, etc.)
- Filters (narrow to specific data)
- Chart types (bar or line per metric)
- Save and share capabilities
Access Requirements:
- Supervisor, Manager, Executive, or IT Admin role
Creating a Custom Report
Step-by-Step:
1. Access Report Builder
- Navigate to Reports → Create Report
- Or load existing report and click Edit
2. Select Date/Time Range
- Presets: Today, Yesterday, Last 7 Days, Last 30 Days, etc.
- Custom Range: Select specific start and end dates
- Use Custom Hours (checkbox): Enable for hourly granularity
- Important: Only use for ranges ≤ 1 week (performance consideration)
3. Choose Metrics (Selected Data Tab)
- Click Selected Data tab
- Metrics organized by category:
- Availability: Uptime, downtime, availability %
- Performance: Cycle times, OEE performance %
- Quality: Parts produced, rejected, quality %
- Utilization: In-cycle %, spindle-rotating %
- Downtime: Downtime minutes by category
- Production: Operations, production runs, parts goal
- Cost: Cost per part, cost of losses
Selection Tools:
- Select All: Check all metrics in a category
- Deselect All: Uncheck all metrics in a category
- Individual Checkboxes: Select specific metrics
4. Choose Chart Types
- For each selected metric:
- Bar Chart: Good for comparisons (e.g., comparing machines)
- Line Chart: Good for trends over time
5. Group By
- Select up to 3 groupings
- Order matters: First grouping is primary, then secondary, then tertiary
Grouping Options:
- Time: Quarter, Month, Week, Day, Hour
- Machine: Individual machines
- Machine Group: Groups of machines
- Shift: First, second, third shift, etc.
- Operation: Specific operations
- Operator: Individual operators (if operator tracking enabled)
Example Grouping:
Group By 1: Week
Group By 2: Shift
Group By 3: Machine

Result: Weekly data, broken down by shift, then by machine
Important Notes:
- Hour grouping: Only available for date ranges ≤ 1 week
- Hour grouping disables: Other time intervals and Shift grouping
- Downtime metrics: Unavailable when grouping by Hour
- Use hierarchical order: Larger → Smaller (e.g., Month → Week → Day)
6. Filter By
- Narrow data to specific:
- Machines: Select individual machines
- Machine Groups: Select groups
- Shifts: Select shifts
- Operations: Select operations
- Operators: Select operators
7. Build Report
- Click Build Report button
- Report generates with selected metrics, groupings, and filters
8. Save Report
- Click Save Report
- Enter Report Name
- Toggle Public checkbox:
- Public = ON: Appears in "Company Reports" for all users
- Public = OFF: Only appears in your "Owned By Me" reports
- Click Save
Editing Reports
Loading Saved Report:
- Navigate to Reports
- Find report in "Owned By Me" or "Company Reports"
- Click tile to load
Making Changes:
- Load report
- Click Actions menu (⋮) → Edit
- Modify metrics, groupings, or filters
- Click Build Report to preview
- Save Report to update
Save as Copy:
- Load report
- Click Actions menu (⋮) → Save as Copy
- Customize without affecting original
- Save with new name
Report Builder Video Tutorial
[Recommended Image]: Replace with direct link to tutorial video
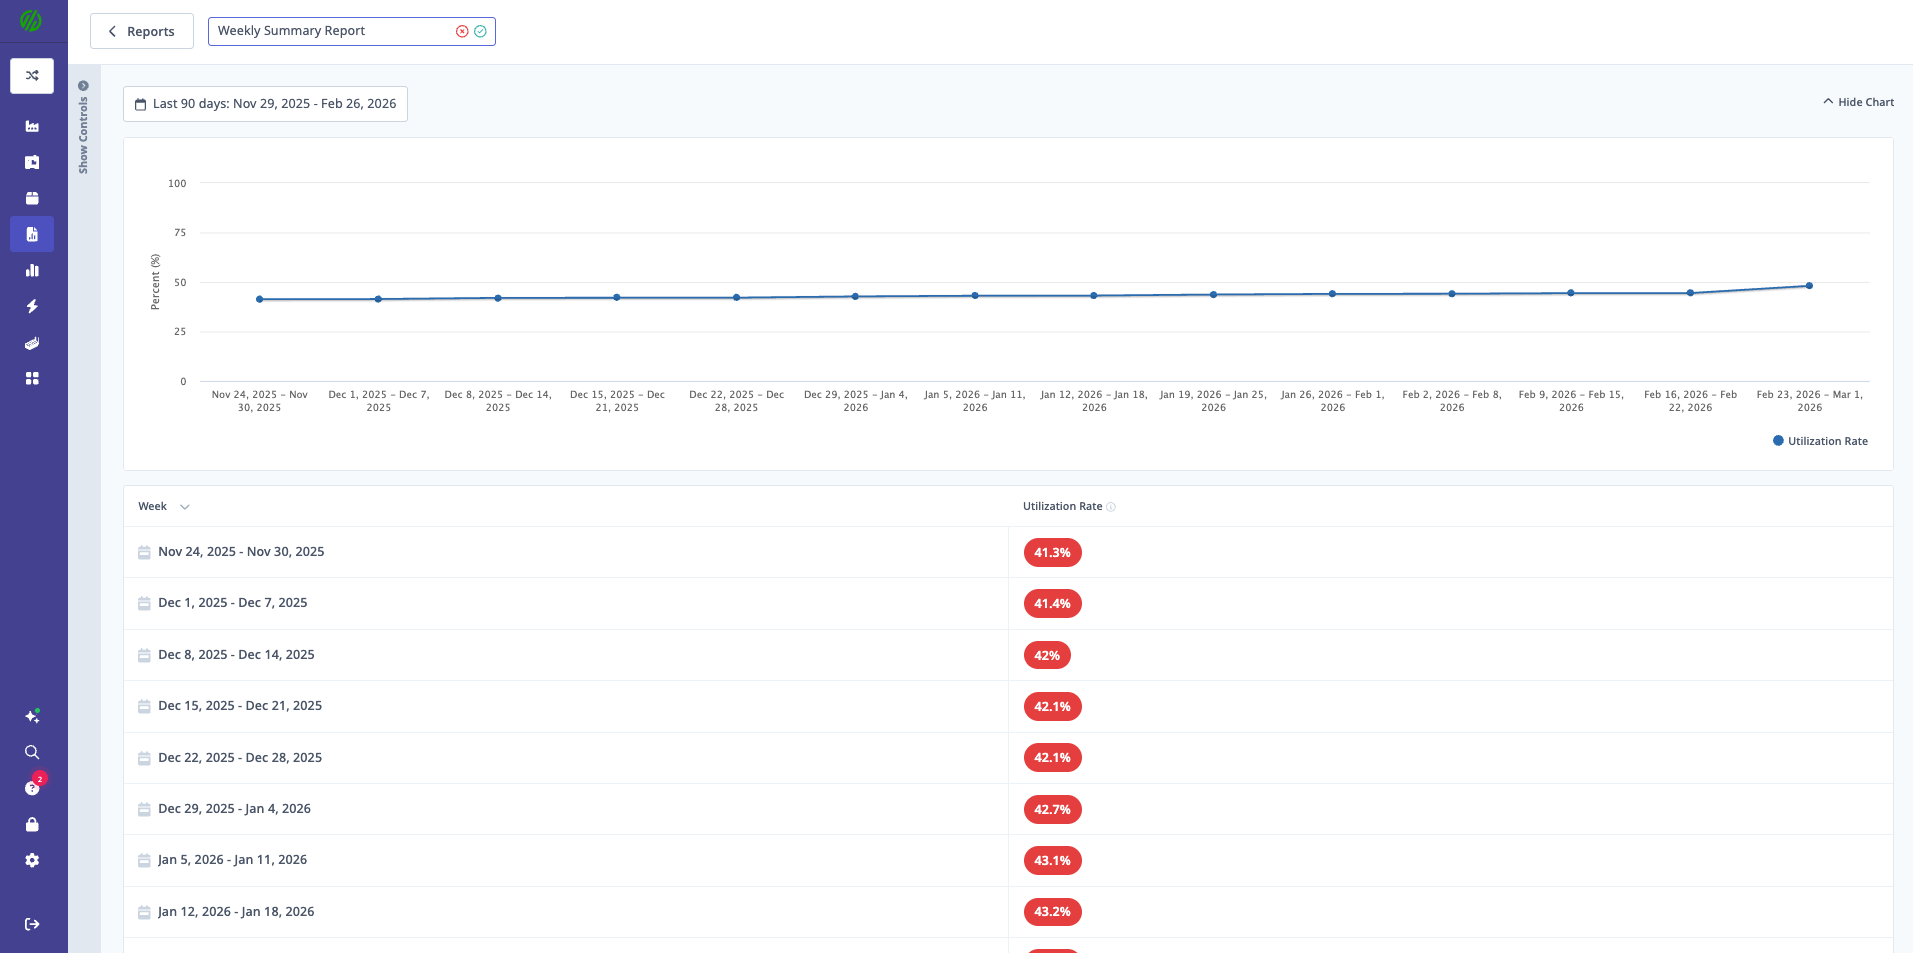
Report Display Options
Hide Controls:
- Toggle Hide Controls to maximize chart space
- Useful when presenting or sharing screen
- Charts expand to full view
Table View:
- Below charts, detailed table displays
- Shows exact values for all metrics
- Sortable columns (click headers)
- Expandable rows (if multiple groupings)
Chart Interactions:
- Hover over data points for details
- Click legend items to show/hide series
- Export chart as image (see Exporting)
Report Builder Best Practices
1. Start Broad, Refine Later
- Begin with all machines, all shifts
- Use filters to narrow focus once patterns emerge
2. Limit Hour Grouping
- Only use Hour grouping for short time windows (≤ 1 week)
- For longer periods, use Day or Week grouping
3. Logical Grouping Order
- Use larger → smaller intervals: Month → Week → Day
- Use hierarchical structure: Machine Group → Machine
4. Standardize Company Reports
- Create standard reports for weekly/monthly reviews
- Mark as Public for team consistency
- Name clearly: "Weekly OEE Report", "Monthly Downtime Summary"
5. Save Frequently
- Save reports you use regularly
- Avoid rebuilding same report each time
Scheduled Reports
What are Scheduled Reports?
Scheduled Reports automatically deliver Report Builder reports to selected users on a recurring schedule via email.
Key Features:
- Automated delivery (daily, weekly, monthly)
- Select specific recipients
- Attach report data (PDF or CSV)
- Include link to live report in MachineMetrics
Creating a Scheduled Report
Prerequisites:
- Report must be created in Report Builder first
- Manager or Executive access required
Step-by-Step:
- Navigate to Reports → Scheduled Reports
- Click Create Scheduled Report
- Select Report:
- Choose from saved Report Builder reports
- Preview report configuration
- Set Schedule:
- Frequency: Daily, Weekly, Monthly
- Day of Week (for weekly): Monday, Tuesday, etc.
- Day of Month (for monthly): 1st, 15th, Last Day, etc.
- Time: Hour to send (local time)
- Select Recipients:
- Choose users from list
- Add email addresses for external recipients
- Configure Attachment:
- None: Email includes link only
- PDF: Formatted report attached
- CSV: Raw data attached
- Preview Email (optional)
- Click Save
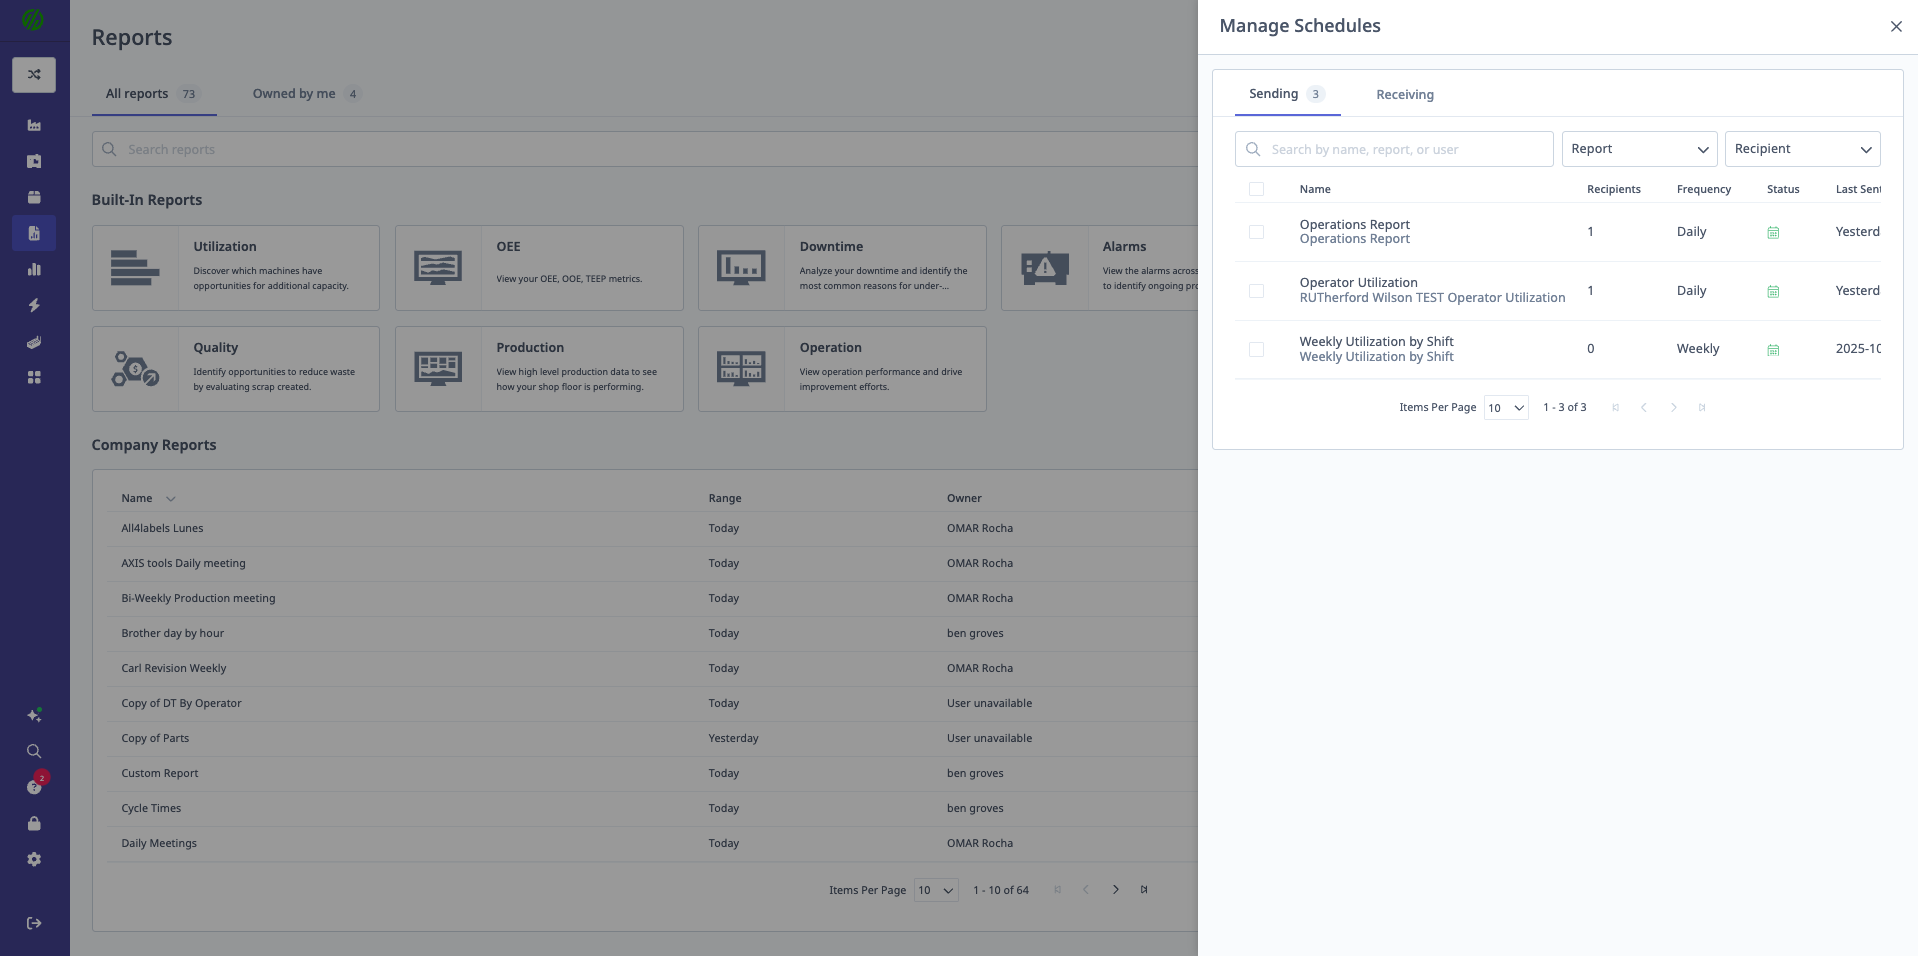
Managing Scheduled Reports
Viewing Scheduled Reports:
- Navigate to Reports → Scheduled Reports
- List shows:
- Report name
- Frequency
- Recipients
- Last sent date
- Next scheduled date
Editing Scheduled Reports:
- Find scheduled report in list
- Click Edit (pencil icon)
- Modify schedule, recipients, or attachment
- Click Save
Pausing Scheduled Reports:
- Click Pause (pause icon)
- Report stops sending
- Can be resumed later (click Resume)
Deleting Scheduled Reports:
- Click Delete (trash icon)
- Confirm deletion
- Report schedule removed permanently
Scheduled Report Email Format
Email Includes:
- Report name
- Date range covered
- Link to live report in MachineMetrics
- Attachment (if configured)
- "Update Email Preferences" link (recipients can unsubscribe)
Weekly Summary Reports
What are Weekly Summary Reports?
Weekly Summary Reports are automatically generated emails sent every Monday morning with utilization and downtime summaries for the previous week.
Key Features:
- Automatic generation (no setup required)
- Sent to all users with Manager or Executive role
- Compare last week vs. two weeks ago
- Highlight best week on record
- Downtime breakdown by category
Weekly Summary Content
Email Sections:
1. Utilization Summary
- Overall Utilization %: Last week's average
- 2 Weeks Ago: Previous week's utilization
- Weekly Change: Increase or decrease (color-coded)
- Best Week: Highest utilization on record (with date)
2. Downtime Summary
- Total Downtime Hours: Last week
- Downtime Percentage: Of total scheduled time
- Weekly Change: Increase or decrease (color-coded)
- Breakdown by Category: Top downtime reasons
3. Downtime Category Bar Chart
- Visual representation of downtime minutes by category
- Color-coded bars
4. Downtime Category Table
- Category: Downtime reason
- Duration: Total minutes
- Occurrences: Number of events
5. Link to Reports
- "View Full Reports" link to MachineMetrics
- Access detailed data and drill-down
Managing Weekly Summary Subscriptions
Unsubscribe:
- Click "Update Email Preferences" link in email footer
- Uncheck "Weekly Summary Reports"
- Click Save
Resubscribe:
- Navigate to Settings → User Profile → Email Preferences
- Check "Weekly Summary Reports"
- Click Save
Company-Wide Configuration:
- IT Admins can configure default subscriptions
- Navigate to Settings → Company Settings → Email Preferences
Exporting and Sharing Reports
Exporting Report Data
Export Table to CSV:
- Generate report
- Scroll to table view (below charts)
- Click Export Table button
- CSV file downloads
- Open in Excel, Google Sheets, or other tools
Access Requirement:
- Manager or Executive role required to export tables
CSV Format:
- Headers: Column names
- Rows: Data points
- Grouped data: Hierarchical structure preserved
Use Cases:
- Further analysis in Excel
- Import into other systems (ERP, BI tools)
- Custom charting or pivot tables
- External reporting to customers/stakeholders
Export Chart as Image:
- Generate report
- Hover over chart
- Click Export Chart icon
- Select format: PNG or SVG
- Image downloads
Use Cases:
- Presentations (PowerPoint, Google Slides)
- Documentation
- Sharing via email or messaging
Sharing Reports
Method 1: Public Reports
- Save report as Public
- Appears in "Company Reports" for all users
- Anyone can load and view
- Best for: Standard reports used by multiple people
Method 2: Scheduled Reports
- Automatically email to recipients
- Set schedule (daily, weekly, monthly)
- Best for: Regular reporting cadence
Method 3: Export and Email
- Export to CSV or chart image
- Manually email to recipients
- Best for: One-off sharing or external stakeholders
Method 4: Share Link
- Copy URL from browser address bar
- Send to MachineMetrics users
- Recipient opens link to view report
- Best for: Quick sharing with colleagues
Report Access Permissions
Who Can View Reports:
- All users with Supervisor, Manager, Executive, or IT Admin roles
Who Can Export Tables:
- Manager or Executive roles only
Who Can Create/Edit Reports:
- Supervisor, Manager, Executive, or IT Admin roles
Who Can Delete Reports:
- Report creator
- IT Admin
Who Can Create Scheduled Reports:
- Manager or Executive roles
Best Practices
Report Organization
Naming Conventions:
- Use descriptive names: "Weekly OEE - Mill Group", "Daily Downtime - All Machines"
- Include frequency if recurring: "Monthly Production Summary"
- Include scope: "Q1 2026 Performance Review"
Public vs. Private:
- Public: Standard reports for regular use (weekly OEE, daily downtime)
- Private: One-off analyses or personal tracking
Company Reports Library:
- Create standard set of reports for organization
- Examples:
- Daily Utilization Report
- Weekly OEE Report
- Monthly Downtime Summary
- Quarterly Performance Review
Report Usage Patterns
Daily:
- Utilization Report (yesterday)
- Parts Report (yesterday)
- Alarms Report (last 24 hours)
Weekly:
- OEE Report (last 7 days)
- Downtime Report (last 7 days with Pareto)
- Setup Report (last 7 days)
- Weekly Summary Report (automatic email)
Monthly:
- OEE Report (last 30 days, grouped by week)
- Quality Report (last 30 days)
- Production Report (last 30 days, by machine group)
- Cost analysis (Report Builder custom report)
Quarterly:
- Trend analysis (90 days, grouped by month)
- Benchmark report (compare quarters)
- Strategic review (custom Report Builder)
Data Quality for Reporting
To Ensure Accurate Reports:
1. Categorize Downtime
- Train operators to categorize all downtime
- Review uncategorized downtime weekly
- Correct miscategorized events
2. Track Production Runs
- Ensure operators start/stop operations
- Use APM where possible for automatic tracking
- Audit production runs regularly
3. Configure Shifts Correctly
- Set up shifts in Settings
- Assign shifts to machines
- Update when shift schedules change
4. Set Scheduled Time Appropriately
- Define attended vs. unattended shifts
- Mark planned downtimes (PM, breaks)
- See Understanding Your Data Guide
5. Validate Data Regularly
- Spot-check reports against shop floor reality
- Investigate anomalies (sudden OEE drops, unusual downtime spikes)
- Correct data issues promptly
Report Builder Tips
Performance Optimization:
- Avoid Hour grouping for long date ranges (> 1 week)
- Limit number of metrics selected (5-10 max for readability)
- Use filters to reduce data volume
Readability:
- Choose appropriate chart type:
- Line charts: Trends over time
- Bar charts: Comparisons across machines/shifts
- Limit grouped breakdowns to 2-3 levels
- Use clear, descriptive names
Actionable Insights:
- Focus on metrics you can improve
- Pair leading indicators (utilization, cycle time) with lagging indicators (OEE, parts produced)
- Compare actual vs. targets (set baselines)
Getting Help
Common Questions
"Report is blank or shows no data"
- Check date range (is it in the past?)
- Verify filters (are machines/shifts selected correctly?)
- Confirm data exists for period (were machines running?)
- Check shift configuration (is scheduled time set?)
"Export Table button is grayed out"
- Requires Manager or Executive role
- Contact IT Admin to adjust permissions
"Scheduled report didn't send"
- Check email preferences (user may have unsubscribed)
- Verify schedule settings (correct time/day?)
- Check spam folder
- Contact support if issue persists
"Report Builder metrics missing"
- Some metrics restricted based on grouping
- Downtime metrics unavailable when grouping by Hour
- Some metrics require specific machine connectivity (Spindle-Rotating, In-Cut)
"Weekly Summary email not received"
- Check email preferences (may be unsubscribed)
- Requires Manager or Executive role
- Check spam folder
- Verify email address in user profile
Before Contacting Support
Gather Information:
- Report name (or describe custom report configuration)
- Date range selected
- Filters applied
- Screenshot of issue
- Expected vs. actual results
Try These Steps:
- Refresh page (F5 or Cmd+R)
- Clear browser cache and reload
- Try different date range (verify data exists)
- Remove filters and rebuild incrementally
- Check access permissions (role requirements)
Contact Support
MachineMetrics Support:
- Email: support@machinemetrics.com
- Include:
- Report name or configuration details
- Date range and filters used
- Screenshot of issue
- Expected behavior vs. actual behavior
- Steps to reproduce
For Training:
- Request Report Builder training session
- Ask about advanced reporting techniques
- Schedule team training for standard reports
- Request custom report creation assistance
Next Steps:
- Create your first custom report: Report Builder
- Set up scheduled reports: Scheduled Reports
- Review production data: Production & Analytics Guide
- Understand OEE metrics: Understanding Your Data Guide
Questions? Contact support@machinemetrics.com