Machines & Machine View Guide
Overview
What is the Machines Page?
The Machines Page is your primary interface for monitoring individual machine performance and accessing detailed machine data. It provides real-time status, historical trends, and drill-down capabilities for every machine in your operation.
Key Capabilities:
- View live machine status and execution state
- Track utilization, parts, downtime, OEE, and alarms
- Compare operations, operators, and shifts
- Analyze timeline with operational and diagnostic data
- Categorize downtime and correct part counts
- Access machine settings and diagnostics
Page Structure:
- Machine Switcher (left sidebar): Live list of all machines
- Machine Overview (main area): Detailed metrics and tables
- Timeline Tab: Visual timeline with operational events
- Diagnostics Tab: Machine health and diagnostic data
- Settings Tab: Machine configuration and connectivity
Accessing the Machines Page
Main Navigation
From Any Page:
- Click Machines in the left sidebar navigation
- Page loads with Machine Switcher and last-viewed machine
Direct Machine Access:
- From Company Dashboard: Click machine name in "Utilization: Lower than expected" widget
- From Dashboards: Click machine tile on Current Shift or Machines List dashboard
- From Reports: Click machine name in any report
- From URL: Bookmark specific machine URLs for quick access
Machine Switcher
Overview
The Machine Switcher is the live list of machines displayed on the left side of the Machines page. It provides at-a-glance status and quick navigation.
Switcher Controls
Search Machines
Using Search:
- Click search box at top of switcher
- Type machine name
- List filters in real-time
- Click machine to view
Search Tips:
- Partial names work (e.g., "Mill" finds "Mill #3", "Mill #7")
- Not case-sensitive
- Searches machine name only (not group or status)
Filter Machines
Available Filters:
- Machine Groups: Filter by department or machine type
- Status: Filter by execution state (Active, Idle, Off, Unknown)
- Combination: Use both filters together
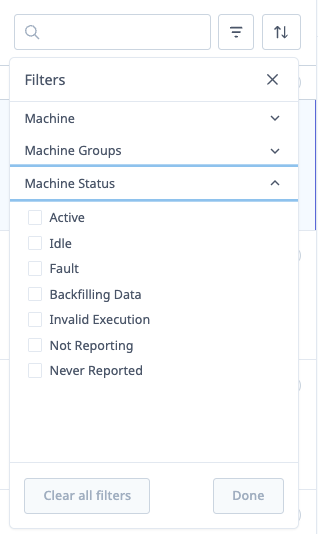
Filtering Steps:
- Click Filter button (funnel icon)
- Select Machine Groups:
- All Machines (default)
- CNC Mills
- Lathes
- Grinders
- (Your custom groups)
- Select Status:
- All States (default)
- Active
- Idle
- Off
- Unknown
- Click Apply
- Switcher updates to show filtered machines only
Clear Filters:
- Click Clear or select "All Machines" + "All States"
Sort Machines
Sort Options:
- Default Machine Order: Your configured machine order
- Top Performing: Highest utilization/OEE first
- Lowest Performing: Lowest utilization/OEE first
- Machine Name (A-Z): Alphabetical ascending
- Machine Name (Z-A): Alphabetical descending
- Earliest Active Time: First machines to start today
- Latest Active Time: Last machines to start today
- Top Trending: Biggest improvement vs previous period
- Lowest Trending: Biggest decline vs previous period
- Operation (A-Z): Current operation alphabetically
- Operation (Z-A): Current operation reverse alphabetically
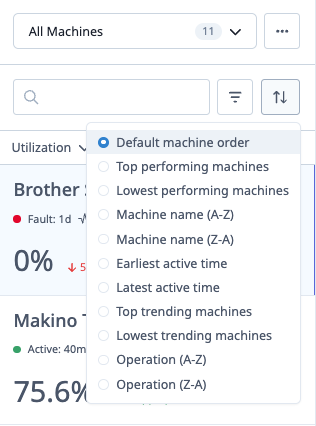
Changing Sort:
- Click Sort dropdown
- Select sort option
- Switcher reorders immediately
Use Cases:
- Top/Lowest Performing: Identify best/worst machines quickly
- Trending: Spot improvements or declines
- Earliest/Latest Active: Track shift start-up
- Operation: Group machines running similar jobs
Change Hero Metric
The Hero Metric is the large primary metric displayed on each machine card in the switcher.
Available Metrics:
- Utilization %: Percentage of scheduled time machine is active
- OEE %: Overall Equipment Effectiveness
- Parts Goal: Progress toward daily/shift part goal
Changing Hero Metric:
- Click Hero Metric dropdown (top of switcher)
- Select desired metric
- All machine cards update to show selected metric
When to Use Each:
- Utilization: Focus on machine uptime
- OEE: Comprehensive efficiency view
- Parts Goal: Production volume focus
Switcher Content
Each Machine Card Displays:
- Machine Name: Top of card
- Hero Metric: Large number (utilization/OEE/parts goal)
- Execution Status: Color-coded indicator
- 🟢 Active: Machine in-cycle
- 🟡 Idle: Machine ready but not cutting
- ⚫ Off: Machine powered off
- ⚪ Unknown: Status cannot be determined
- Current Operation: Operation name (if assigned)
- First Active Time: When machine first became active today
- Variance: Change from baseline (if applicable)
Card Colors:
- Green border: Performance above baseline
- Red border: Performance below baseline
- Gray border: No significant variance
Clicking a Machine Card:
- Loads machine overview in main area
- Highlights selected machine in switcher
- URL updates (bookmarkable)
Creating Custom Views
Save Favorite Machine Subset:
- Filter and sort switcher as desired
- Click Save View button
- Enter view name (e.g., "Second Shift Lathes")
- Click Save
- View appears in Saved Views dropdown
Loading Saved Views:
- Click Saved Views dropdown
- Select view name
- Filters and sort apply automatically
Managing Views:
- Click Edit next to saved view to modify
- Click Delete to remove
- Views are saved to your user profile
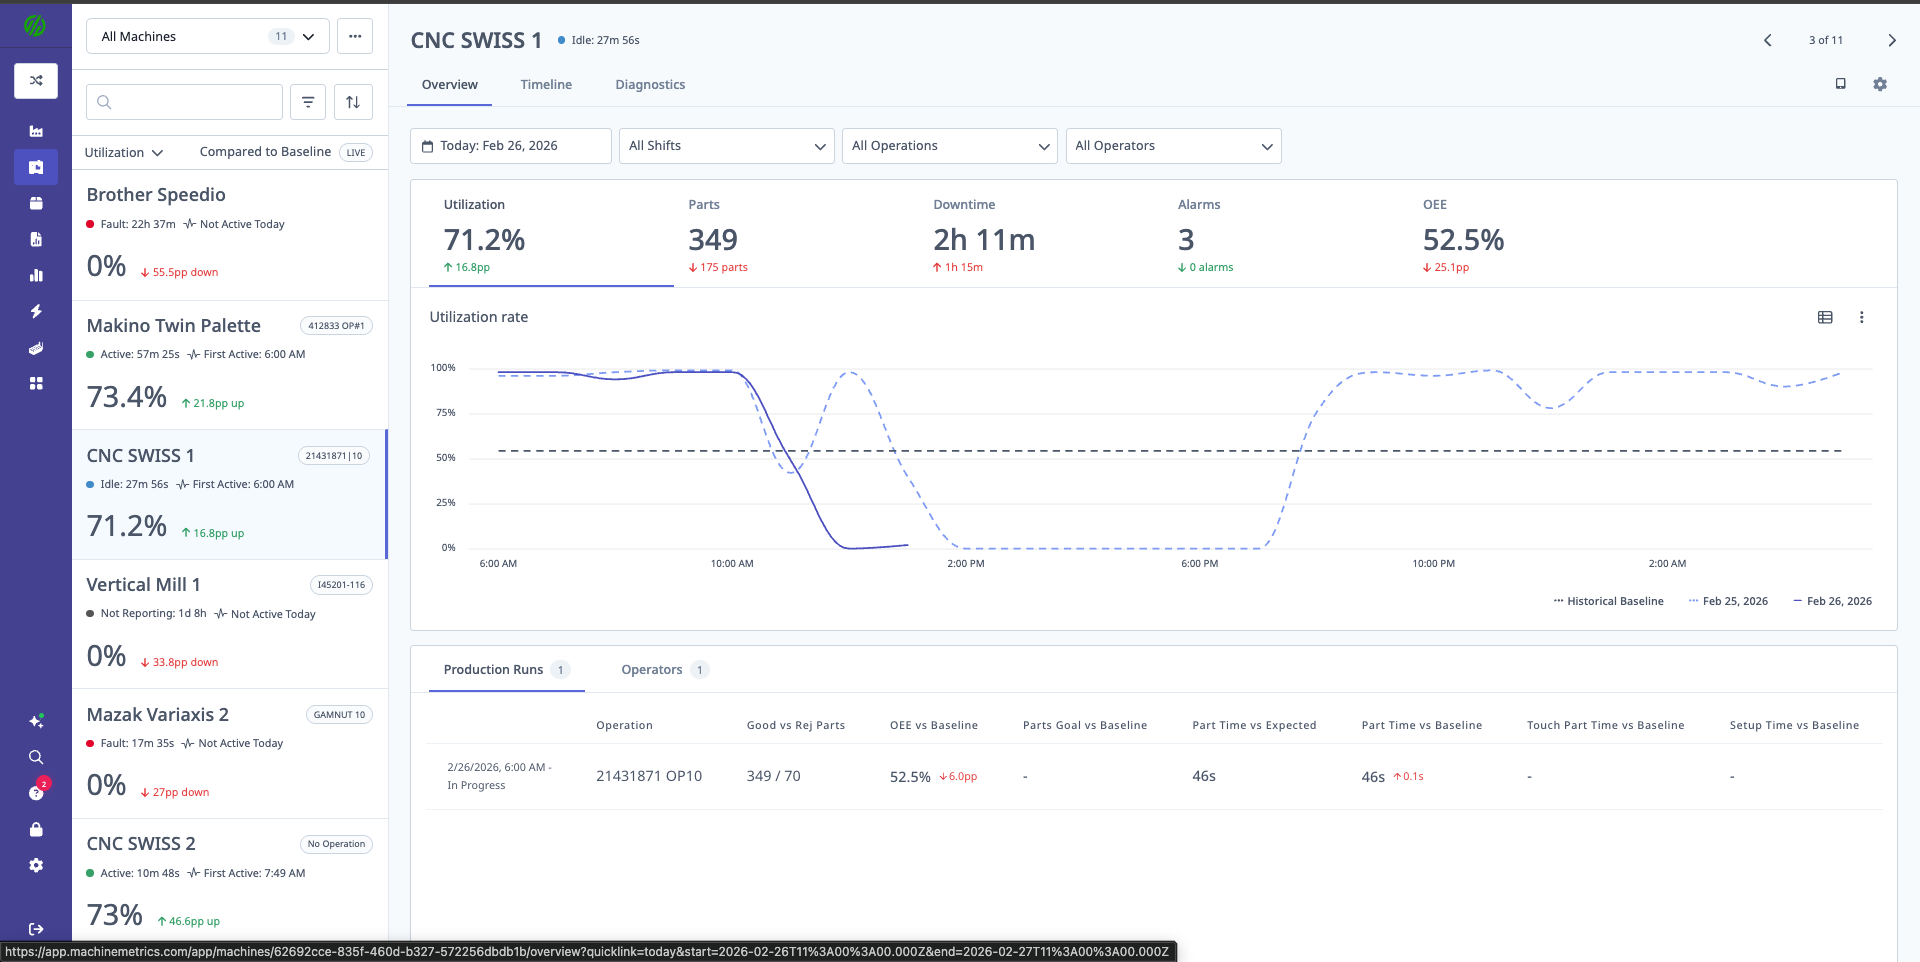
Individual Machine Overview
Page Layout
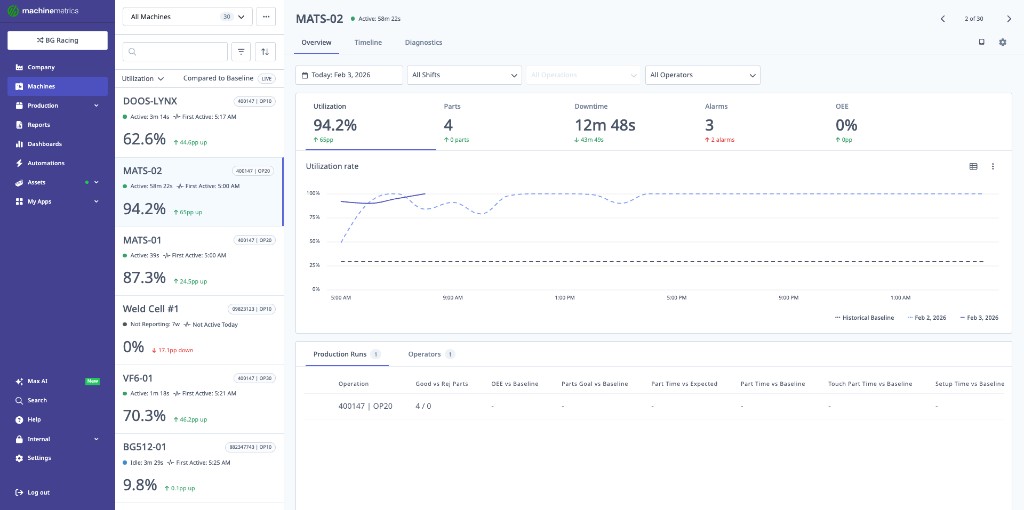
The main area displays detailed information for the selected machine:
- Machine Name (top left)
- Controls (date picker, filters)
- Metric Tabs (utilization, parts, downtime, OEE, alarms)
- Production Tables (operations, operators)
- Quick Links (Timeline, Diagnostics, Settings)
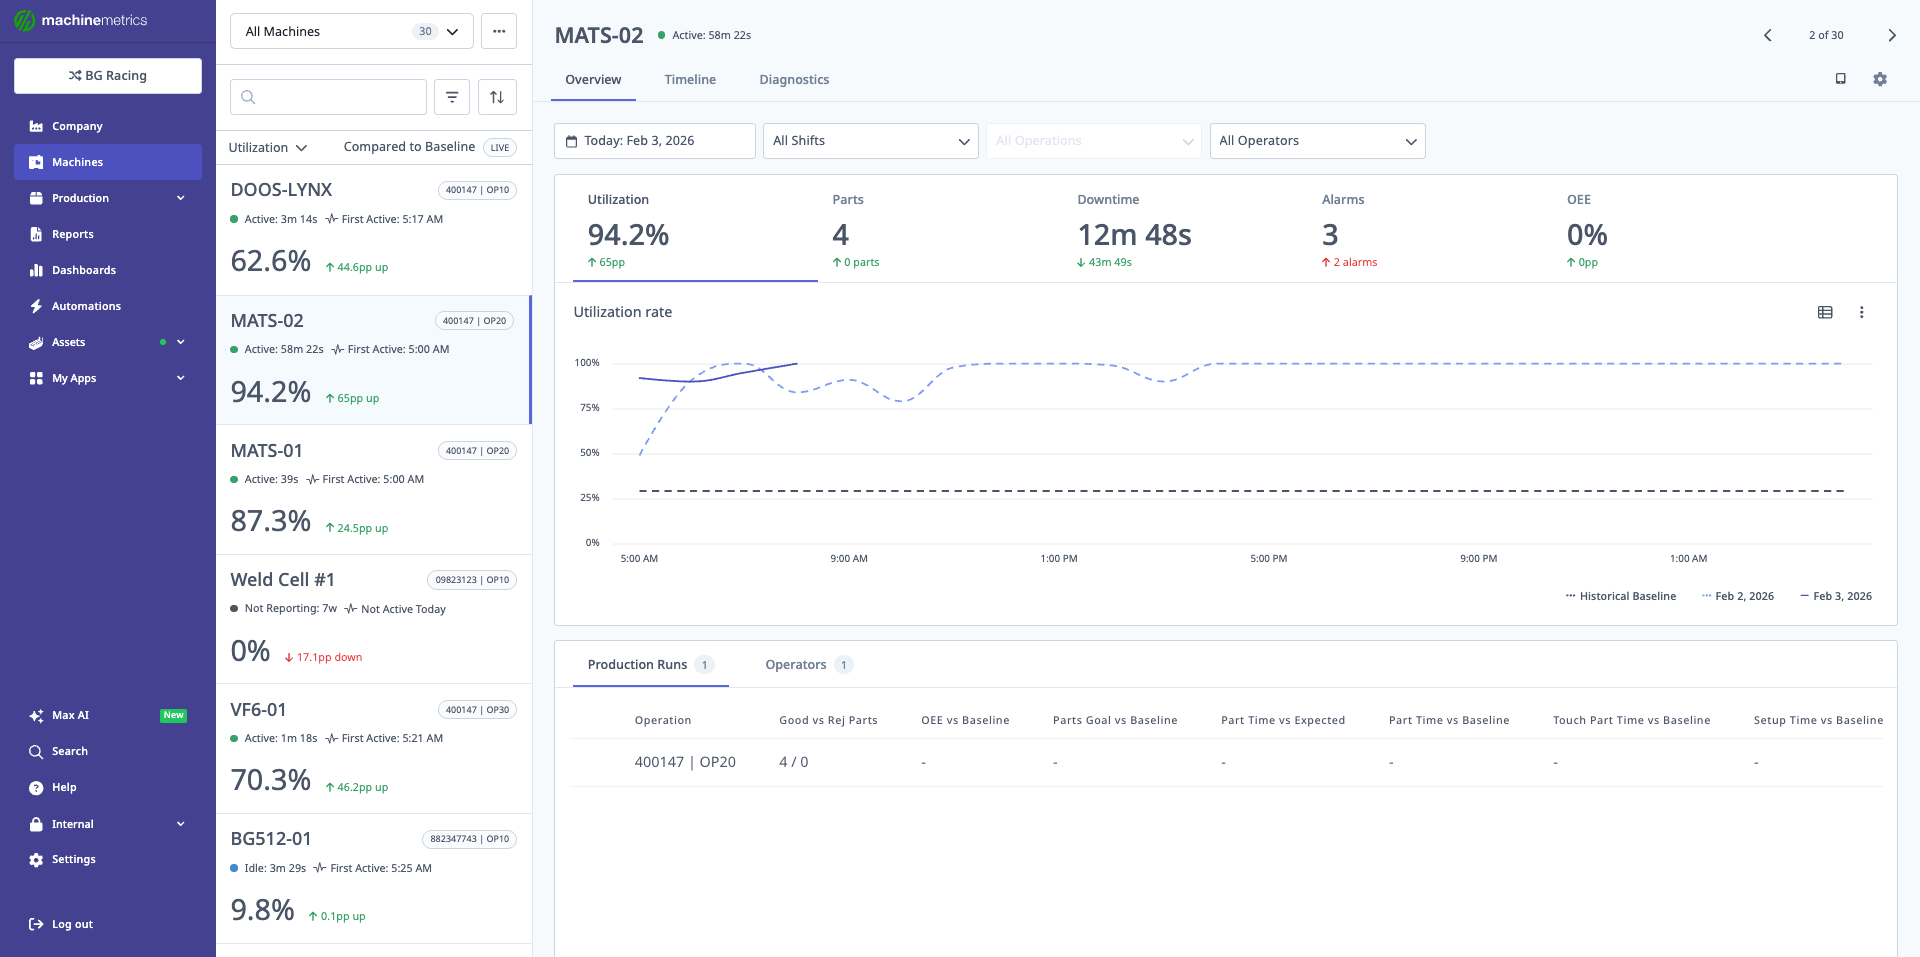
The Machine Overview page displays key metrics including utilization (94.2%), parts produced (4), downtime (12m 48s), and OEE (0%). The utilization rate chart shows performance trends with a comparison to historical baseline. Production run details are shown at the bottom with operation and operator information.
Overview Controls
Date Picker:
- Select date range for all data on page
- Options: Today, Yesterday, Last 7 Days, custom range
- Max range: 90 days
Shifts Filter:
- Filter data to specific shifts
- Multi-select supported
- Useful for comparing shift performance
Operations Filter:
- Show data for specific operations only
- Useful for isolating operation-specific issues
Operators Filter:
- Filter to specific operators
- Analyze operator performance
- Compare operator efficiency
Combining Filters:
Example: "Show Operation ABC on Second Shift run by Operator John"
- Date: Last 7 Days
- Shift: Second Shift
- Operation: ABC
- Operator: John
Metric Tabs
Utilization Tab
Displays:
- Utilization %: Active time / Scheduled time
- Chart View: Utilization over time (hourly/daily bars)
- Table View: Detailed breakdown by day/shift
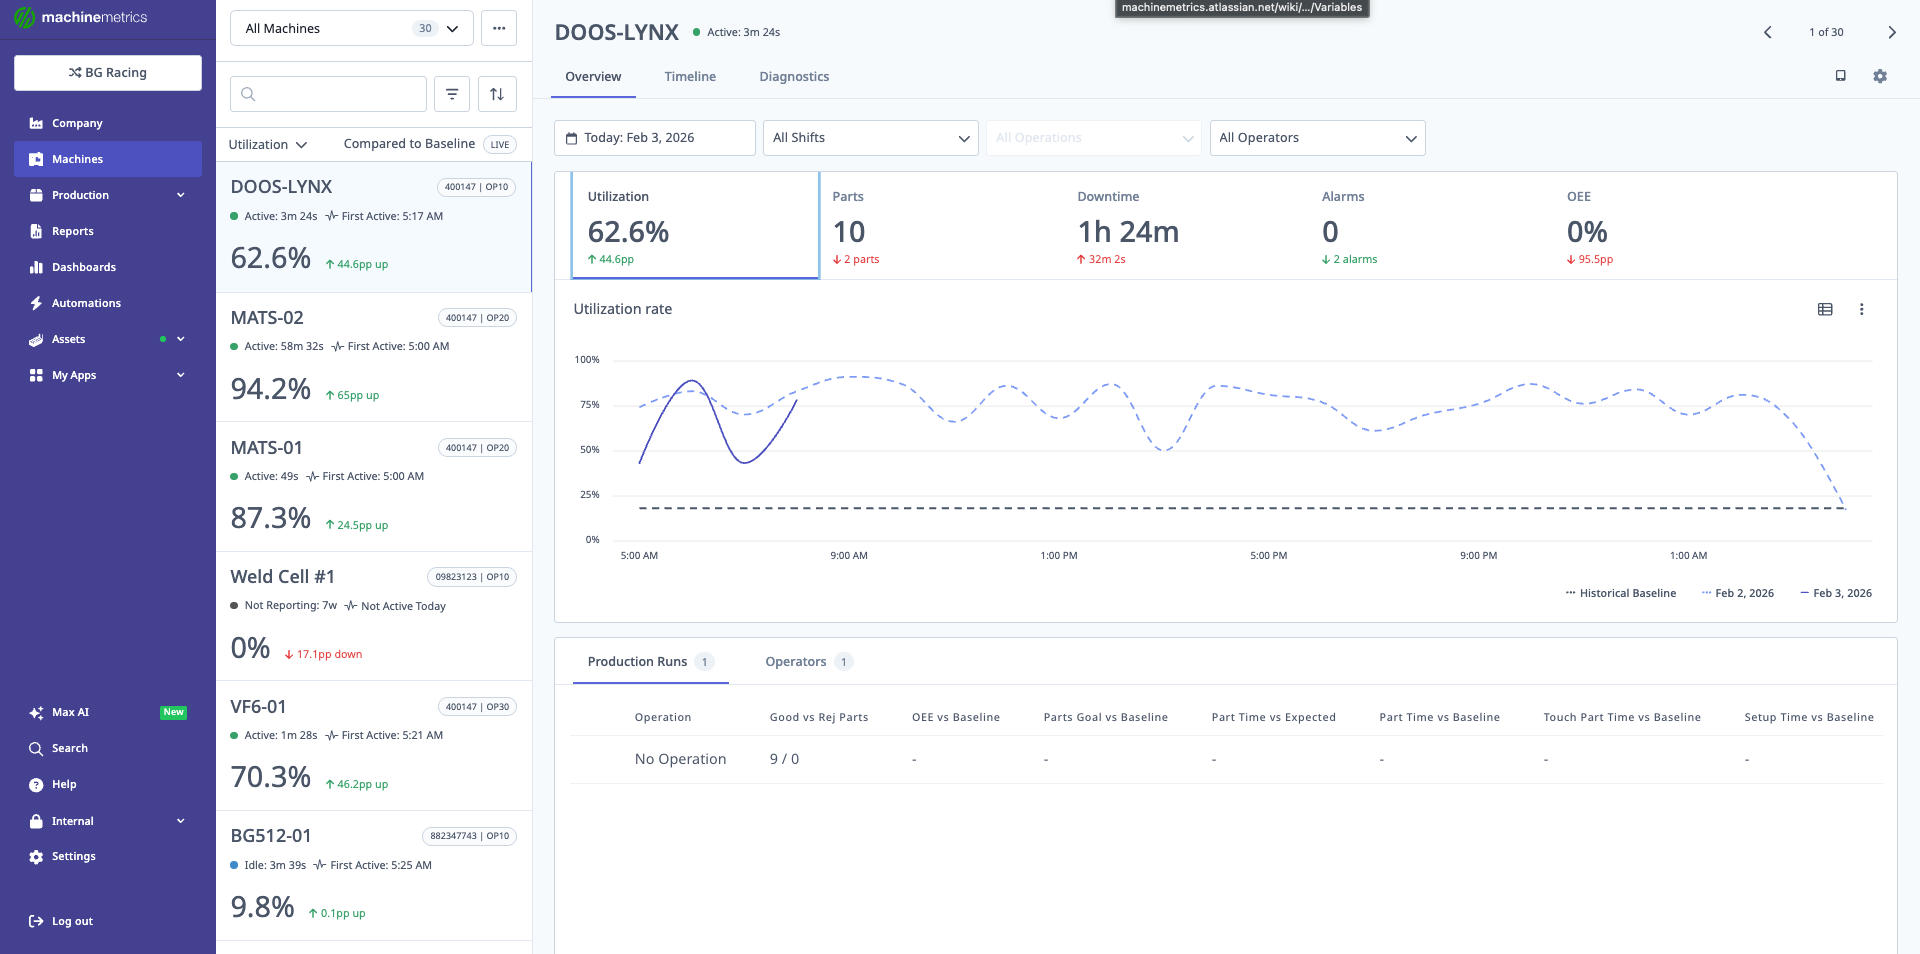
The utilization rate chart shows machine performance over time compared to historical baseline. This view helps identify low-utilization periods and spot trends.
Chart Types:
- Bar Chart: Utilization by hour or day
- Line Chart: Utilization trend over time
Insights:
- Identify low-utilization periods
- Compare shifts
- Spot trends (improving/declining)
Parts Tab
Displays:
- Total Parts: All parts produced
- Good Parts: Parts passing quality
- Rejected Parts: Scrap and non-conforming
- Chart View: Parts over time
- Table View: Parts by day/shift/operation
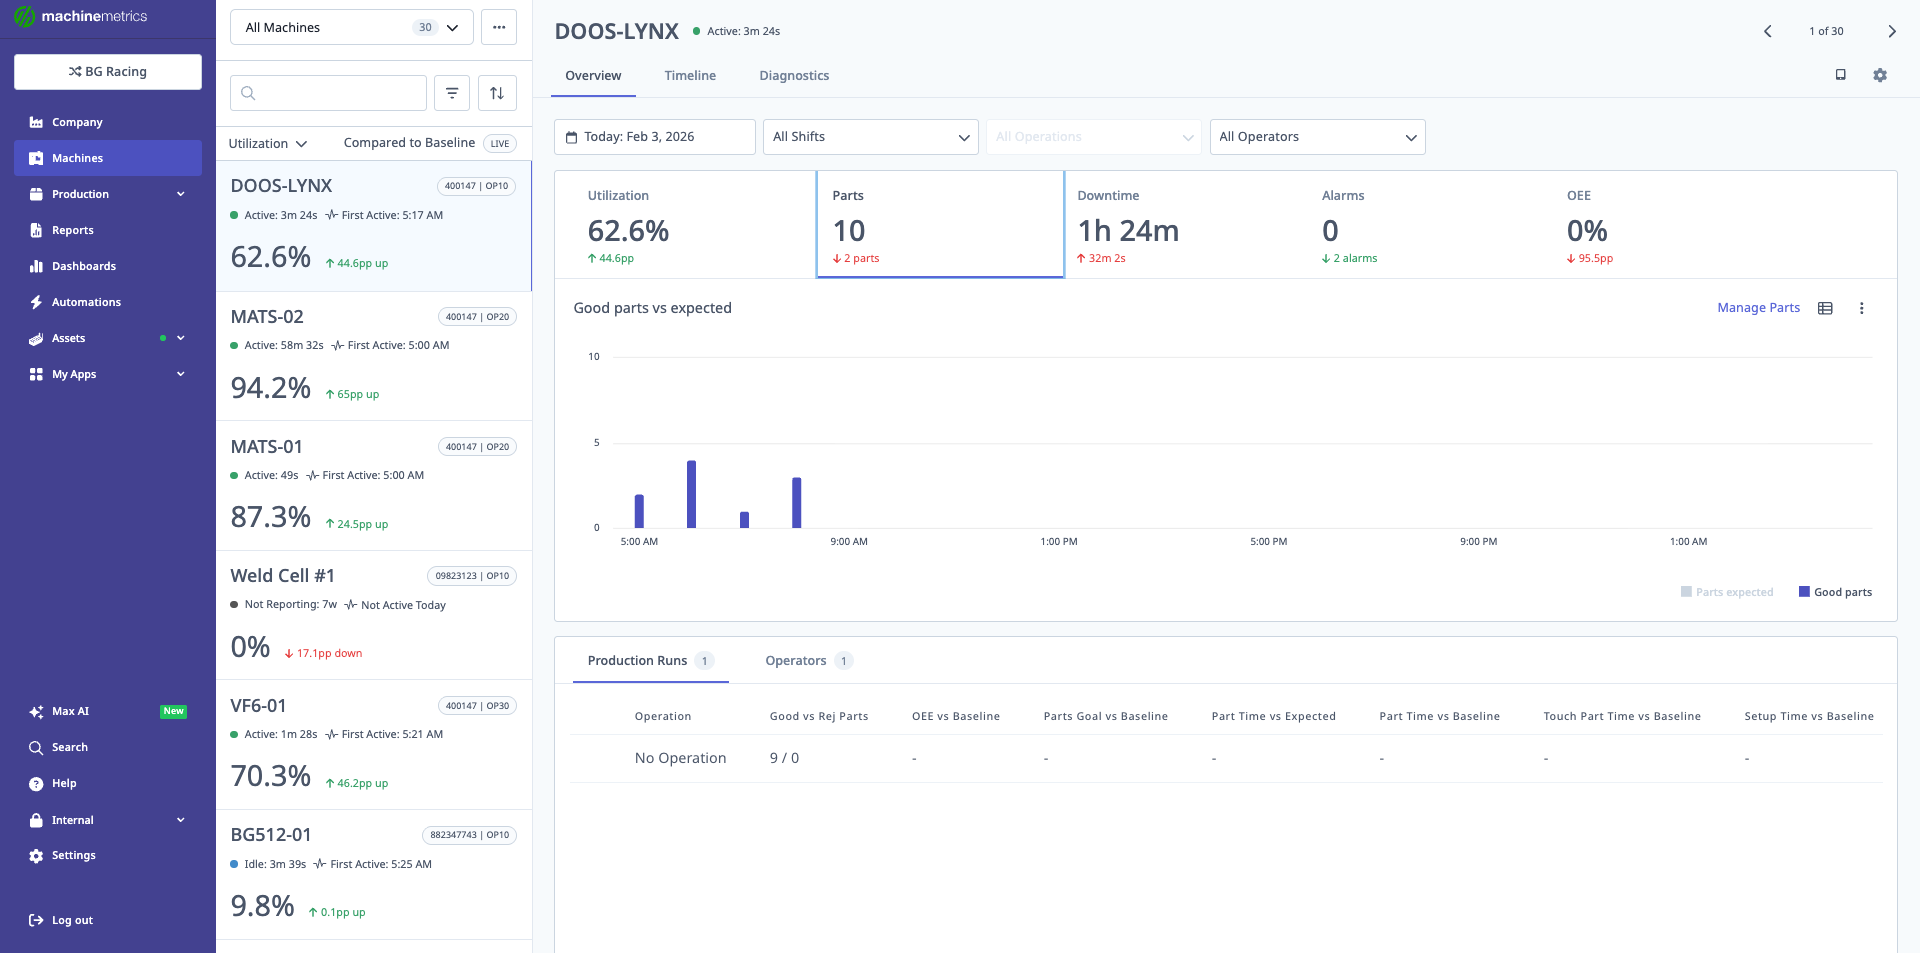
The parts chart displays good parts produced versus expected over the selected time period, helping track production goals and identify gaps.
Features:
- Part Corrections: Add or subtract parts (see Part Corrections)
- Reject Parts: Mark parts as scrap (see Part Corrections)
Use Cases:
- Verify part counts
- Track quality (good vs reject ratio)
- Identify high-scrap periods
Downtime Tab
Displays:
- Total Downtime: All downtime in period
- Categorized Downtime: Breakdown by reason
- Uncategorized Downtime: Events without reason assigned
- Pareto Chart: Top downtime reasons
- Table View: All downtime events
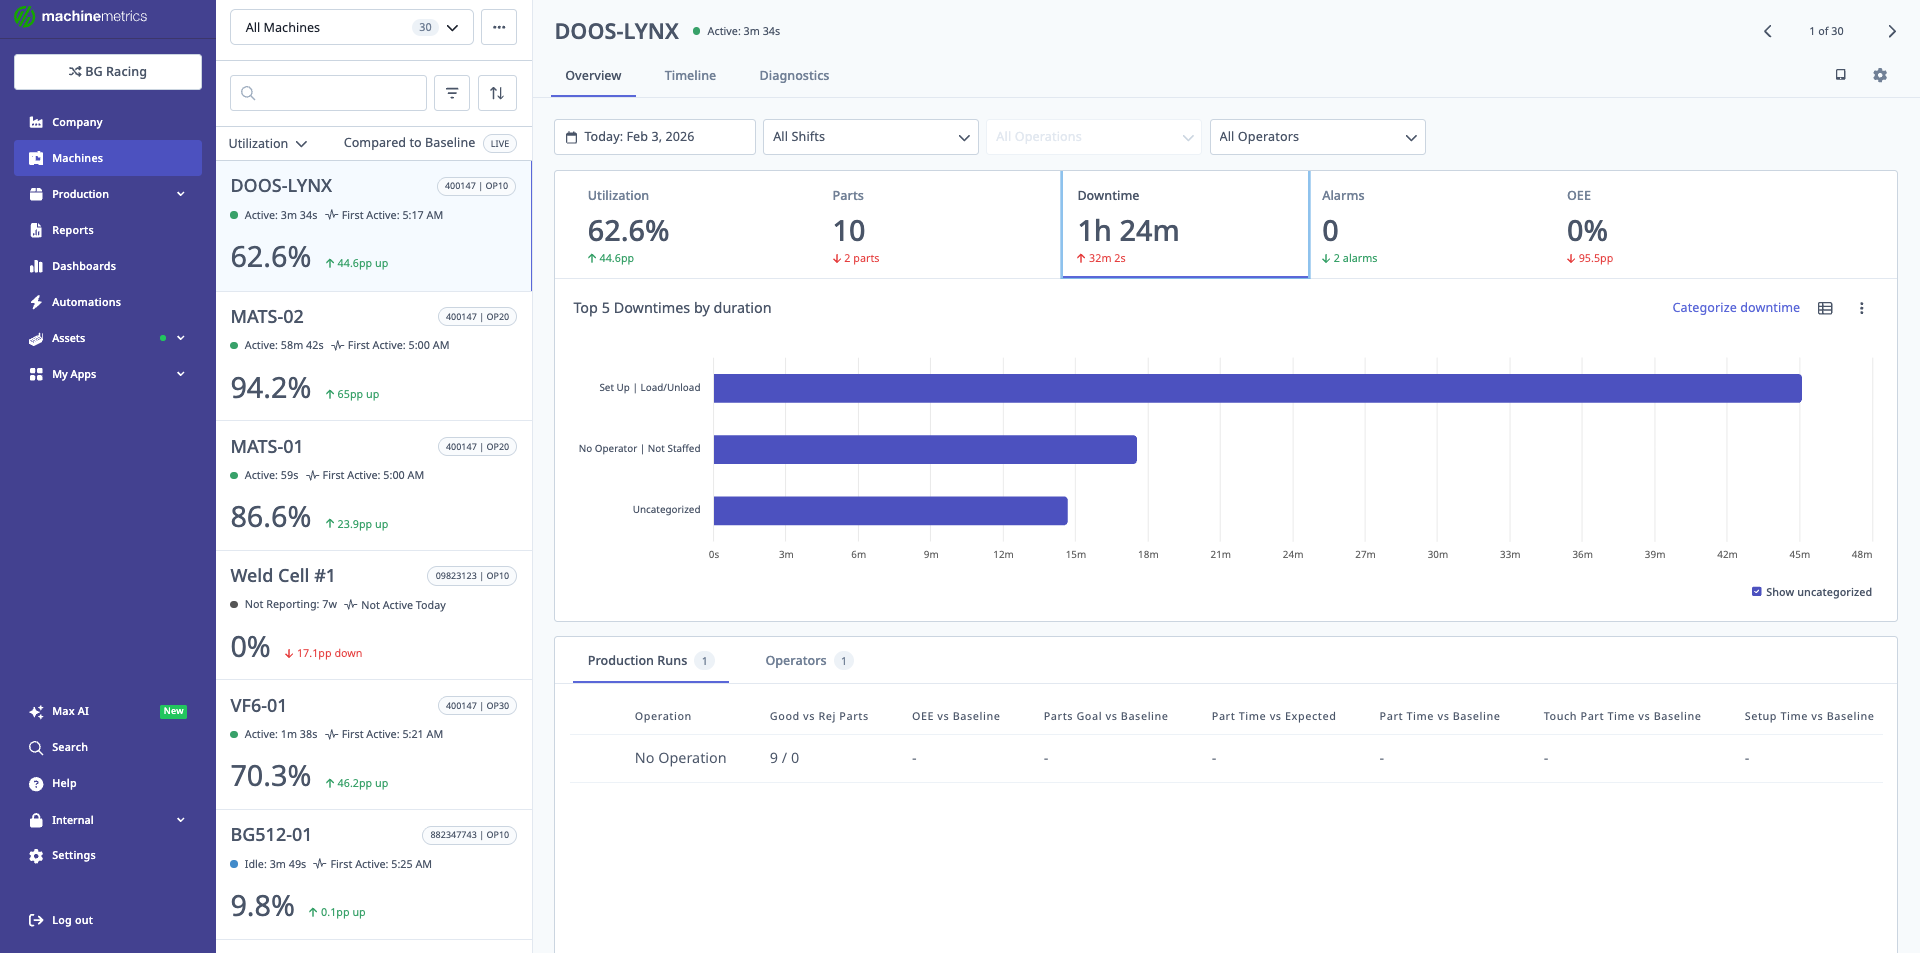
The downtime Pareto chart shows the top 5 downtime reasons by duration, making it easy to identify the biggest opportunities for improvement. In this example, "Set Up / Load/Unload" accounts for the most downtime.
Features:
- Bulk Categorization: Select multiple events, assign reason (see Categorizing Downtime)
- Edit Downtime: Change reason, split events, merge events
- Filter by Category: Show only specific downtime types
Downtime Types:
- Planned: Breaks, PM, scheduled changeovers
- Unplanned: Breakdowns, waiting for material, tooling issues
Color Coding:
- 🔴 Red: Unplanned downtime
- 🟡 Yellow: Planned downtime
- ⚫ Gray: Uncategorized
OEE Tab
Displays:
- OEE %: Overall Equipment Effectiveness
- Availability %: Uptime / Planned production time
- Performance %: Actual speed / Ideal speed
- Quality %: Good parts / Total parts
- Chart View: OEE components over time
- Table View: Daily OEE breakdown
OEE Formula:
OEE = Availability × Performance × Quality
Example:
Availability: 95%
Performance: 85%
Quality: 98%
OEE = 0.95 × 0.85 × 0.98 = 79.1%
Insights:
- Identify which component is limiting OEE
- Low Availability → Reduce downtime
- Low Performance → Improve cycle times
- Low Quality → Address quality issues
Alarms Tab
Displays:
- Total Alarms: Alarm count in period
- Top Alarms: Most frequent alarm codes
- Pareto Chart: Alarms by frequency
- Table View: All alarm events with timestamps
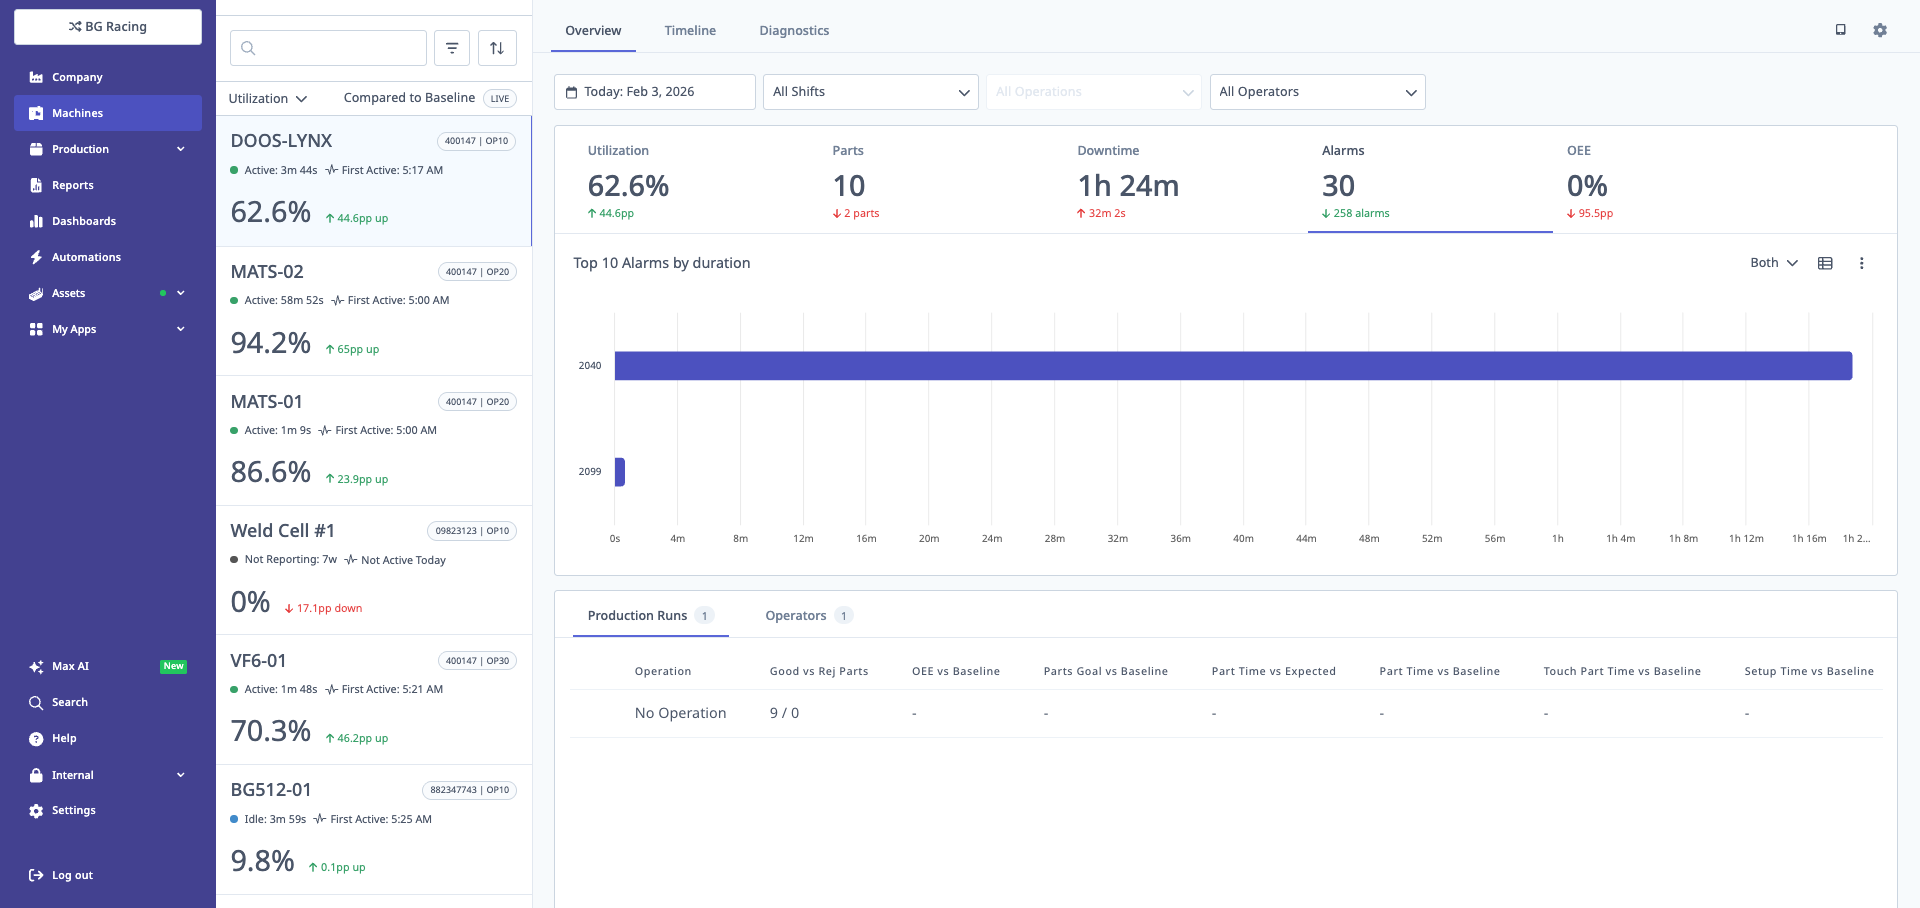
The alarms chart shows the top 10 alarms by duration, helping identify the most impactful machine issues.
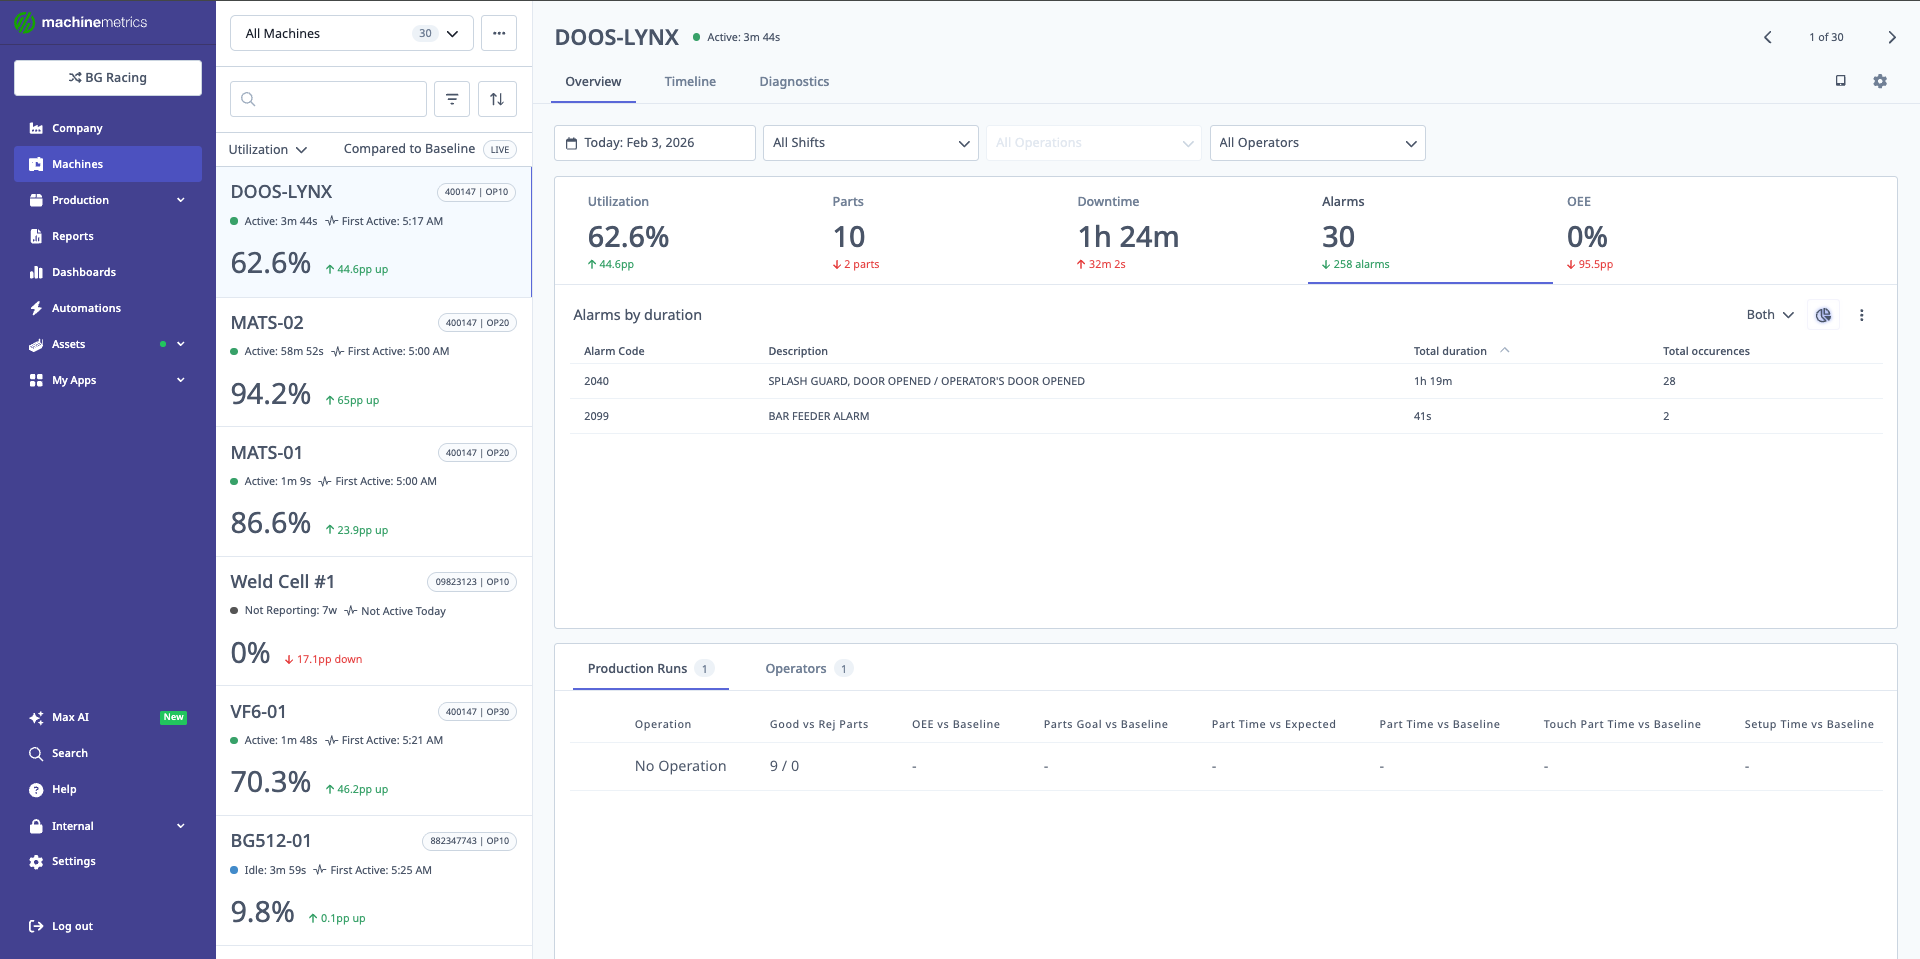
The alarms table provides detailed information including alarm code, description, total duration, and occurrence count. This example shows splash guard and bar feeder alarms with their respective durations and frequencies.
Alarm Data:
- Alarm code
- Alarm message/description
- Timestamp
- Duration (if applicable)
- Associated downtime
Use Cases:
- Identify recurring alarms
- Correlate alarms with downtime
- Prioritize maintenance actions
- Track alarm resolution time
View Modes: Chart vs Table
Toggle Between Views:
- Click Chart or Table button on each metric tab
- View preference is saved per metric
When to Use Chart:
- Spot trends over time
- Visual comparison (e.g., comparing days)
- Quick pattern recognition
When to Use Table:
- Detailed data analysis
- Export data (copy/paste)
- Precise values needed
Production Tables
Operations Table
Displays for each operation run:
- Operation Name
- Good Parts vs Expected: Actual vs target
- Rejected Parts: Scrap count
- OEE %: Operation-specific OEE
- Utilization %: Operation-specific utilization
- Setup Performance: Setup hours vs expected
- Cycle Time vs Expected: Current median vs target
- Baseline Cycle Time: 3-month median baseline
- Touch Time: Median time between cycles
Sorting:
- Click column header to sort
- Click again to reverse sort
Filtering:
- Use Operations filter to show subset
Insights:
- Good vs Expected < 100%: Underproducing
- High Setup Performance: Setup taking too long
- Cycle Time > Expected: Running slower than target
- Cycle Time > Baseline: Performance degrading over time
Operators Table
Displays for each operator:
- Operator Name
- Utilization %: When operator was logged in
- Good Parts vs Expected: Operator's production vs target
- Rejected Parts: Operator's scrap count
- OEE %: Operator-specific OEE
- Active Time: Total time operator was on machine
Use Cases:
- Compare operator performance
- Identify training needs
- Recognize top performers
- Investigate quality issues by operator
Best Practices:
- Focus on trends, not absolute comparisons
- Account for different operations/products
- Consider experience levels
- Use for coaching, not punishment
Timeline View
Overview
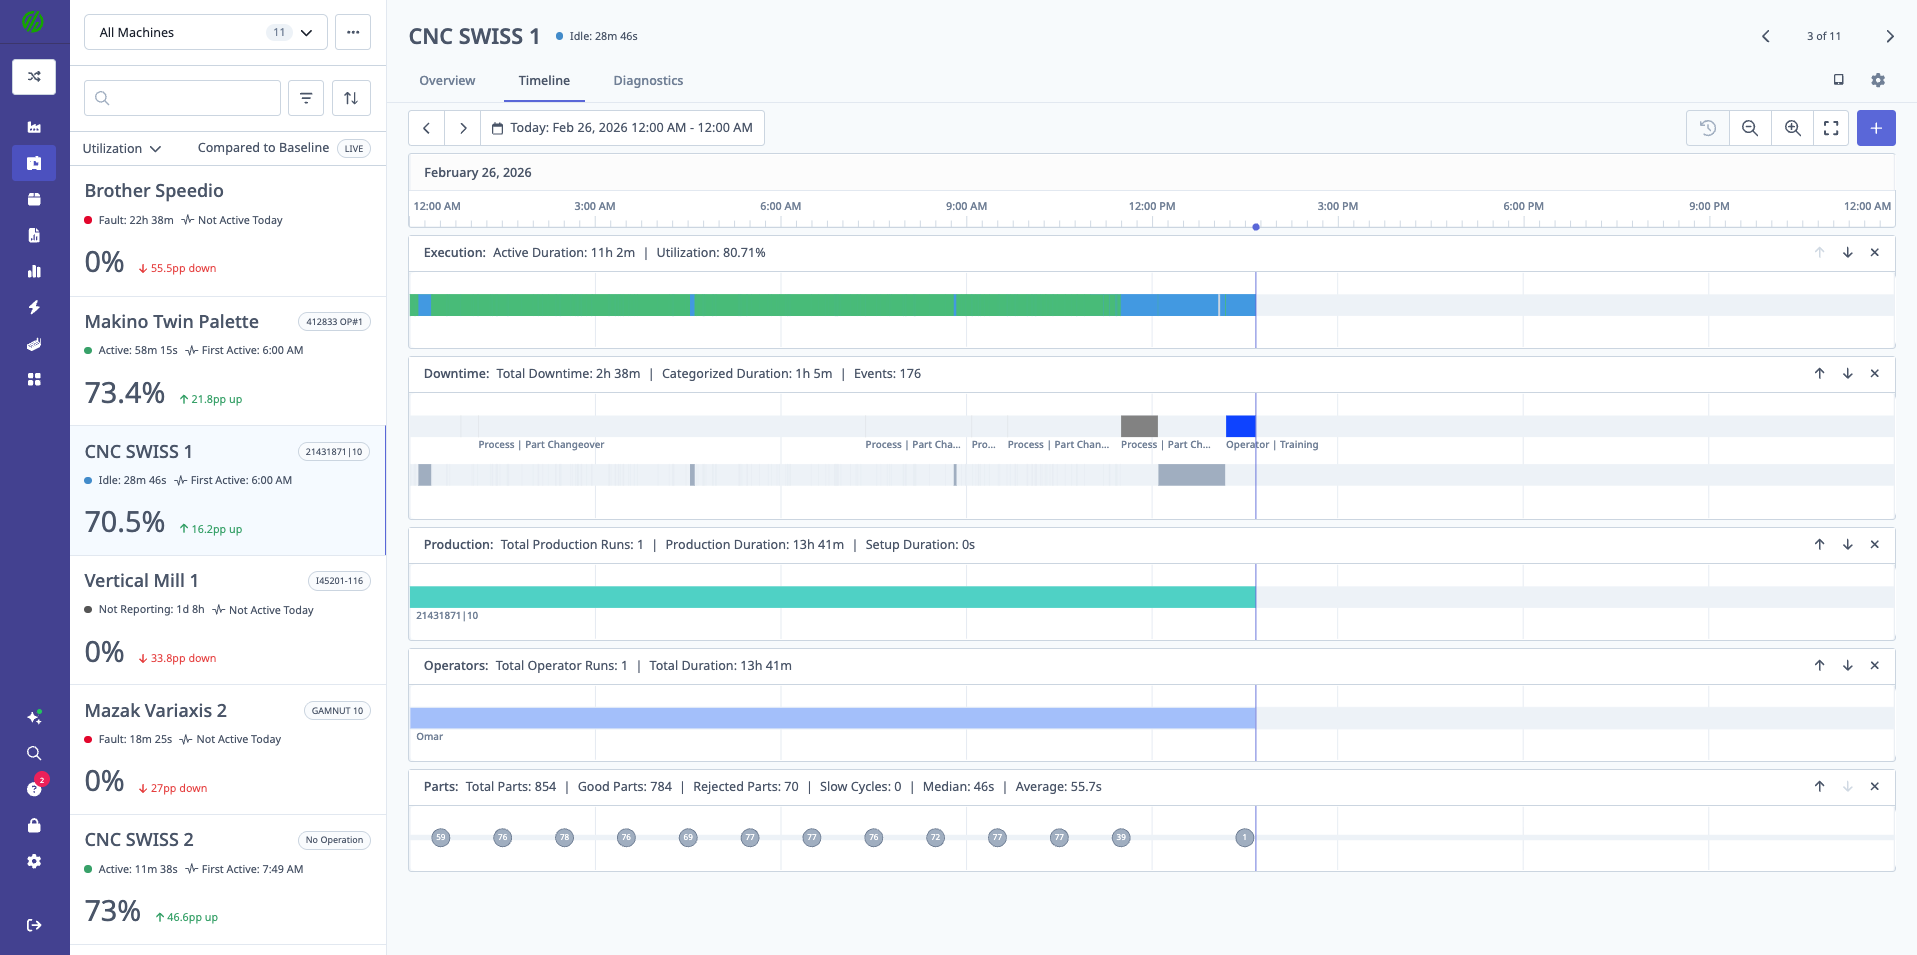
The Timeline is a visual representation of machine activity over time, showing execution status, downtime, production runs, alarms, parts, and programs in synchronized swim-lanes.
Accessing Timeline
From Machines Page:
- Select machine in switcher
- Click Timeline tab (top of machine overview)
From Other Pages:
- Company Dashboard → Click machine → Opens with Timeline tab
- Dashboards → Click machine tile → Select Timeline icon
- Reports → Click machine → Automatically opens Timeline
Timeline Layout
Swim-Lanes (top to bottom):
- Execution: Active (green) / Idle (yellow) / Disconnected (gray)
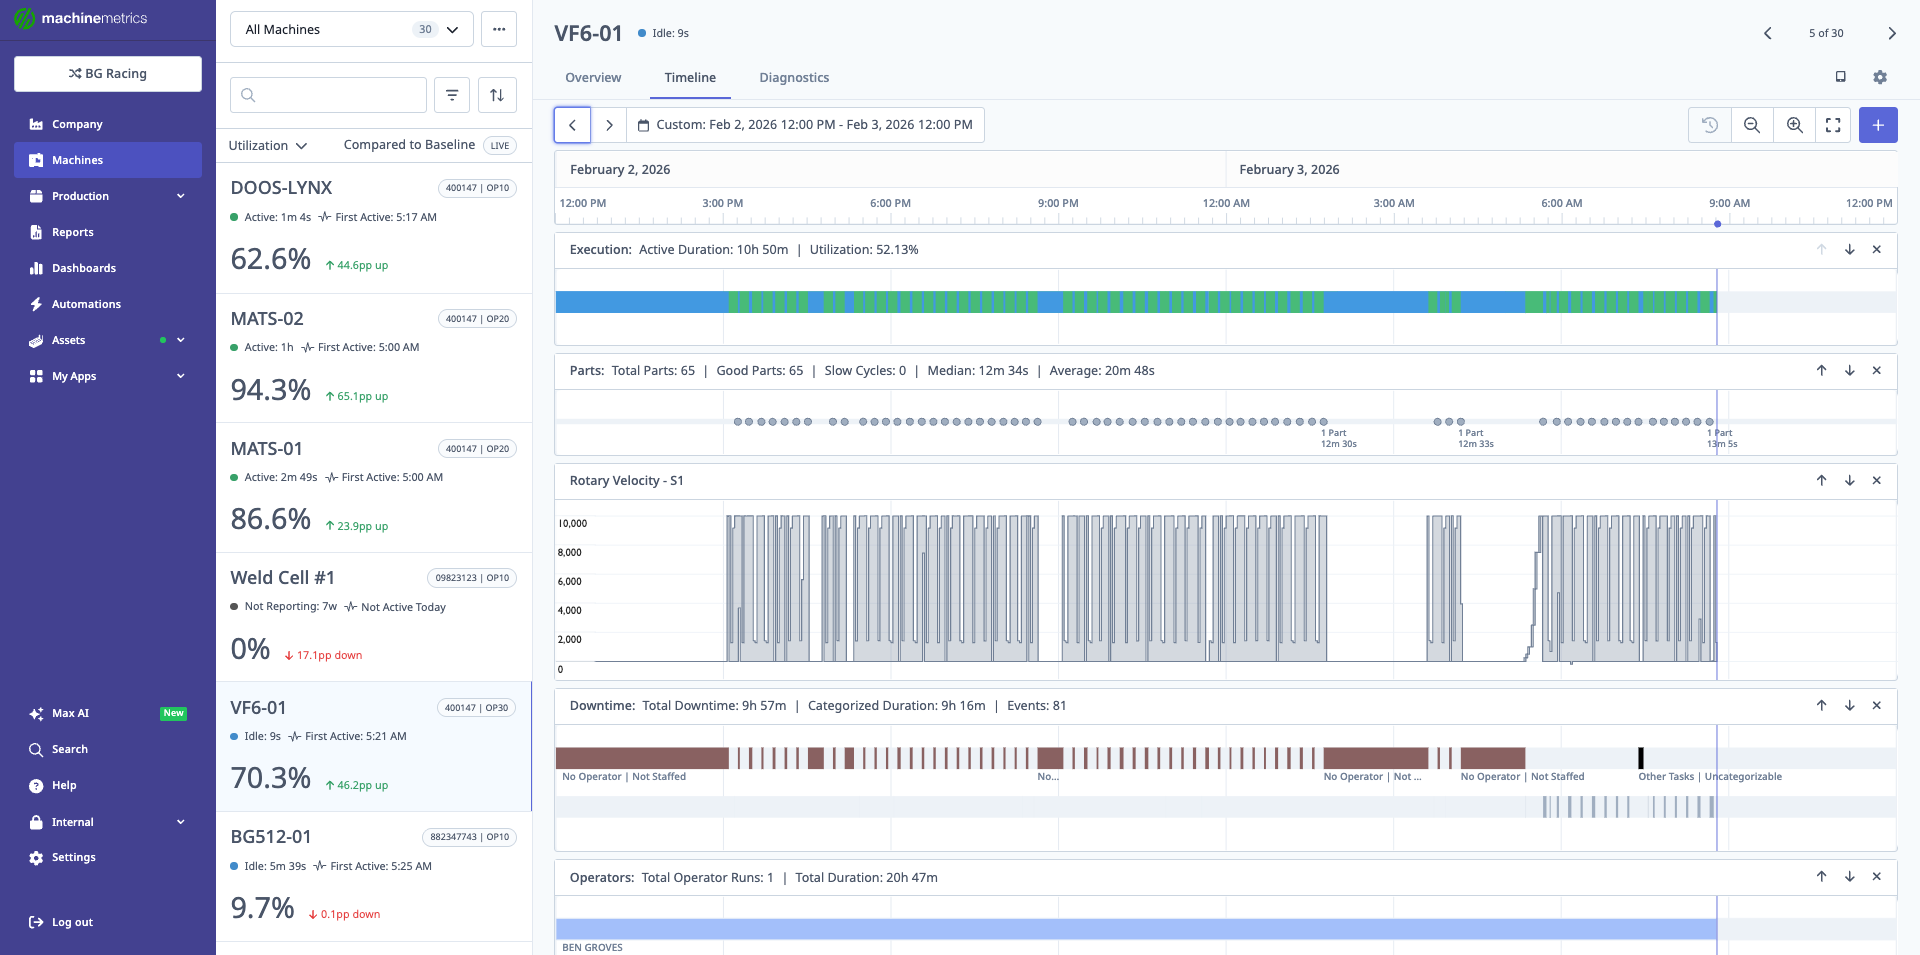
The Timeline view shows synchronized swim-lanes displaying execution status, parts produced, rotary velocity patterns, downtime events with categories, and operations. This comprehensive view helps identify correlations between events and diagnose issues. In this example, you can see execution periods (blue/green bars), part completions (dots), spindle activity (rotary velocity chart), downtime categorization, and operations timeline. 2. Downtime: Categorized and uncategorized events 3. Production: Operations/jobs running 4. Alarms: Fault codes and events 5. Parts: Individual parts produced 6. Programs: CNC programs running 7. Diagnostic Metrics: (optional, customizable)
Header Information:
- Utilization %: For visible time range
- Total Parts: Produced in visible range
- Good Parts: Quality parts
- Slow Cycles: Parts with cycle time > expected
- Median Cycle Time: Median for visible range
Timeline Controls
Date/Time Range Picker:
- Click date range at top
- Select preset (Today, Yesterday, Last 7 Days) or custom
- Max range: 7 days
- Time range appears above timeline (e.g., "Jan 15, 8:00 AM - Jan 16, 8:00 AM")
Panning Controls:
- Left Arrow: Pan backward in time (50% of current view)
- Right Arrow: Pan forward in time (50% of current view)
- Click and Drag: Click timeline background, drag left/right
Zoom Controls:
- Zoom In (+): Zoom to shorter time range
- Zoom Out (-): Zoom to longer time range
- Click and Drag: Click and drag horizontally to select zoom range
- Hover near start time
- Click and drag to end time
- Release to zoom to selected range
Example Zoom:
Current view: 8:00 AM - 4:00 PM (8 hours)
Action: Click and drag from 10:00 AM to 12:00 PM
Result: View zooms to 10:00 AM - 12:00 PM (2 hours)
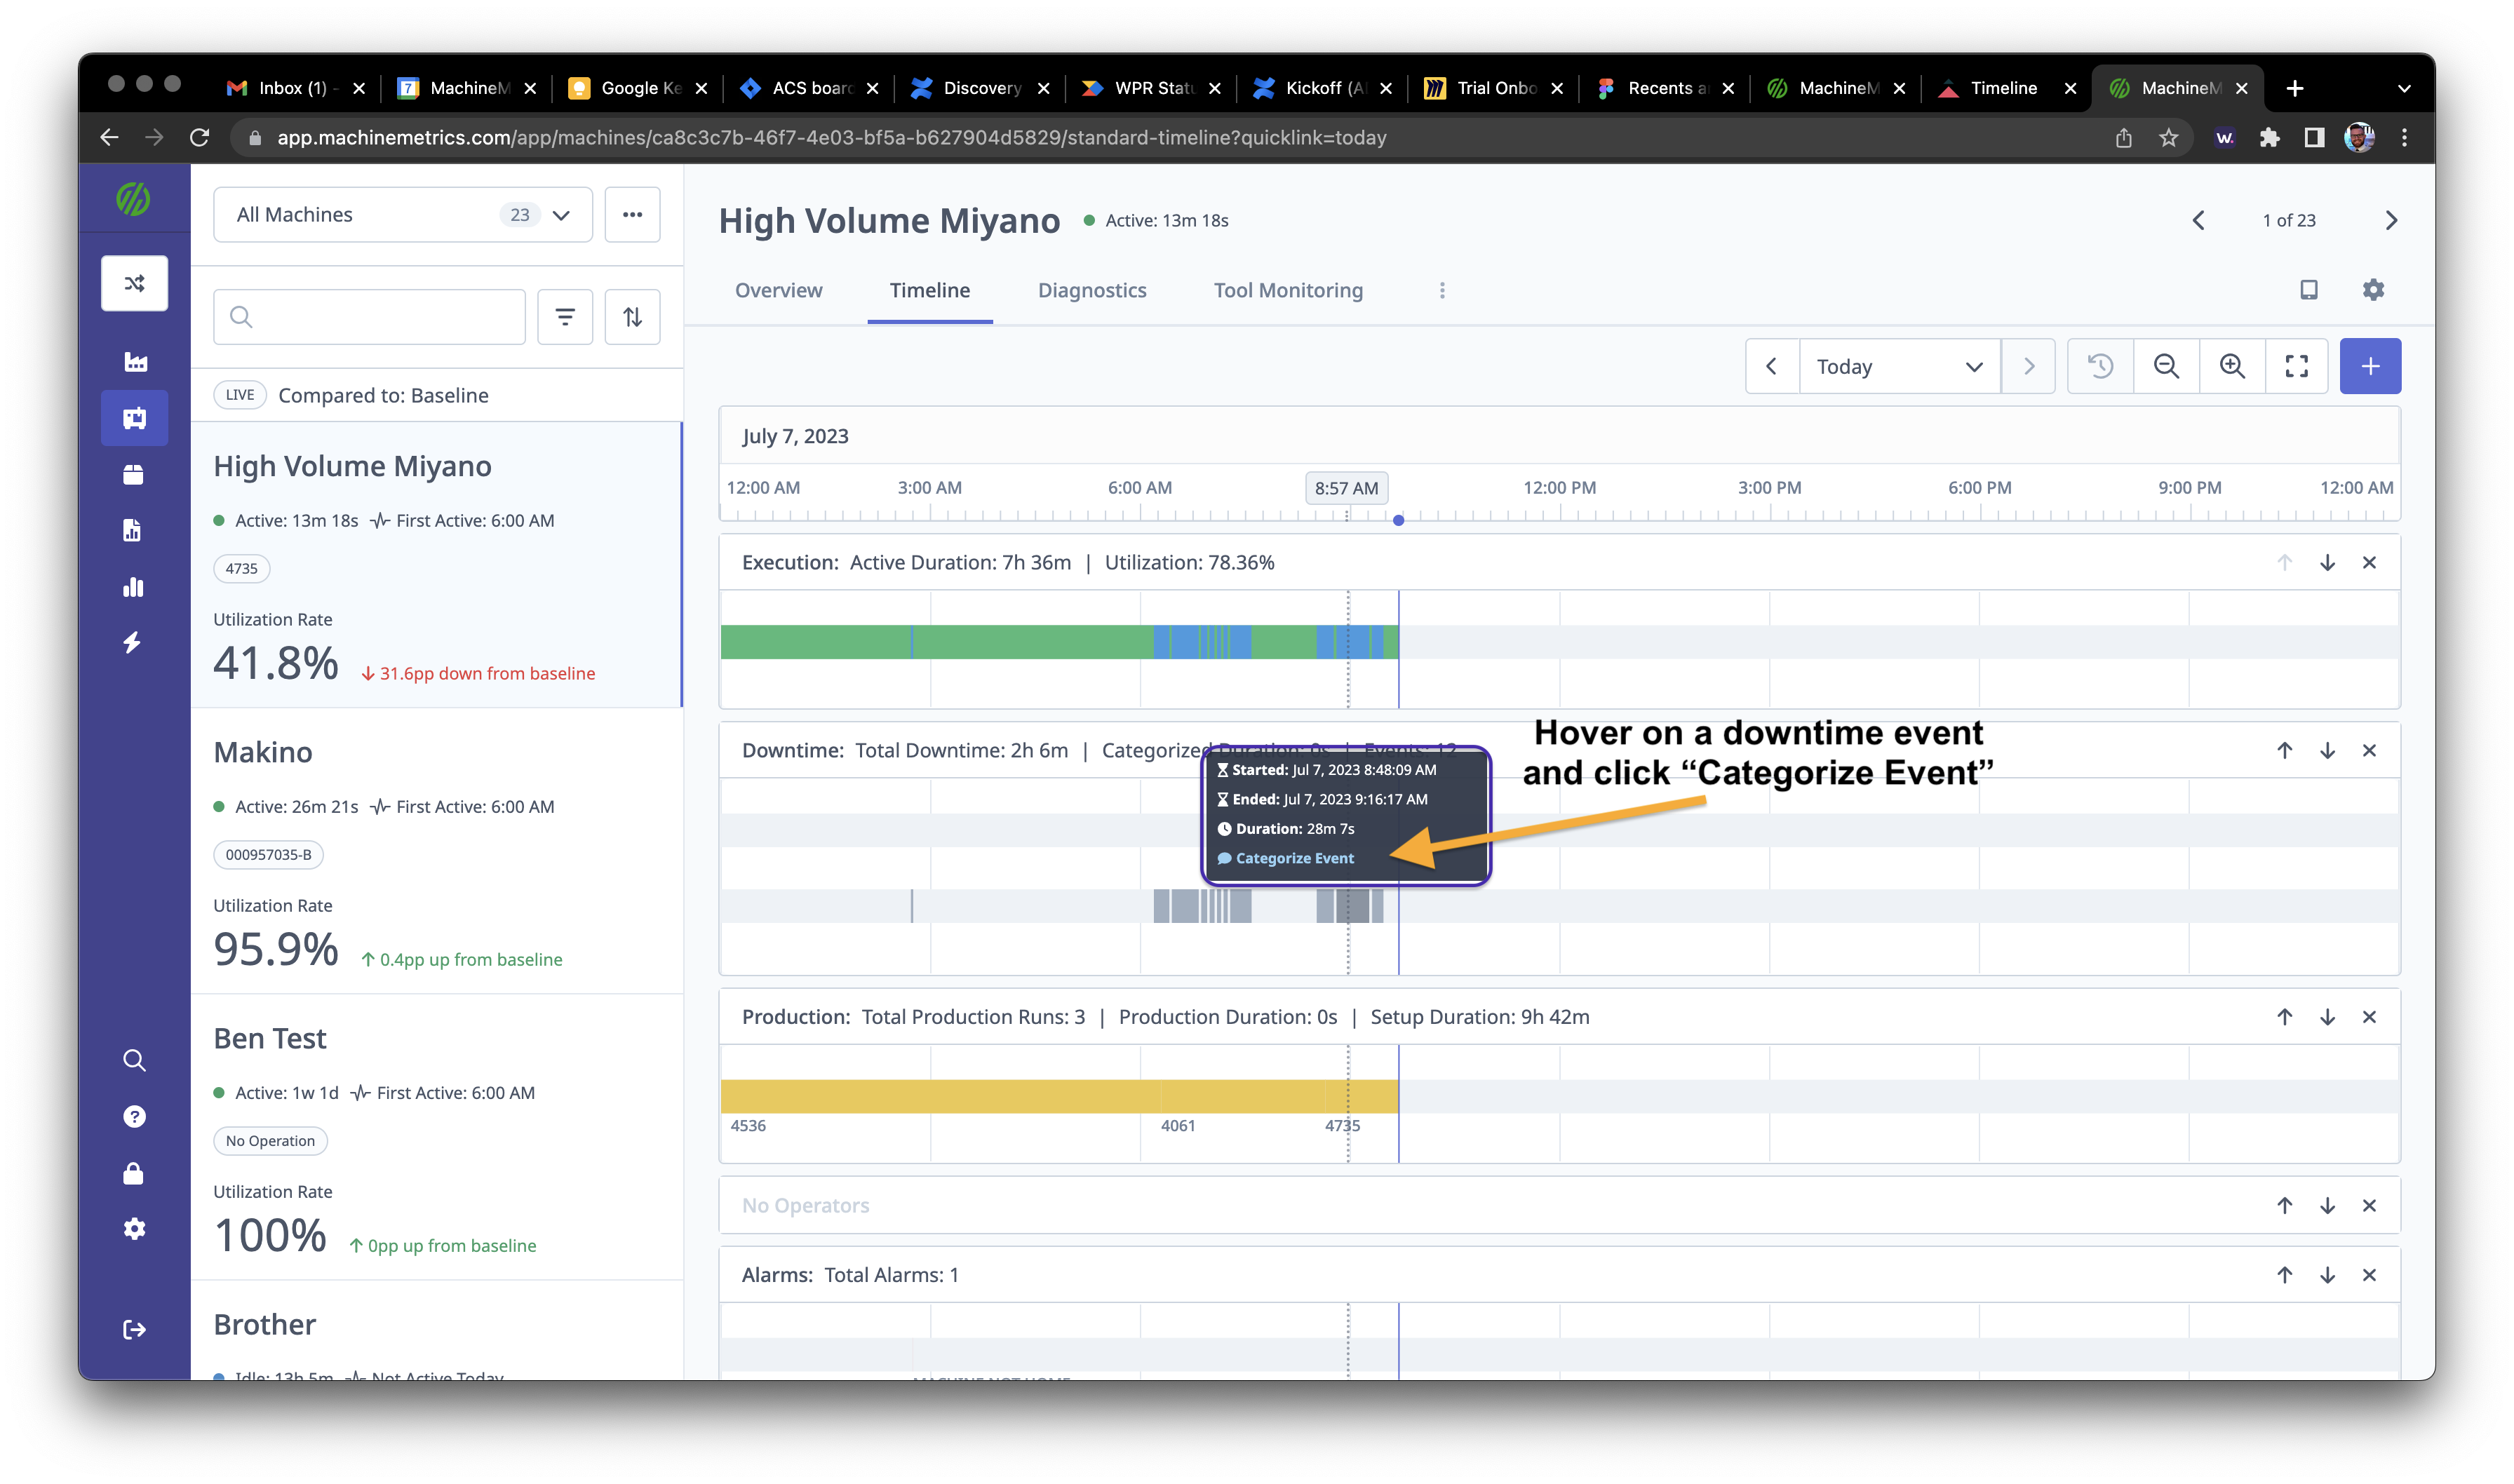
Hover Actions
Hovering on Timeline Events: Each event type displays a tooltip with details and action buttons.
Downtime Events:
- Tooltip shows:
- Duration
- Category (if assigned)
- Start/end time
- Action buttons:
- Categorize: Assign downtime reason
- Edit: Modify event details
- Split: Divide event into multiple events
- Merge: Combine with adjacent event
Production Runs:
- Tooltip shows:
- Operation name
- Duration
- Parts produced
- Operators
- Action button:
- Edit: Modify run details (operation, expected parts, etc.)
Alarm Events:
- Tooltip shows:
- Alarm code
- Alarm message
- Timestamp
- Action button:
- View Summary: Open detailed alarm information
Parts:
- Tooltip shows:
- Cycle time
- Time produced
- Operation
- Program
- No actions (informational only)
Customizing Timeline View
Adding/Removing Metrics:
- Click Add Metrics button
- Modal opens with available metrics:
- Operational (default): Execution, Downtime, Production, Alarms, Parts, Programs
- Diagnostic: Spindle load, feed rate, axis positions, etc.
- Check/uncheck metrics to add/remove
- Click Save or Discard
Reordering Rows:
- Click Up/Down arrows on right side of row header
- Row moves up/down one position
- Click Save or Discard when done
Removing Individual Rows:
- Click X on right side of row header
- Row removed immediately
- Click Discard to undo if needed
Note: Saved views apply to your user profile across all machines.
Navigating Timeline
Common Navigation Patterns:
Zoom to Specific Event:
- Locate event of interest
- Click and drag to select time range around event
- Timeline zooms to selection
Pan to Earlier/Later Time:
- Click left/right arrow repeatedly
- Or click and drag timeline background
Return to Full Day View:
- Click date picker
- Select "Today" or "Yesterday"
- Timeline resets to full day
Keyboard Shortcuts:
- Not currently supported (use mouse controls)
Diagnostics Page
Overview
The Diagnostics Page provides real-time and historical machine data from the controller, including spindle load, axis positions, feed rates, and other diagnostic values.
Accessing Diagnostics
From Machines Page:
- Select machine
- Click Diagnostics tab
Diagnostic Data Availability:
- FOCAS: Full diagnostic data available
- MTConnect: Depends on control configuration
- OPC-UA: Depends on configured tags
- I/O: Limited to configured I/O signals
Diagnostic Metrics
Common Metrics (FOCAS machines):
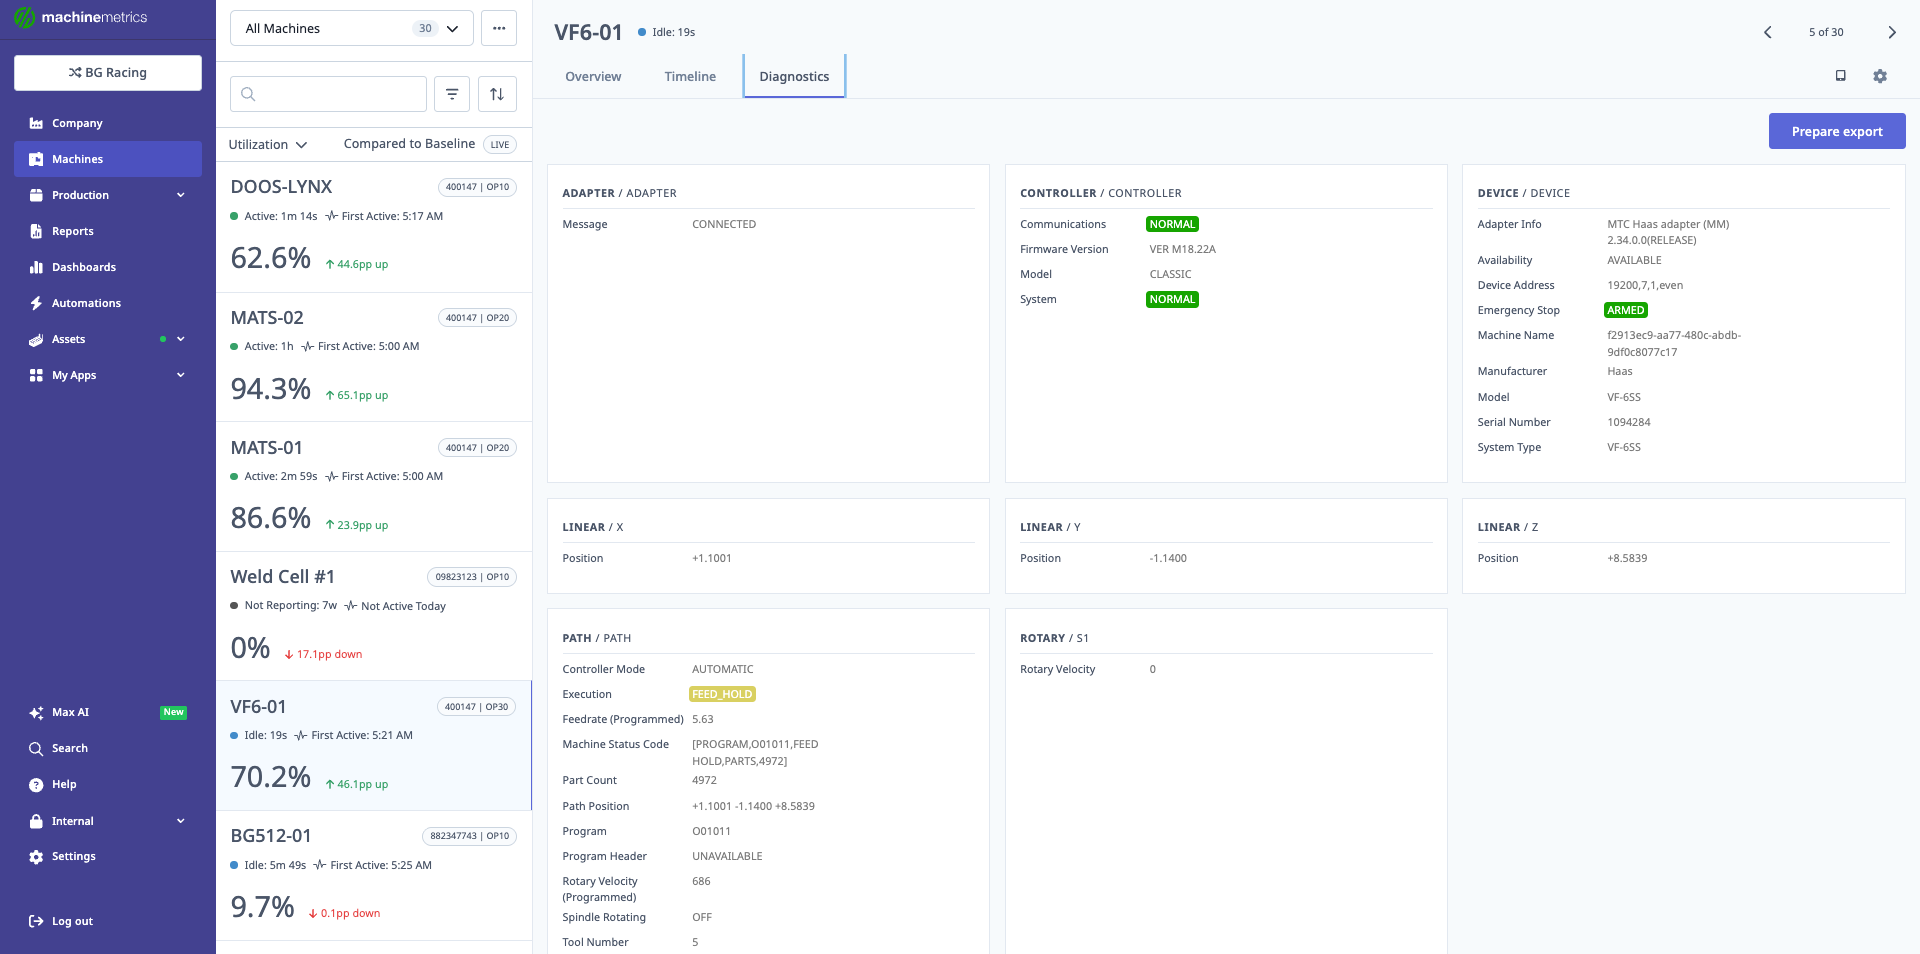
The Diagnostics tab displays comprehensive machine information including adapter/adapter details (connection status, firmware version, model, system), controller information (communications status, device address, emergency stop, machine name, manufacturer), device information (adapter info, availability, device address), and live data values like spindle speed and axis positions. This view helps troubleshoot connectivity issues and monitor real-time machine parameters.
- Spindle Load %: Current spindle load
- Spindle Speed RPM: Current spindle RPM
- Feed Rate: Current feed rate (units/min)
- X/Y/Z Axis Position: Current axis positions
- Program Number: Active program
- Tool Number: Active tool
Custom Metrics:
- Configure additional metrics in machine settings
- Add analog I/O values
- Add PLC tags (OPC-UA)
Diagnostic Charts
Chart Features:
- Real-time updating (every few seconds)
- Historical view (select date range)
- Multiple metrics on one chart
- Zoom and pan
Use Cases:
- Monitor spindle load for tool wear
- Track feed rate variations
- Verify axis movements
- Correlate diagnostic data with quality issues
Adding Machines
Prerequisites
Before adding a machine, ensure:
- Machine connectivity is configured (MTConnect, FOCAS, OPC-UA, etc.)
- Edge device is deployed and online
- Network connectivity between machine and Edge is established
- Machine IP address is known (if applicable)
Adding Protocol-Based Machines
Protocol-based machines include: MTConnect, FOCAS, OPC-UA, Modbus/TCP, MQTT, EtherNet/IP
Steps:
- Navigate to Assets → Machines, or Dashboards → Machines List
- Click Add Machine
- Enter machine details:
- Machine Name: Descriptive name (e.g., "Mill #3")
- Make: Manufacturer (Haas, Mazak, Okuma, etc.)
- Model: Machine model
- Serial Number: (optional)
- Select Data Collection Method:
- Choose appropriate protocol (FOCAS, MTConnect, etc.)
- Enter Connection Details:
- IP address
- Port number
- Adapter script (if required)
- Click Save
Verification:
- Machine appears in Machine Switcher
- Status shows "Active", "Idle", or "Off" (not "Unknown")
- Data begins appearing within 5-10 minutes
See Also:
Adding I/O-Enabled Machines
I/O machines use: Digital I/O modules (Sealevel, WISE), current transducers, sensors
Steps:
- Navigate to Assets → Machines, or Dashboards → Machines List
- Click Add Machine
- Enter machine details (name, make, model)
- Select Data Collection Method:
- Digital IO (Sealevel 170E)
- Digital IO (WISE-4050)
- Or custom adapter type
- Enter I/O Module Details:
- IP address of I/O module
- Port (typically 502 for Modbus TCP)
- Enter Adapter Script:
- Configure registers, coils, and variables
- Define data items (execution, part count, etc.)
- Click Save
See Also:
- [Digital I/O Connectivity Guide](../Machine Connectivity/digital-io-connectivity-guide.mdx)
Managing Machines
Editing Machine Details
Steps:
- Select machine in switcher
- Click Settings tab
- Click Edit Machine button
- Modify details:
- Machine name
- Make/model
- Serial number
- Location
- Machine group
- Click Save
Configuring Machine Groups
Machine Groups allow you to organize machines by department, type, or production line.
Creating Groups:
- Navigate to Settings → Company Settings → Machine Groups
- Click Add Group
- Enter group name (e.g., "CNC Mills", "Second Floor")
- Click Save
Assigning Machines to Groups:
- Navigate to machine settings
- Select Machine Group dropdown
- Choose one or more groups
- Click Save
Using Groups:
- Filter Machine Switcher by group
- Filter Company Dashboard by group
- Use in reports and dashboards
Setting First Active Time
Purpose: Define when machine's "scheduled" time begins each day for accurate utilization calculation.
Configuring:
- Navigate to machine settings
- Find First Active Time section
- Set time (e.g., 6:00 AM)
- Select days of week (Mon-Fri, or custom)
- Click Save
Impact:
- Utilization calculation uses scheduled time (first active to end of shift)
- Machines without first active time excluded from baseline comparisons
- Important for accurate "Utilization: Lower than expected" widget
Configuring Schedules and Shifts
Shifts define when machine is expected to be running.
Setting Up Shifts:
- Navigate to Settings → Shifts
- Click Add Shift
- Enter shift details:
- Shift name (e.g., "First Shift")
- Start time
- End time
- Days of week
- Click Save
Assigning Shifts to Machine:
- Navigate to machine settings
- Select Schedule tab
- Assign shifts to machine
- Configure breaks (optional)
- Click Save
Part Corrections and Rejects
Overview
Part Corrections allow you to adjust part counts when the automated count doesn't match actual production.
Use Cases:
- Add parts produced during setup/testing
- Subtract parts counted incorrectly
- Mark good parts as rejects (scrap)
- Correct count after machine reconnection
Adding Part Corrections
From Parts Tab:
- Select machine in switcher
- Click Parts tab
- Click Add Correction button
- Enter correction details:
- Operation: Select operation (or "No Operation")
- Quantity: Number of parts (positive to add, negative to subtract)
- Quality: Good, Scrap, or Non-Conforming
- Date/Time: When correction applies
- Reason: Explanation for correction
- Click Save
Result:
- Part count updates immediately
- Correction appears in parts table
- History is preserved (correction is logged)
Rejecting Parts
Mark Good Parts as Rejects:
- Parts tab → Table view
- Find parts to reject
- Select checkboxes next to parts
- Click Reject Selected button
- Select reject reason:
- Scrap (discard)
- Non-Conforming (rework candidate)
- Add notes (optional)
- Click Save
Result:
- Parts move from "Good" to "Rejected" count
- Quality metrics update (OEE, scrap rate)
- Reject reason tracked for analysis
Categorizing Downtime
Overview
Downtime Categorization assigns reasons to idle periods, enabling root cause analysis and improvement initiatives.
Why Categorize:
- Understand primary causes of downtime
- Prioritize improvement efforts
- Track effectiveness of countermeasures
- Generate accurate downtime reports
Categorization Methods
Real-Time Categorization (Operator Tablet)
Best Practice: Operators categorize downtime as it occurs using OpDash tablet.
Process:
- Machine goes idle
- Tablet prompts operator for reason
- Operator selects category
- Downtime automatically categorized
Advantages:
- Most accurate (categorized when fresh in mind)
- No backlog of uncategorized events
- Engages operators in improvement process
Bulk Categorization (Downtime Tab)
For uncategorized downtime in past:
- Select machine
- Click Downtime tab
- Review uncategorized events
- Select multiple events (checkboxes)
- Click Bulk Categorize button
- Select downtime reason
- Add notes (optional)
- Click Save
Tips:
- Filter by date range to focus on recent events
- Look for patterns (e.g., all around same time = likely same cause)
- Add notes for context
Individual Categorization (Timeline)
From Timeline:
- Click Timeline tab
- Hover over downtime event
- Click Categorize in tooltip
- Select reason
- Add notes
- Click Save
Or:
- Hover over downtime event
- Click Edit
- Change category, duration, or split/merge events
- Click Save
Downtime Categories
Common Categories:
- Setup/Changeover: Time to switch jobs/tools
- Waiting for Material: Material not available
- Waiting for Operator: Operator not at machine
- Tooling Issues: Tool breakage, adjustment
- Maintenance: Repairs, PM
- Operator Breaks: Lunch, breaks
- Quality Issues: Rework, inspection
- Uncategorized: Not yet classified
Custom Categories:
- Create custom categories in Settings → Downtime Reasons
- Build hierarchy (parent categories → subcategories)
- Example: Maintenance → Electrical → Motor Failure
Best Practices
Daily Machine Review
Morning Routine (5 min per machine):
- Check live status in Machine Switcher
- Verify all machines started on time (first active time)
- Review yesterday's utilization (set date to "Yesterday")
- Check for unusual downtime or alarms
- Address any red flags before shift starts
Weekly Performance Review
Detailed Analysis (30 min per machine/group):
- Set date range to "Last 7 Days"
- Review all metric tabs:
- Utilization: Compare to baseline
- Parts: Check good vs expected
- Downtime: Identify top reasons
- OEE: Spot declining trends
- Alarms: Note recurring issues
- Review Operations Table:
- Identify slow operations
- Check cycle time vs expected/baseline
- Review Operators Table:
- Compare operator performance
- Identify training opportunities
- Categorize any remaining uncategorized downtime
- Create action items for improvement
Timeline Investigation
When investigating issues:
- Use Timeline to correlate events
- Example: "Why did utilization drop at 2 PM?"
- Zoom to 2 PM time range
- Review Downtime row: Unplanned downtime started
- Review Alarms row: Alarm code 410 occurred
- Review Parts row: No parts produced after
- Conclusion: Alarm 410 caused downtime
- Hover on alarm for details
- Document root cause
- Create corrective action
Filter Strategies
Comparing Operators:
Day 1:
- Operator: John
- Date: Last 7 Days
- Note OEE, parts, utilization

Day 2:
- Operator: Sarah
- Keep same date range
- Compare metrics
Analyzing Specific Operation:
- Operation: Part ABC-123
- Date: Last 30 Days
- Review cycle time trends
- Check if slowing over time
- Investigate if below baseline
Getting Help
Before Contacting Support
Troubleshooting Checklist:
- Machine shows "Unknown" status → Check connectivity
- No data appearing → Verify machine was added correctly
- Part count incorrect → Review part counting configuration
- Timeline not loading → Try shorter date range
- Metrics seem wrong → Verify shift/first active time configured
Support Information to Provide
When contacting support:
- Machine name
- Issue description
- Screenshots of:
- Machine overview page
- Timeline (if relevant)
- Settings page
- Date range when issue occurred
- What you expected vs what you're seeing
Contact:
- Email: support@machinemetrics.com
- Include all information above
Next Steps:
- Explore Timeline View for deep-dive event analysis
- Learn Production & Analytics Guide for operations management
- Review Downtime & Quality Guide for classification strategies
Questions? Contact support@machinemetrics.com