Operator Dashboard
What is Operator Dashboard Settings?
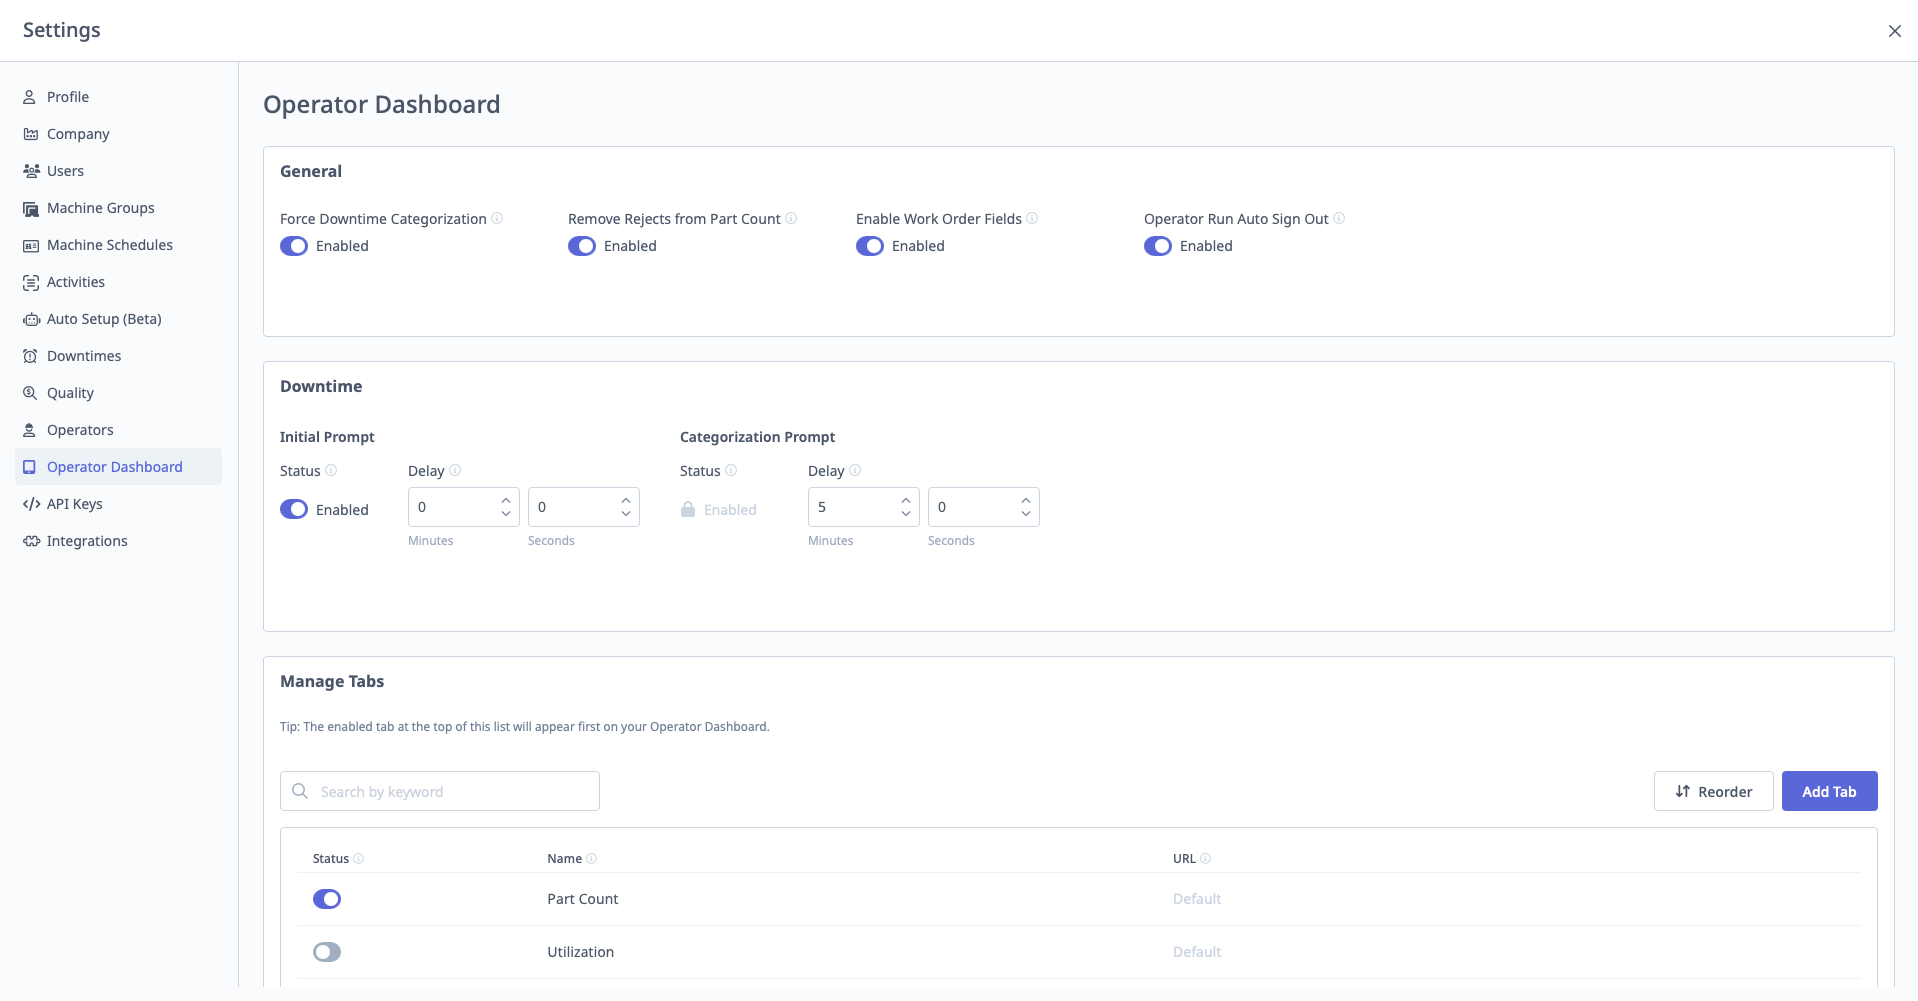
Operator Dashboard settings control the behavior and appearance of tablets on the shop floor.
Access: Settings → Operator Dashboard
Who Can Manage: Managers, Executives, IT Admins
General Settings
Access: Settings → Operator Dashboard → General
Available Toggles:
1. Enable/Disable Machine Switching
Purpose: Allow operators to switch between machines on tablet.
Options:
- Enabled: Operators can select different machine from dropdown
- Disabled: Tablet locked to one machine
Use Case: Disable if tablets are dedicated to specific machines (prevents confusion).
2. Force Machine Downtime Categorization
Purpose: Require operators to categorize downtime before proceeding.
Options:
- Enabled: Pop-up blocks tablet until downtime categorized
- Disabled: Pop-up can be dismissed (categorize later)
Use Case: Enable to ensure all downtime is categorized. Disable if operators frequently busy and need flexibility.
3. Remove Rejects from Part Count
Purpose: Subtract rejected parts from total part count display.
Options:
- Enabled: Part count shows only good parts
- Disabled: Part count shows total parts (good + rejected)
Use Case: Enable if you only want to display good parts to operators.
4. Enable Work Order Fields
Purpose: Allow operators to enter work order numbers on tablets.
Options:
- Enabled: Operators can add/edit work orders
- Disabled: No work order functionality
Use Case: Enable if integrating with ERP or tracking work orders.
On accounts running ERP-driven job tracking, the Enable Work Order Fields toggle may appear grayed out with a no-entry cursor on hover. This is expected behavior — it is not a permissions issue. When work orders are sourced from a connected ERP, this setting is governed by the ERP onboarding configuration and is not editable by any customer admin, including an IT Admin.
If you need this behavior changed on an ERP-integrated account, contact your Solution Delivery Manager (SDM) or MachineMetrics Support — the toggle cannot be unlocked from within the application.
See Also: Operator Dashboard Guide
5. Enable Operator Auto Sign Out at End of Shift
Purpose: Automatically log operators out when shift ends.
Options:
- Enabled: Operators logged out at shift end time (based on schedule)
- Disabled: Operators must manually log out
Use Case: Enable to ensure clean shift transitions.
Auto Downtime Settings
Access: Settings → Operator Dashboard → General
Two Timing Settings:
1. Initial Prompt Delay
Purpose: How long after downtime begins before toast notification appears.
Configuration:
- Enter delay in seconds (e.g., 10)
- Default: 10 seconds
Impact:
- Downtime begins at 2:00 PM
- Toast appears at 2:00:10 PM (after 10-second delay)
Use Case: Short delay filters out very brief stops (machine stops, immediately resumes).
2. Categorization Prompt Delay
Purpose: How long before full categorization prompt replaces toast.
Configuration:
- Enter delay in seconds (e.g., 30)
- Default: 30 seconds
Impact:
- Downtime begins at 2:00 PM
- Toast appears at 2:00:10 PM
- Full prompt appears at 2:00:30 PM (if not categorized via toast)
Toast vs. Full Prompt:
- Toast: Small notification in bottom right (can dismiss)
- Full Prompt: Larger prompt (blocks tablet if "Force Categorization" enabled)
Manage Tabs
Access: Settings → Operator Dashboard → Manage Tabs
Purpose: Customize which tabs appear on Operator Dashboard tablets.
Default Tabs:
- Part Count
- Utilization
- All Downtime
- Active Alarms
- Parts Goal
- Current Cycle Time
- OEE
Managing Tabs:
Toggle Tabs On/Off:
- Navigate to Settings → Operator Dashboard → Manage Tabs
- Toggle each tab On or Off
- Click "Save"
Reorder Tabs:
- Drag and drop tabs to reorder
- Order on settings page = order on tablets
Adding Custom Tabs
Purpose: Embed external content (websites, documents, videos) on tablets.
Step-by-Step:
- Navigate to Settings → Operator Dashboard → Manage Tabs
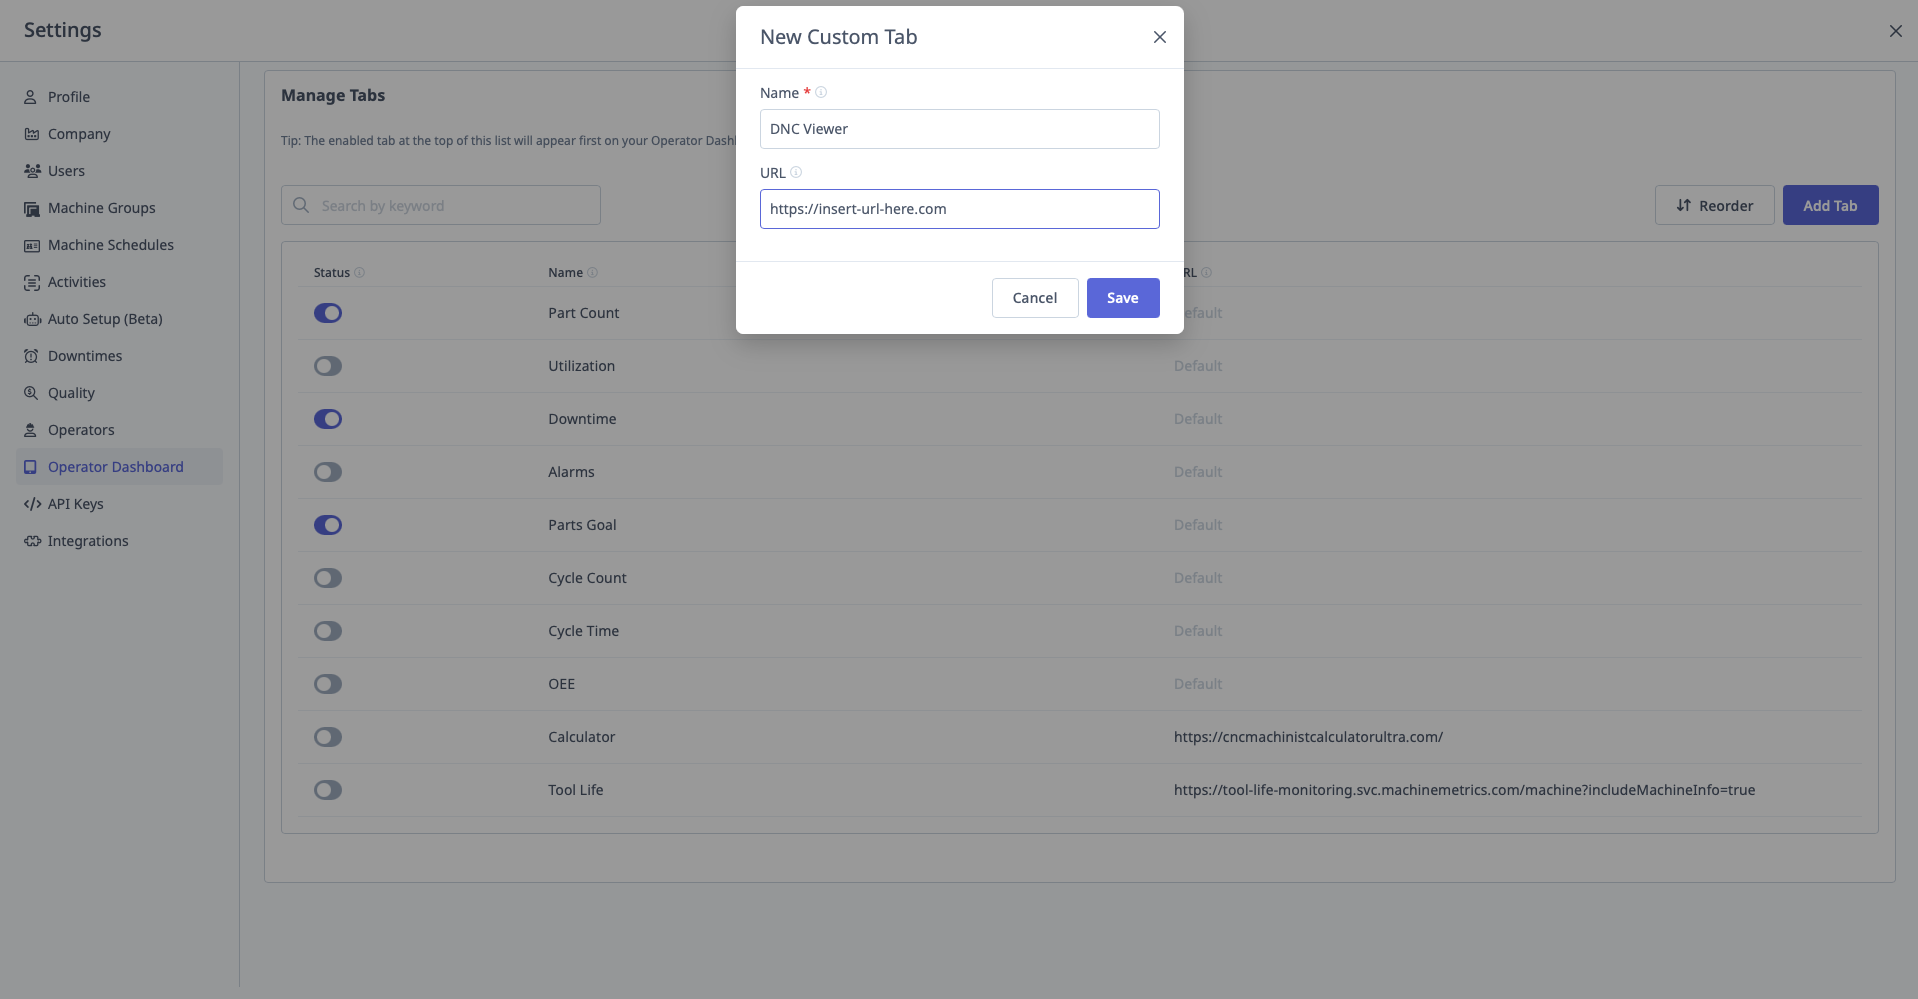
- Click "Add Tab"
- Configure:
- Tab Name: Display name (e.g., "Work Instructions")
- URL: Full URL to content
- Icon (optional): Select icon for tab
- Click "Save"
Supported Content:
- Google Forms (checklists, surveys)
- Google Drive documents (PDFs, Docs)
- Websites (CNC calculators, reference tools)
- YouTube/Vimeo videos (embedded)
- Tool Life Monitoring Dashboard
- Any iframe-compatible content
Example: Adding Tool Life Monitoring Tab
One of the most popular custom tabs is the Tool Life Monitoring Dashboard, which allows operators to see tool life status directly on their tablet without leaving the Operator Dashboard.
Step-by-Step to Add Tool Life Tab:
- Navigate to Settings → Operator Dashboard → Manage Tabs
- Click "Add Tab"
- Enter the following:
- Tab Name:
Tool Life - URL: Your Tool Life dashboard URL (format:
https://app.machinemetrics.com/dashboards/[dashboard-id]) - Icon: Select the wrench or tool icon
- Tab Name:
- Click "Save"
How to Get Your Tool Life Dashboard URL:
- Go to Dashboards → Find your Tool Life dashboard
- Open the dashboard
- Copy the URL from your browser's address bar
- Use this URL when creating the custom tab
What Operators See:
Once configured, operators can tap the Tool Life tab on their tablet to see:
| Information | Description |
|---|---|
| Tool List | All tools for their machine |
| Life Remaining | Percentage or count remaining for each tool |
| Status Colors | Green (OK), Yellow (Warning), Red (Critical) |
| Time/Cycles Left | Estimated remaining usage |
Benefits for Operators:
- No navigation required — Tool life visible without leaving the Operator Dashboard
- Proactive tool changes — See when tools are approaching end of life
- Reduce scrap — Change tools before they fail and damage parts
- Stay informed — Quick glance during production without interruption
Tip: Position the Tool Life tab near the beginning of the tab order so operators can access it quickly.
Other Example Use Cases:
Custom Tab: "Setup Instructions"
URL: https://docs.google.com/document/d/abc123

Custom Tab: "Feeds & Speeds Calculator"
URL: https://www.cnccookbook.com/feeds-speeds-calculator/

Custom Tab: "Quality Checklist"
URL: https://docs.google.com/forms/d/xyz789
Limitations:
- Sites that block iframes won't work
- Authentication may be required (e.g., Google account login)
See Also: Operator Dashboard Guide, Dashboards Guide, and Tool Life Monitoring Guide