Downtimes
What is Downtimes?
Downtimes is where you configure downtime categories (reasons) and general downtime settings.
Access: Settings → Downtimes
Who Can Manage: Managers, Executives, IT Admins
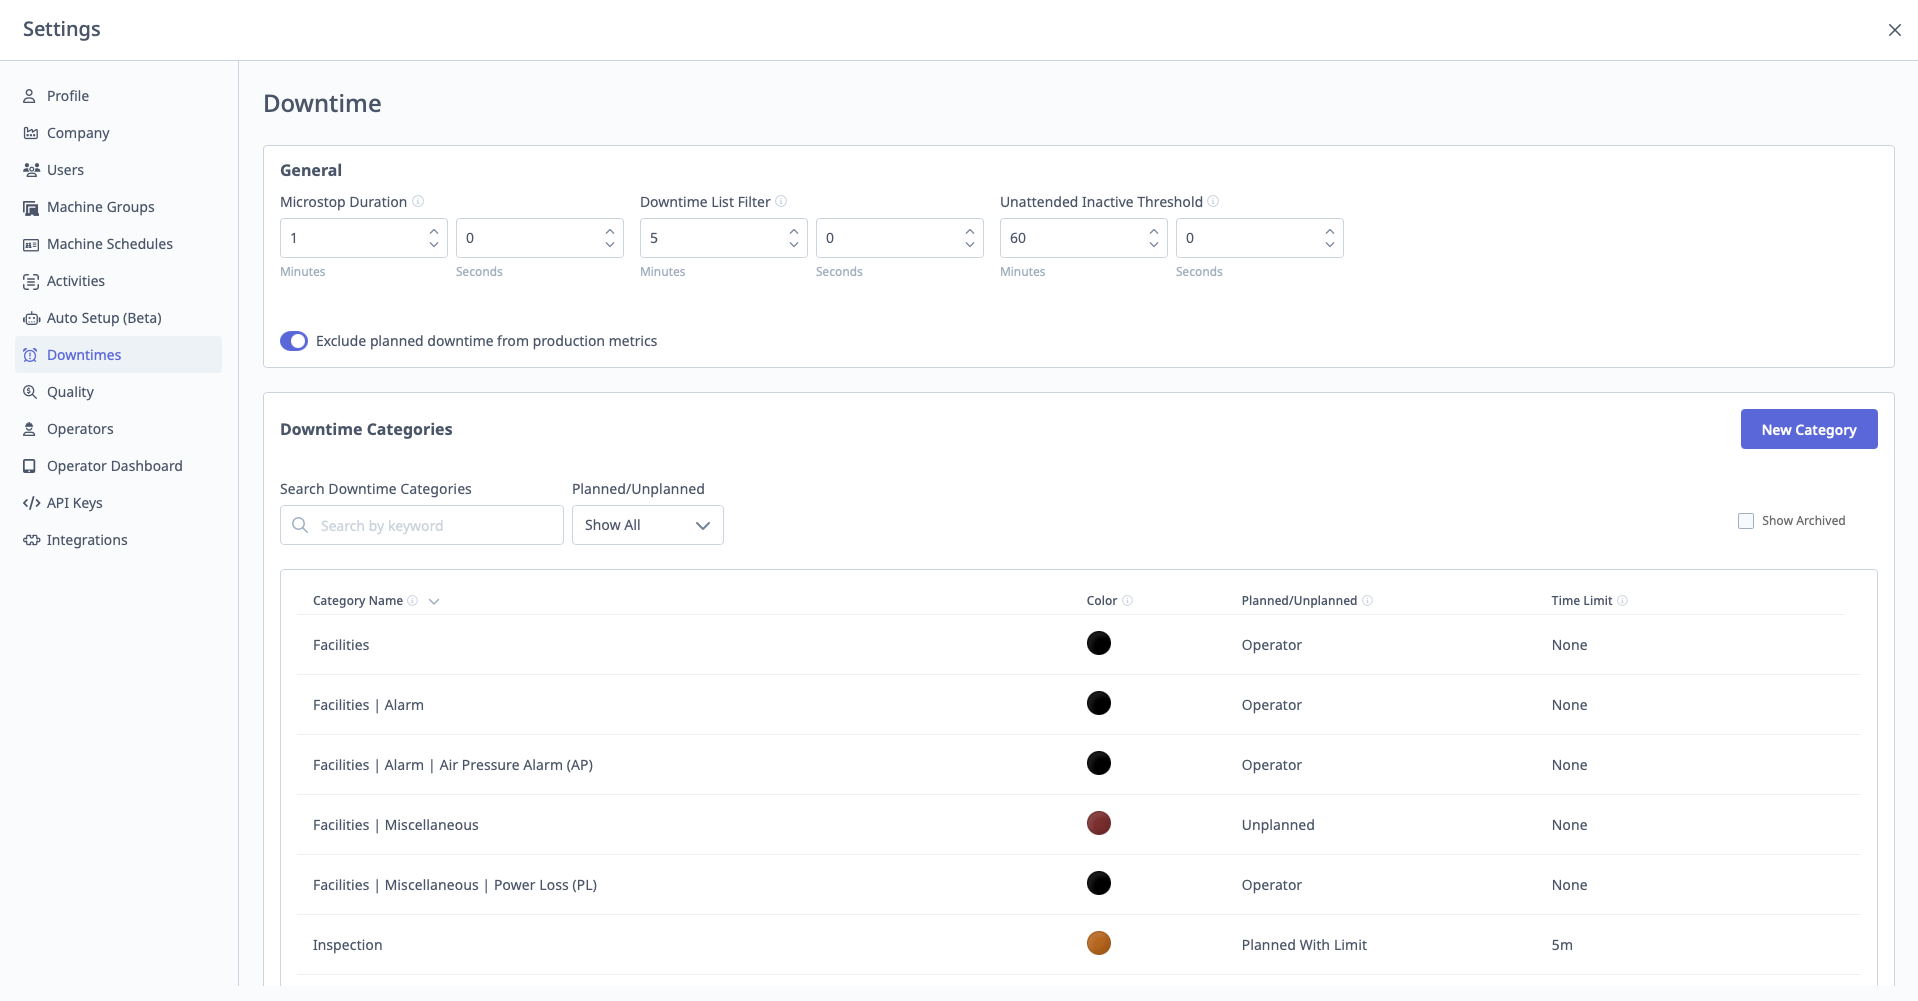
General Downtime Settings
Access: Settings → Downtimes → General
Key Settings:
1. Microstop Duration (seconds)
Purpose: Threshold separating microstops from long downtime.
Configuration:
- Enter duration in seconds (e.g., 60)
- Default: 60 seconds
Impact:
- Downtime < threshold: Categorized as "Microstop"
- Downtime ≥ threshold: Categorized as "Long Downtime"
Reporting:
- Microstops typically excluded from downtime reports
- Long downtime requires categorization
2. Downtime List Filter (seconds)
Purpose: Hide very short downtime events from operator categorization list.
Configuration:
- Enter duration in seconds (e.g., 30)
- Default: 30 seconds
Impact:
- Downtime < filter: Hidden from operator's categorization list on tablet
- Prevents operators from being prompted to categorize very short stops
Example:
Downtime List Filter: 30 seconds

5-second stop: Hidden (not prompted)
45-second stop: Shown (operator can categorize)
3. Unattended Inactive Threshold (minutes)
Purpose: For unattended shifts, determines when idle time becomes unscheduled.
Configuration:
- Enter duration in minutes (e.g., 30)
- Default: 30 minutes
Impact:
- During unattended shifts, if machine idle > threshold:
- Time becomes unscheduled (doesn't affect Availability)
- If machine idle < threshold:
- Time remains scheduled (affects Availability)
See Also: Machine Schedules and Understanding Your Data Guide
4. Exclude Planned Downtime from Production Metrics
Purpose: Exclude planned downtime (breaks, PM, etc.) from Availability and Performance calculations.
Configuration: Toggle on/off
Impact When Enabled:
- Planned downtime subtracted from scheduled time
- Does not hurt Availability or Performance
- Still included in Quality calculation
Impact When Disabled:
- All downtime (planned and unplanned) affects Availability equally
Example:
Scheduled Time: 8 hours (480 minutes)
Planned Break: 30 minutes
Planned Maintenance: 60 minutes

If Enabled:
Scheduled Time = 480 - 30 - 60 = 390 minutes

If Disabled:
Scheduled Time = 480 minutes (breaks/PM hurt Availability)
Downtime Categories
Access: Settings → Downtimes → Downtime Categories
Purpose: Define reasons for downtime that operators select on tablets.
See Also: Downtime & Quality Guide for comprehensive guide
Creating Downtime Categories
Step-by-Step:
- Navigate to Settings → Downtimes → Downtime Categories
- Click "Add Category"
- Enter Category Name
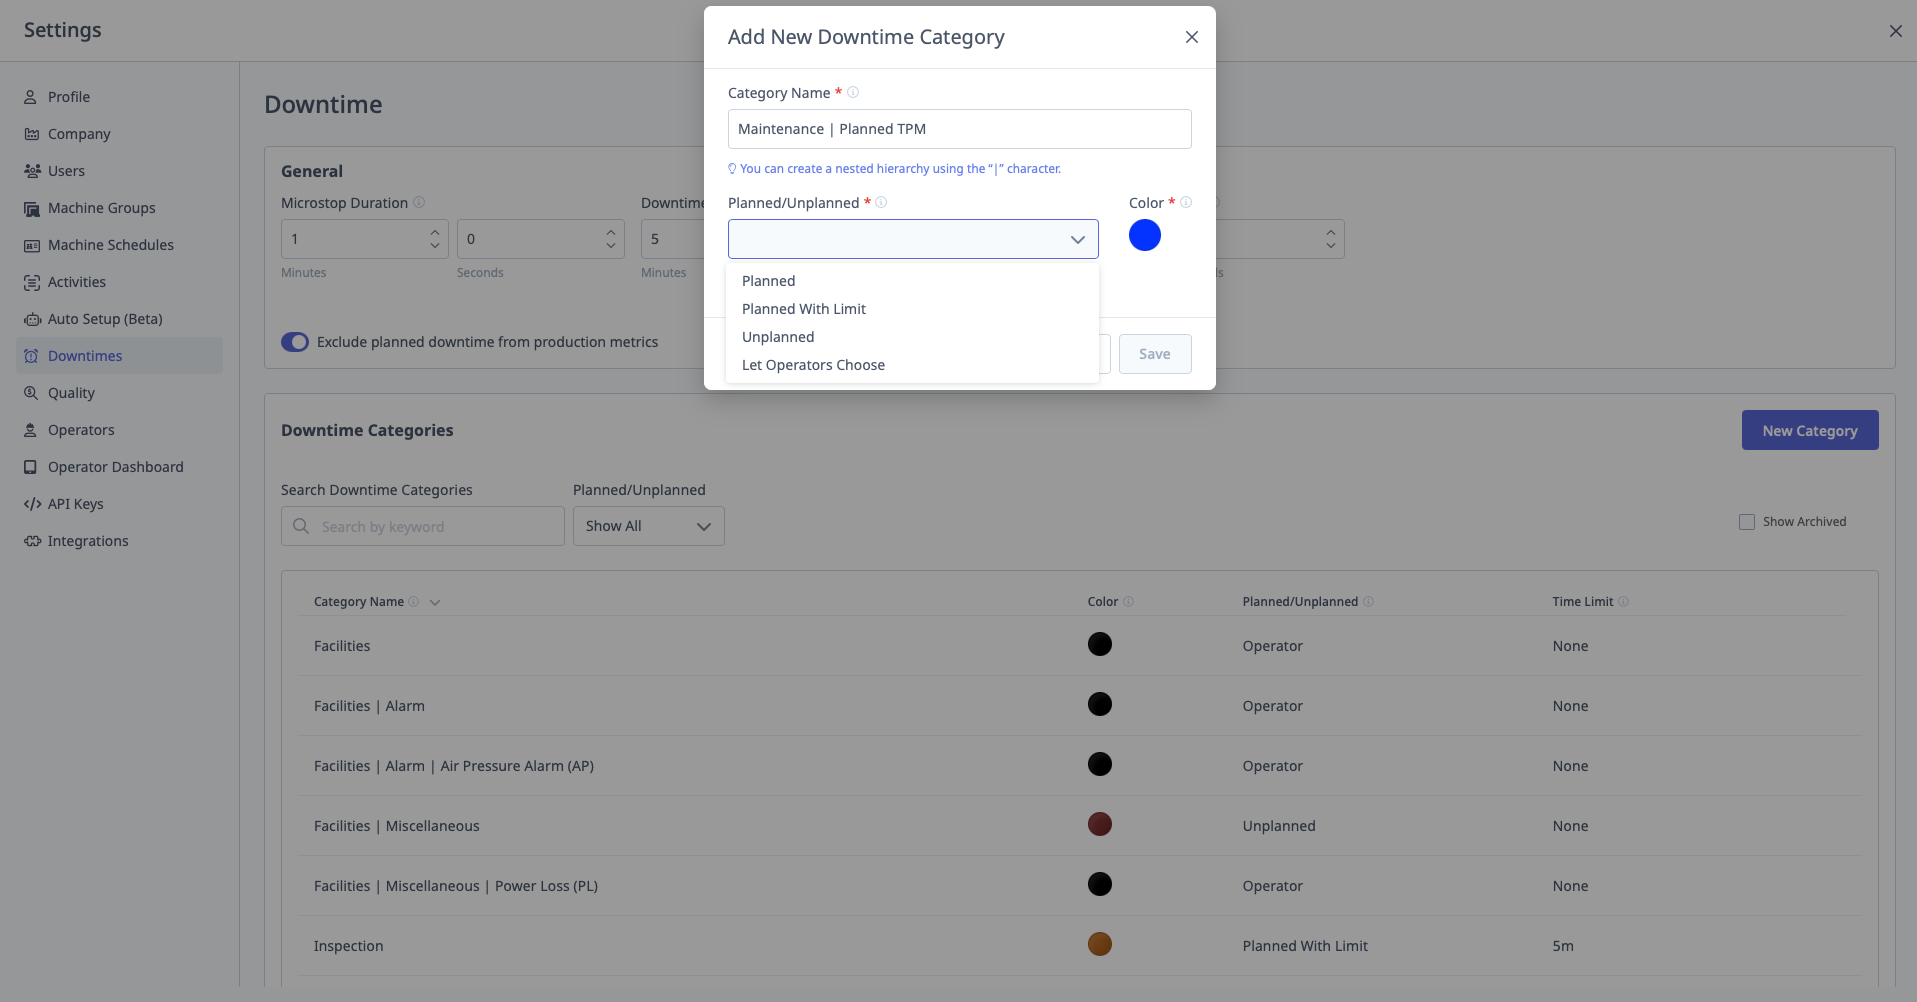
- Select Planned/Unplanned Behavior:
- Planned or Unplanned: Operator chooses
- Unplanned: Always unplanned
- Planned: Always planned
- Planned with Limit: Planned up to X minutes, then unplanned
- Select Color (for visual identification)
- Click "Save"
Creating Hierarchical Categories
Purpose: Nest categories for more specific root cause tracking.
Format: Use pipe (|) separator
Example:
Parent Category: Tooling
Child Category: Tooling | Tool Change
Grandchild Category: Tooling | Tool Change | End of Life
Steps:
- Create parent first:
Tooling - Create child:
Tooling | Tool Change(note the space before and after|) - Create grandchild:
Tooling | Tool Change | End of Life
Important: You must create each level separately.
In Settings, there is an example showing the correct format with the vertical space bar character (|).
Planned with Limit
Purpose: Mark downtime as planned up to a certain duration, then unplanned if it exceeds.
Example:
Category: Operator Break
Behavior: Planned with Limit
Limit: 15 minutes

Scenario:
Break duration: 10 minutes → Planned (OK)
Break duration: 20 minutes → 15 min planned, 5 min unplanned (excess)
Use Case: Allow reasonable breaks without affecting OEE, but flag excessive breaks.
Colors
Purpose: Visual identification on tablets, timelines, and reports.
Best Practice:
- Use consistent colors for related categories
- Example: All "Maintenance" categories = orange, all "Material" categories = blue
Operator View: Colors appear on:
- Operator Dashboard (tablet)
- Timeline visualization
- Downtime reports
Assigning Categories to Machine Groups
When creating/editing Machine Groups:
- Select which downtime categories apply to that group
- Only selected categories appear on tablets for machines in that group
Example:
Group: CNC Mills
Categories: Tool Change, Setup, Material Unavailable, Maintenance

Group: Manual Welding
Categories: Waiting for Welder, Material Unavailable, Electrode Change

Operators on CNC Mills only see the 4 categories relevant to mills.