Edge Management
What is Edge Management?
Edge Management provides centralized monitoring and administration of all edge devices in your MachineMetrics deployment. Edge devices are the on-premise gateways that connect machines to the MachineMetrics Cloud.
Access: Assets → Edge Devices → Edge Management
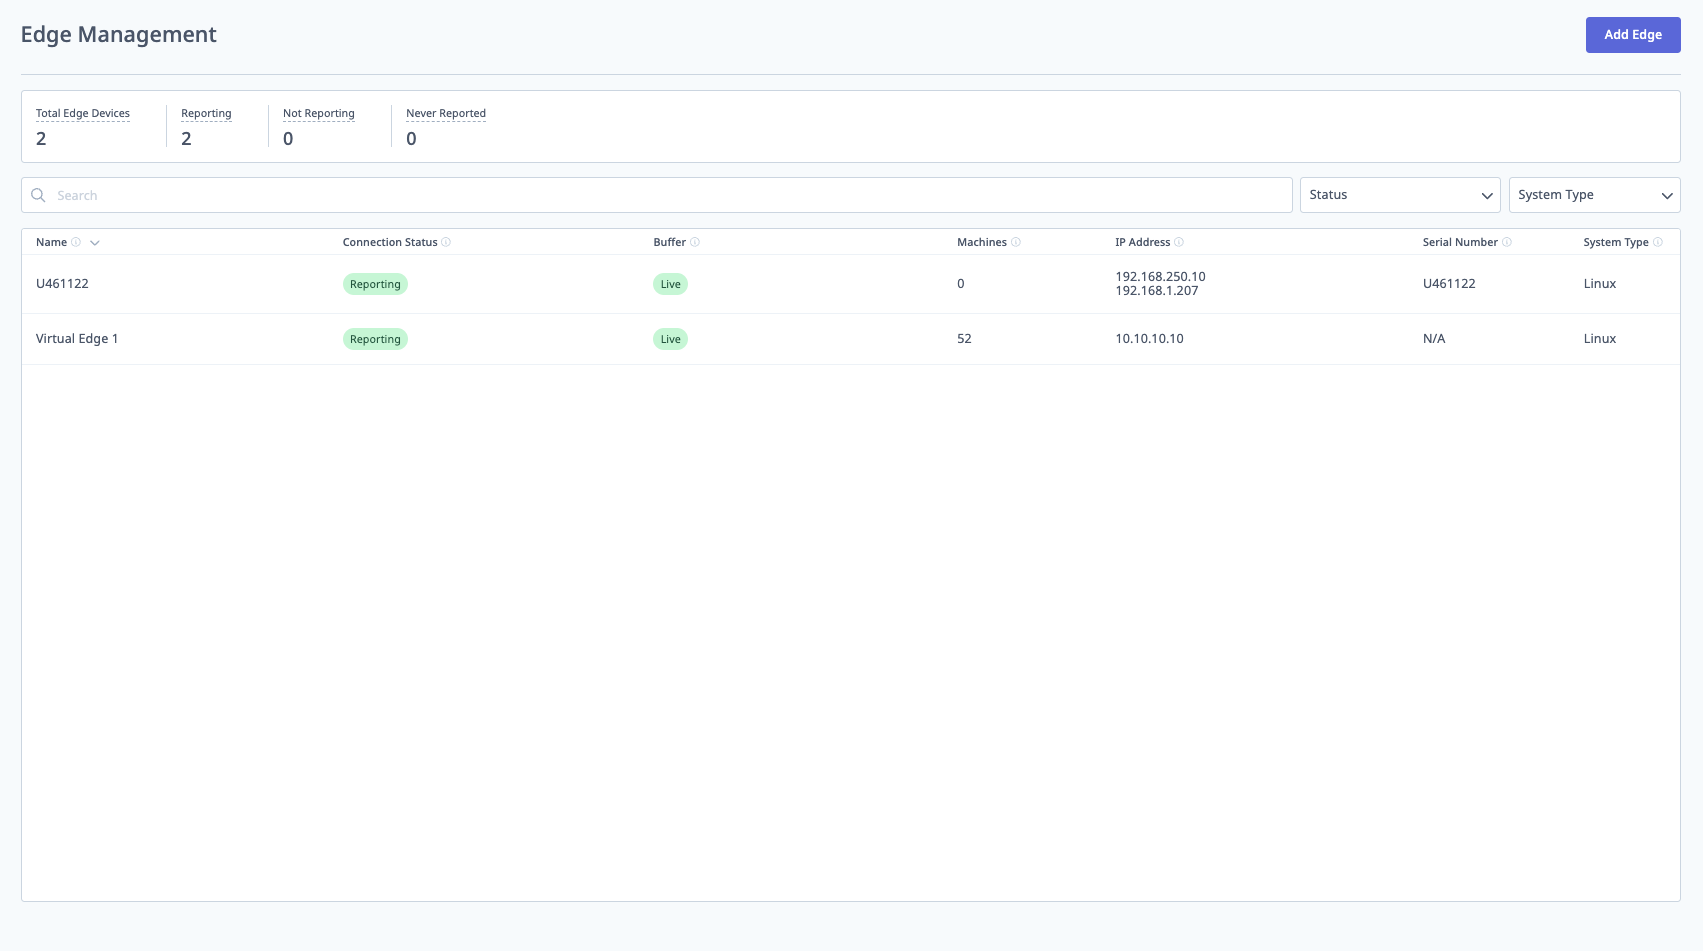
The Edge Management page displays all edge devices with their key metrics: connection status (green "Reporting" indicator), buffer status (showing data queue health), number of machines connected to each edge, IP addresses, serial numbers, and system type (Linux). The summary at the top shows total edge devices (2), reporting status (2), not reporting (0), and never reported (0). This centralized view allows administrators to monitor edge device health and connectivity across the entire deployment.
Edge Management shows live status only. It does not provide logs or allow review of past time windows. To investigate something that already happened, contact MachineMetrics Support.
Key Metrics Displayed
Connection Status:
- Reporting (Green): Edge is actively connected and sending data
- Not Reporting (Red): Edge has stopped reporting (connectivity issue)
- Never Reported (Gray): Edge has been added but never connected
Buffer:
- Live: Data is flowing normally, no backlog
- Number (e.g., 52): Number of data points queued (indicates network or processing delay)
- High buffer numbers may indicate connectivity issues or high data volume
Machines:
- Total number of machines configured on each edge device
- Click the number to see which machines are connected to that edge
IP Address:
- Network IP address(es) of the edge device
- Multiple IPs indicate multiple network interfaces (machine network + internet)
Serial Number:
- Unique identifier for physical edge devices
- Virtual edges may show "N/A"
System Type:
- Operating system running on the edge (typically Linux)
Edge Management Actions
Adding New Edge Devices:
- Click Add Edge button (top right)
- Follow the edge device setup wizard
- See Edge Device Setup Guide for detailed instructions
Viewing Edge Details:
- Click on edge device name
- View detailed metrics:
- Machine assignments
- Network configuration
- Version information
- Health status
Troubleshooting Edge Issues:
If an edge shows Not Reporting:
- Check physical connectivity (cables, power)
- Verify network access (internet connection)
- Check firewall rules (see Network Requirements)
- If the Edge is still not reporting, contact MachineMetrics Support — device logs are not available in the app and must be pulled by support
If Buffer is high:
- Check internet bandwidth
- Verify no network throttling
- Check if data collection rate is too high
- Contact support if buffer doesn't clear
Best Practices
Naming Edge Devices:
- Use descriptive names indicating location or purpose
- Examples: "Shop-Floor-Building-A", "Virtual-Edge-1", "Mill-Department-Edge"
Monitoring:
- Regularly check Edge Management page for connectivity issues
- Set up alerts for edge device failures (via Automations & Workflows)
Network Configuration:
- Ensure edge has reliable internet connection
- Use wired Ethernet (not WiFi) for production environments
- Assign static or reserved DHCP IP addresses
Capacity Planning:
- Physical edges can typically handle 50-100 machines
- Virtual edges depend on host resources
- Monitor buffer levels to identify capacity issues