Company Settings
What is Company Settings?
Company Settings contains system-wide defaults and preferences that apply to all users.
Access: Settings → Company
Who Can Edit: Managers, Executives, IT Admins
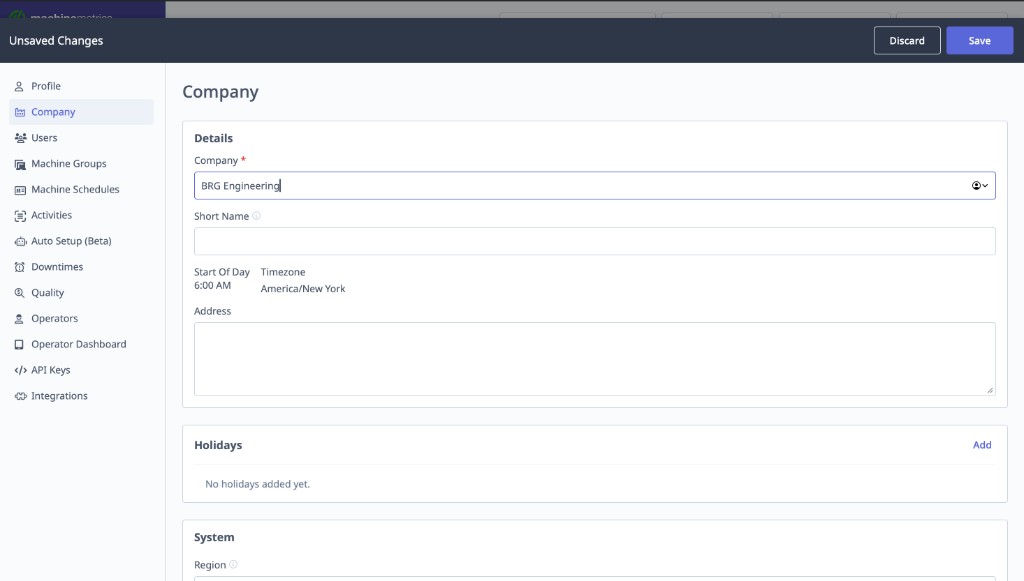
Start of Day and Timezone
Access: Settings → Company → Details
Start of day is the time your facility’s working day begins. This is one of the most impactful settings in MachineMetrics — it controls the First Active Time displayed throughout the application, including on machine cards, dashboards, and reports.
Important: The First Active Time shown on machine cards and dashboards is calculated from your Start of Day setting. If your Start of Day is set to 6:00 AM, the First Active Time for any given day will be the first moment a machine was active on or after 6:00 AM. Changing this setting will shift when “today” begins across the entire app.
MachineMetrics uses Start of Day as the boundary for all calendar-style periods — not midnight in your timezone.
Reports and historical metrics: Date ranges follow start of day → start of day. For example, if Start of day is 6:00 AM, a report for yesterday includes data from 6:00 AM yesterday through 6:00 AM today. Choosing last week or similar periods uses the same rule: each “day” in the range is your configured working day, not 12:00 AM–11:59 PM.
Live reporting: Views such as OEE and utilization for the current period also roll up from start of day forward, so intraday numbers match how your shop defines “today.”
Timezone: Set the timezone that matches your facility (e.g., America/New_York). Start-of-day boundaries and timestamps are interpreted in this timezone.
Start of Day and Timezone are configured by MachineMetrics — customers do not have access to change them. Although these values are visible under Settings → Company → Details, they are not customer-editable. To request a change to either setting, contact your Solution Delivery Manager (SDM).
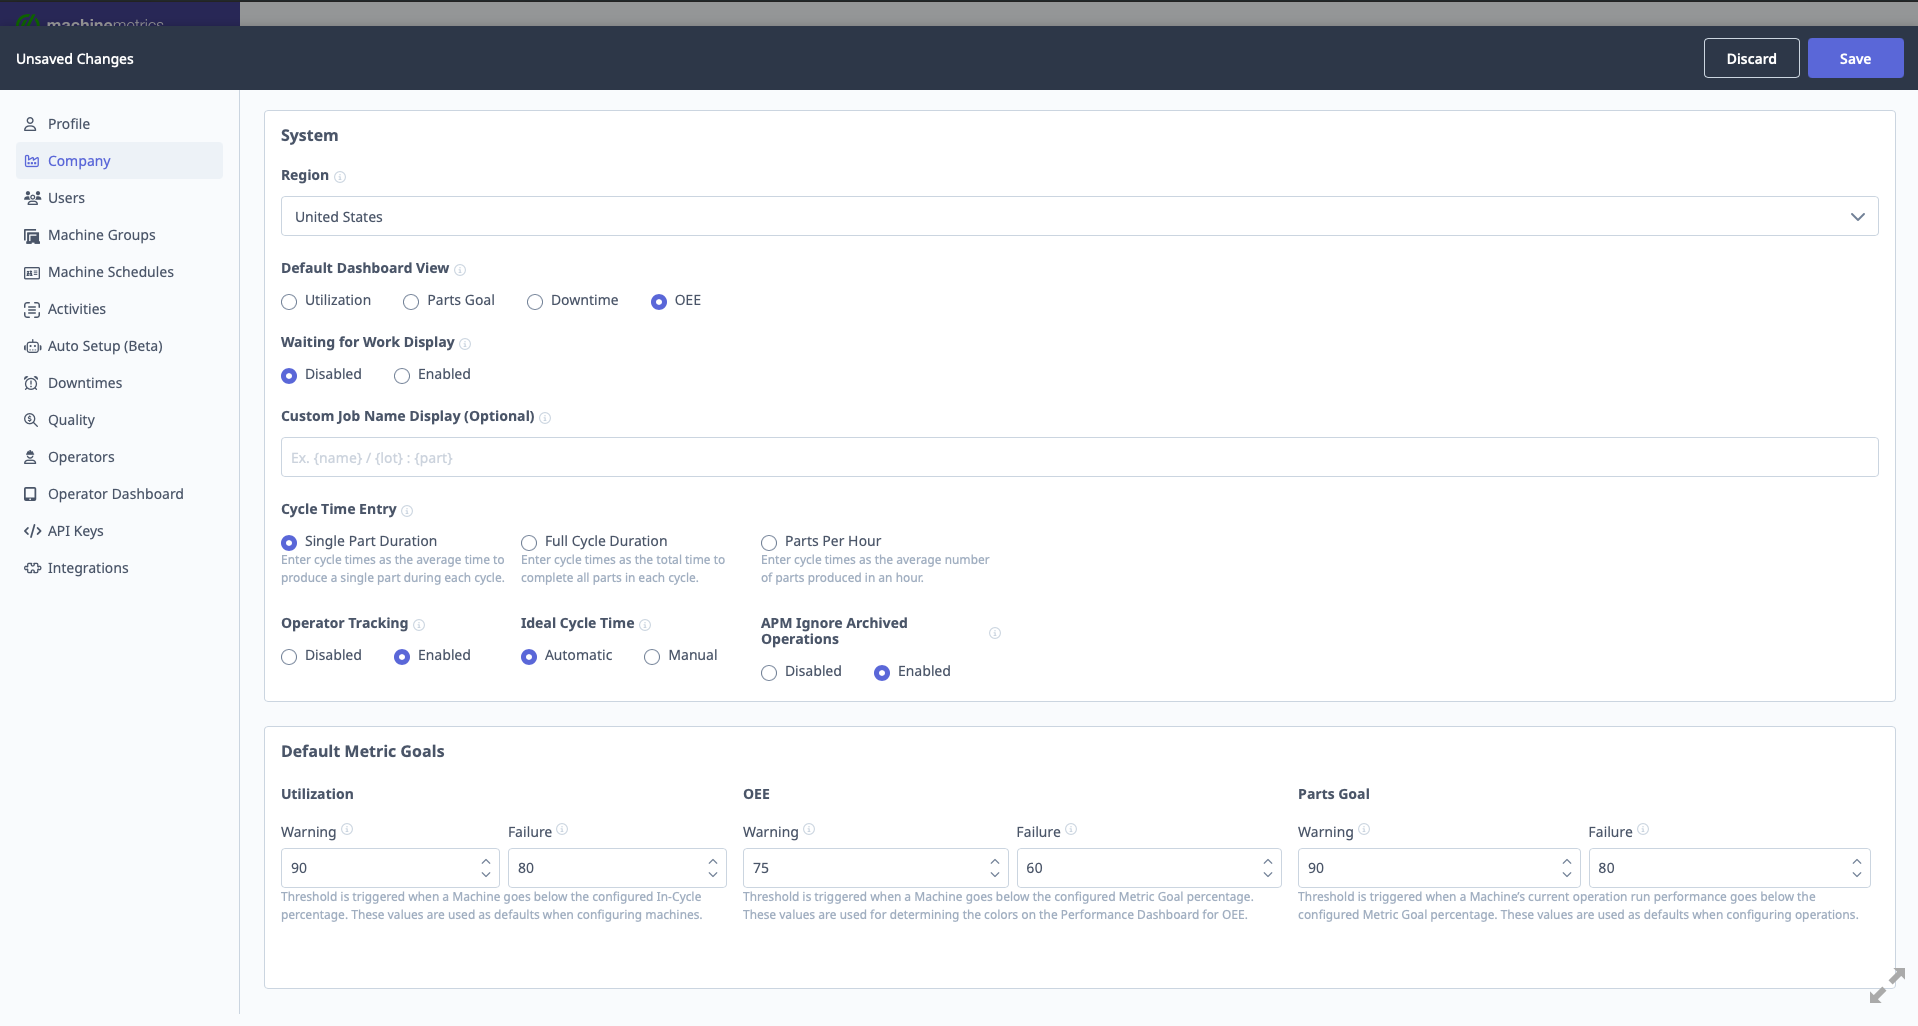
Default Dashboard View
Purpose: Set which dashboard users see when logging in or navigating to dashboards.
Options:
- Utilization: Current Shift Dashboard with Utilization view
- Parts Goal: Current Shift Dashboard with Parts Goal view
- Downtime: Current Shift Dashboard with Downtime view
- OEE: Current Shift Dashboard with OEE view
Configuration: Select default view from dropdown and click Save.
Display Settings
Display "Waiting for Work":
- Enabled: Show "Waiting for Work" status when machine has no assigned operation
- Disabled: Hide this status
Display "Unknown Job":
- Enabled: Show "Unknown Job" when machine is running without assigned operation in MachineMetrics
- Disabled: Hide this status
Use Case: If you don't use Operations/APM, disable "Unknown Job" to reduce clutter.
Allow Operators to Override Job Start/End Times
Purpose: Let operators adjust job timestamps when starting/stopping operations on tablets.
Options:
- Enabled: Operators can backdate job start time (e.g., "I actually started 10 minutes ago")
- Disabled: Job timestamps always use current time
Configuration: Toggle on/off
Use Case: Enable if operators frequently forget to start operations on time. Disable to enforce strict timestamping.
Cycle Time Entry
Purpose: Define how cycle time is entered in operation definitions.
Options:
- Single Part Duration: Enter time for one part (most common)
- Full Cycle Time Duration: Enter time for complete cycle (if multiple parts per cycle)
- Parts Per Hour: Enter production rate (e.g., 30 parts/hour)
Configuration: Select from dropdown
Impact: Affects how Expected Part Time is entered when creating operations.
Operator Tracking
Purpose: Enable/disable operator login functionality on tablets.
Options:
- Enabled: Operators can log in/out on tablets, operator performance tracked
- Disabled: No operator tracking
Configuration: Toggle on/off
See Also: Operators and ShopPulse Interface Guide
Ideal Cycle Time
Purpose: Define how ideal cycle time is handled for OEE Performance calculations.
Options:
- Automatic: MachineMetrics calculates ideal cycle time from historical data
- Manual: Enter ideal cycle time manually for each operation
- Disabled: No ideal cycle time used (Performance based on expected cycle time only)
Configuration: Select from dropdown
See Also: Understanding Your Data Guide
Ignore APM Archive Operations
Purpose: Control whether APM (Automatic Production Monitoring) auto-archives operations.
Options:
- Enabled: APM ignores archived operations (won't create new runs for archived ops)
- Disabled: APM can still create runs for archived operations
Configuration: Toggle on/off
Use Case: Enable to prevent APM from reactivating old operations when program numbers are reused.
Operator Verification
Purpose: Require operators to enter a 6-digit PIN when signing in on the tablet.
Access: Settings → Company Settings → Operator Verification
Default: Off
Configuration: Toggle on/off
Effect when enabled:
- Every operator sign-in on the tablet requires a PIN entry after choosing their name
- Operators without a PIN cannot sign in until an IT Admin generates one for them
- Applies to both MES and non-MES configurations — this is a plain Company Setting with no MES prerequisite
See also: Operator Dashboard — PIN Verification
ERP Job Tracking Settings
Job Tracking Method:
Purpose: Define who controls production run creation.
Options:
- Driven by MachineMetrics: Operators or APM create production runs in MachineMetrics
- Driven by ERP: External ERP system creates/manages production runs via API
Configuration: Select from dropdown
Use Case: If integrating with ERP (e.g., IQMS, E2, JobBOSS), set to "Driven by ERP".
Default Metric Goals
Purpose: Set company-wide performance thresholds for color-coded dashboards.
Configurable Goals:
1. Utilization Goals
- Goal (Green): % or above (e.g., 85%)
- Warning (Yellow): % threshold (e.g., 70%)
- Failure (Red): Below warning threshold
2. OEE Goals
- Goal (Green): % or above (e.g., 70%)
- Warning (Yellow): % threshold (e.g., 50%)
- Failure (Red): Below warning threshold
3. Parts Goal
- Goal (Green): % or above (e.g., 100% of expected)
- Warning (Yellow): % threshold (e.g., 85%)
- Failure (Red): Below warning threshold
Configuration:
- Enter percentages for each threshold
- Click Save
Impact: Determines Performance Wheel colors on ShopPulse Interface and dashboard tile colors.
Override: Machine-specific or operation-specific goals override company defaults.
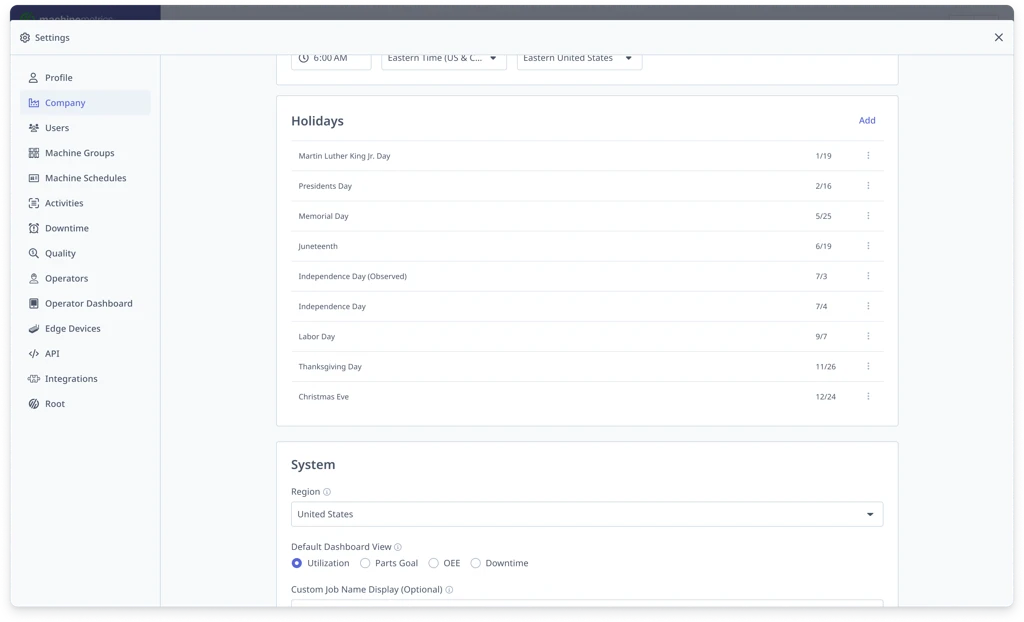
Holidays
Purpose: Define company-wide non-production days where downtime is automatically categorized as planned downtime, so metrics like OEE and availability reflect only expected production time.
Access: Settings → Company → Holidays
Prerequisite: Enable Exclude Planned Downtime from Scheduled Time in Settings → Downtimes before configuring holidays. Without this setting, downtime will still be categorized with the selected reason, but Scheduled Time and related metrics will not be adjusted.
How holidays work:
- Apply to all machines across all machine schedules
- Span a full day based on your company's Start of Day setting
- Automatically categorize any idle time during the holiday with the selected downtime reason
- Recur annually on the configured date
- Apply from the date they are created forward — historical metrics are not affected
Note: Existing automatic downtime categorization rules covering the same time period are no longer required once a holiday is configured.
Impact on metrics:
| Metric | Impact |
|---|---|
| Scheduled Time | Reduced by planned downtime during the holiday |
| Availability | Recalculated using reduced Scheduled Time |
| OEE | Recalculated (Availability component changes) |
| OOE | Recalculated |
| TEEP | Recalculated |
| Parts Goal | Recalculated using reduced Scheduled Time |
| Performance | No impact |
| Quality | No impact |
Adding a Standard Holiday
- Navigate to Settings → Company
- Scroll to the Holidays section
- Click Add
- In the Holiday field, select from the list — defaults are based on your company's region; use the search bar to search all holidays. The date populates automatically.
- Select a Downtime Category to classify idle time during this period
- Click Save
Adding a Custom Holiday
- Click Add, then in the Holiday search bar click + Custom holiday
- Enter a unique Name
- Select a Date — custom holidays recur on this date every year
- Select a Downtime Category
- Click Save
Editing or Removing a Holiday
Click the three-dot menu (⋮) next to a holiday and select Edit or Delete.
FAQ:
- Will holidays change historical metrics? No — holidays apply from the date they are created forward.
- What if a machine runs during a holiday? Production activity is recorded normally. Only downtime is automatically categorized.
- Can holidays differ by machine? No — holidays are company-wide.