Downtime Guide
Overview
MachineMetrics records when machines stop. Downtime categories explain why they stopped, helping operators and supervisors identify the losses to address first.
This guide covers downtime detection, category planning, manual categorization, and reporting. For rule configuration and editor screenshots, see Automatic Downtime Categorization. For rejected parts and reject reasons, see the separate Quality Guide.
Downtime Tracking
What is Downtime?
Downtime is any period when a machine leaves a productive state (in-cycle) and enters an idle state.
Downtime Types:
- Planned Downtime: Scheduled events (breaks, PM, shift meetings)
- Unplanned Downtime: Unscheduled events (breakdowns, waiting for material, alarms)
- Microstops: Very short stops (< configurable threshold, e.g., 60 seconds)
- Long Downtime: Stops exceeding microstop threshold
Key Distinction:
- Planned vs. Unplanned affects how downtime is reported (separate categories in reports)
- Both affect OEE Availability equally (see Impact on OEE)
Automatic Downtime Tracking (ADT)
MachineMetrics records downtime from the machine's execution state without operator input. A stop begins when execution becomes inactive and ends when it returns to active; the recorded interval provides the event's start, end, and duration.
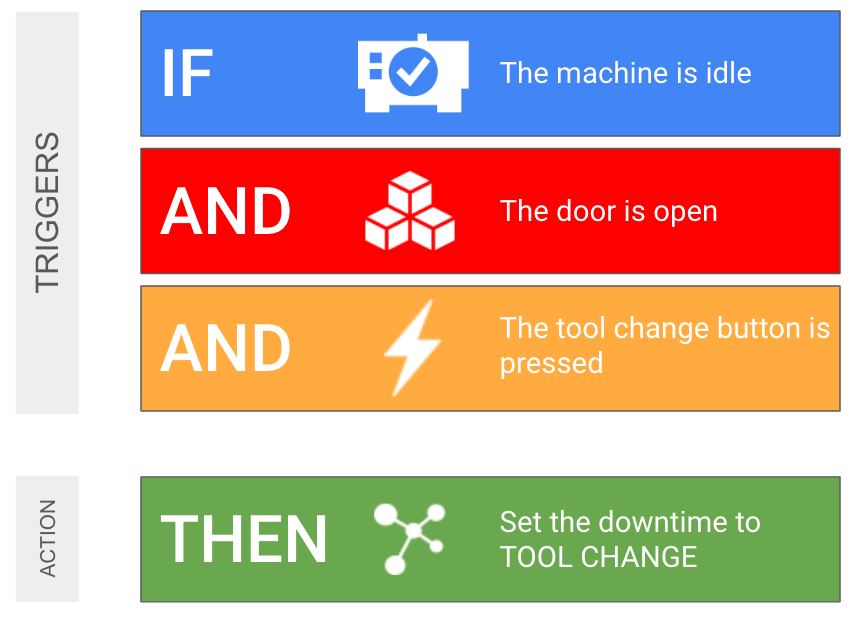
Detection records when the machine stopped. Assigning why it stopped is a separate step: use automatic classification rules for known conditions or manual categorization for operator context.
Downtime States
Review active and inactive execution in the machine Timeline. Connectivity and activity information, such as disconnected periods and setup activities, provide additional context for a stop.
Downtime Categories
What are Downtime Categories?
Downtime Categories (also called "Downtime Reasons") classify downtime events by root cause.
Purpose:
- Understand why downtime occurred
- Enable root cause analysis (Pareto charts)
- Trigger automated workflows (notify specific personnel)
- Track improvement initiatives
Choosing Your Initial Categories
Start with a small set of clear, broad reasons that operators can select consistently and your team can act on. For example: Setup/Changeover, Material, Tooling, Maintenance, and Operator. Choose the reasons that fit your operation; you do not need to create every category shown in this guide.
Start with a detailed hierarchy only if you already have an established downtime tracking system and need to replicate it in MachineMetrics. Otherwise, review actual downtime first and add detail when it supports a specific improvement or reporting need.
Plan categories around reporting. The Downtime Report uses these reasons in the Pareto chart, event table, and downtime-by-machine chart. Decide which losses you need to compare across machines and over time before creating categories. Too many similar reasons split related losses across separate labels and make the largest problems harder to recognize.
Use the same category definitions for operator entries and automatic rules so both contribute to the same reporting view. Add a subcategory when distinguishing that cause will change an action or analysis, and check that operators can recognize the distinction reliably.
Downtime Category Hierarchy
Hierarchical Structure: Downtime categories can have multiple levels (parent → subcategory → sub-subcategory). Use this structure when your reporting needs justify more detail; a hierarchy is optional.
Format: Use pipe (|) separator
Parent | Subcategory | Sub-subcategory
Examples:
Tooling | Tool Change | End of Life
Tooling | Tool Break | Complete Break
Tooling | Tool Unavailable

Maintenance | Planned Maintenance | PM Schedule
Maintenance | Unplanned Maintenance | Breakdown

Material | Material Unavailable
Material | Incorrect Material
Benefits of Hierarchy:
- Broad Analysis: View all "Tooling" issues
- Specific Analysis: Drill down to "Tool Break" → "Complete Break"
- Targeted Workflows: Notify maintenance for "Tool Break", notify tool crib for "Tool Unavailable"
Configuring Downtime Categories
Access:
- Navigate to Settings → Downtimes → Downtime Categories
- Click "+ New Category"
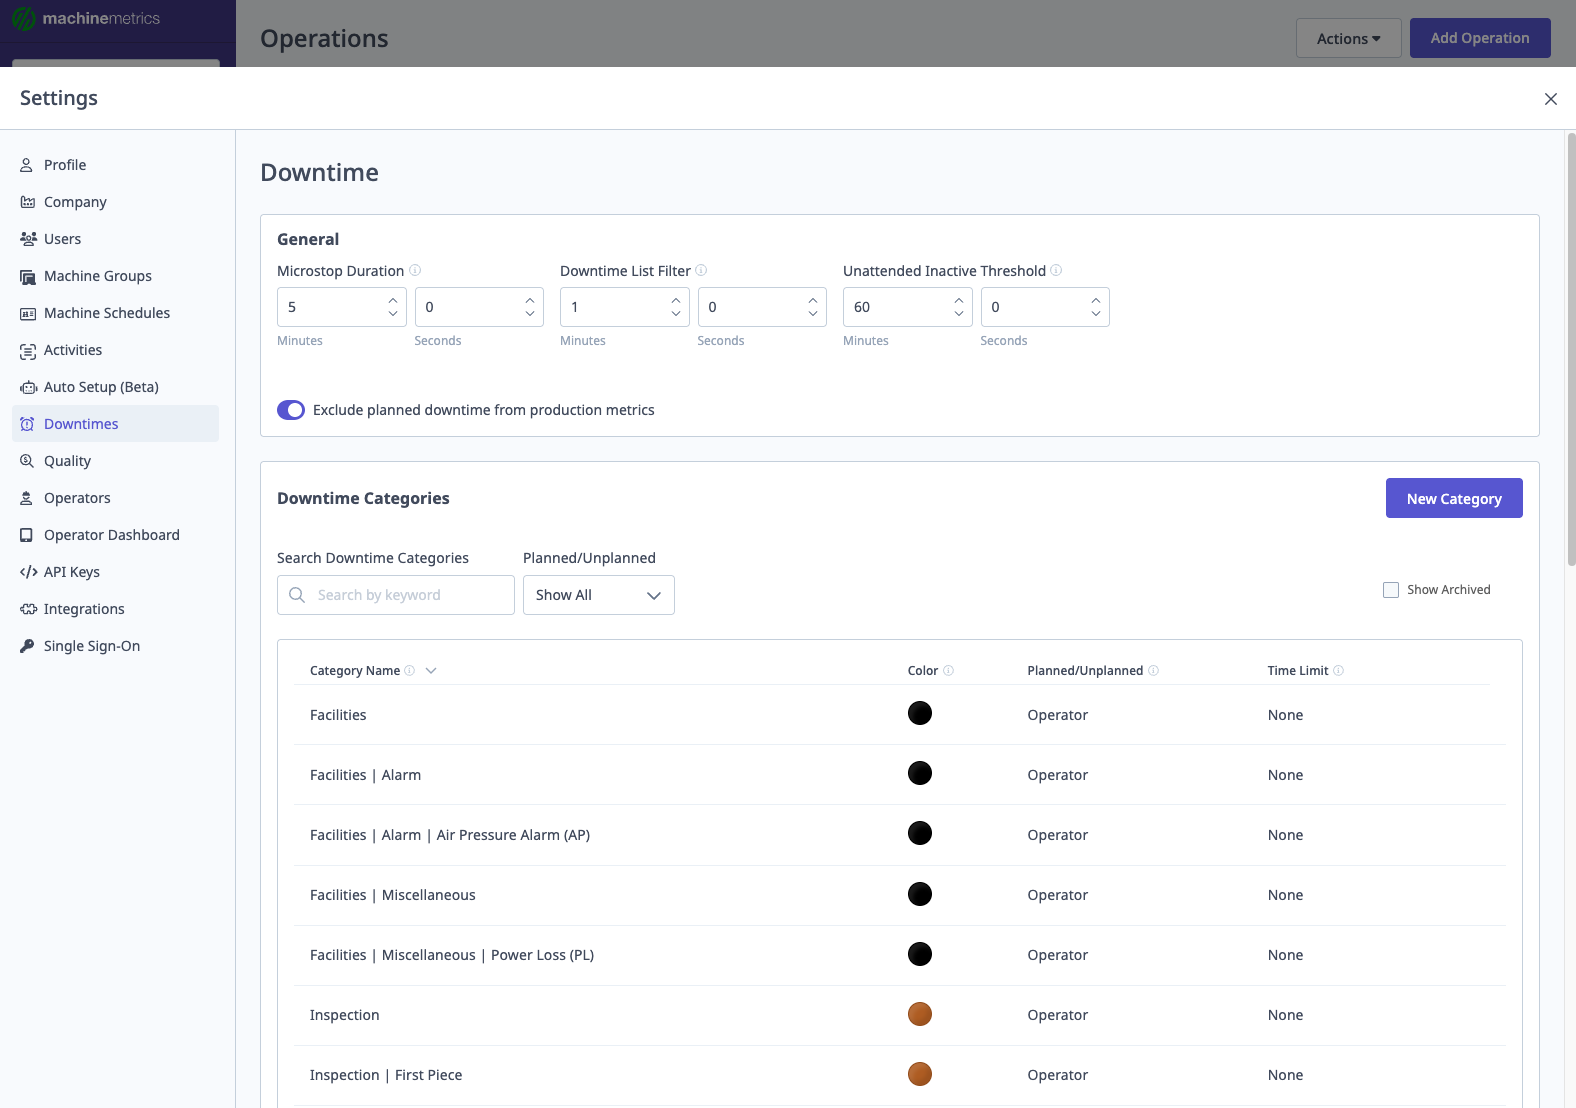
Fields:
1. Category Name
- Enter name
- For hierarchy: Use
|separator (e.g.,Tooling | Tool Break) - Important: Each level requires its own entry
- Create parent:
Tooling - Create subcategory:
Tooling | Tool Break - Create sub-subcategory:
Tooling | Tool Break | Complete Break
- Create parent:
2. Planned/Unplanned Behavior
- Planned or Unplanned: Operator chooses when categorizing
- Unplanned: Always marked as unplanned
- Planned: Always marked as planned
- Planned with Limit: Planned up to X minutes, then becomes unplanned
- Example: "Operator Break" planned for 15 minutes; if break exceeds 15 minutes, excess is unplanned
3. Color
- Assign color for visual identification (dashboards, reports, timelines)
- Use consistent colors for related categories
4. Archive
- Archive obsolete categories (not deleted)
- Archived categories hidden from operator selection
- Historical data retained
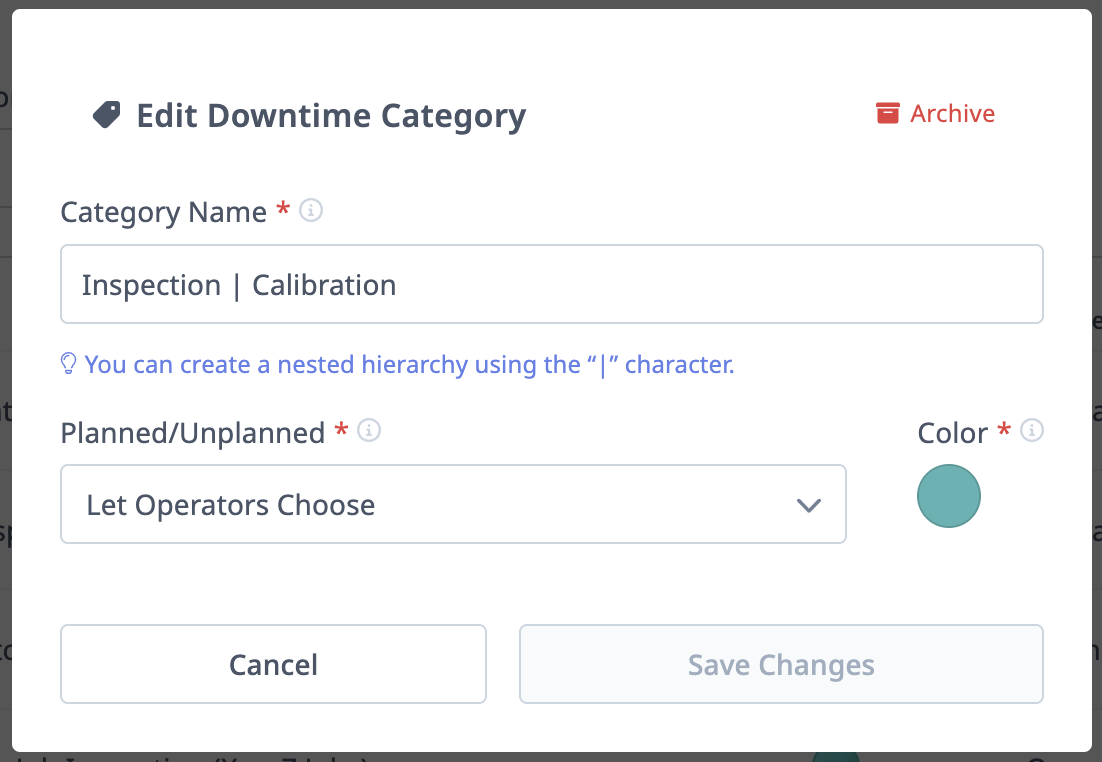
Sample Downtime Categories
A simple starting set might be:
- Setup/Changeover
- Material
- Tooling
- Maintenance
- Operator
As reporting identifies a need, you might split Tooling into Tooling | Tool Change and Tooling | Tool Break. Introduce that distinction when you need to compare those losses and respond differently to them. A detailed existing downtime system can supply your initial hierarchy instead; see Choosing Your Initial Categories.
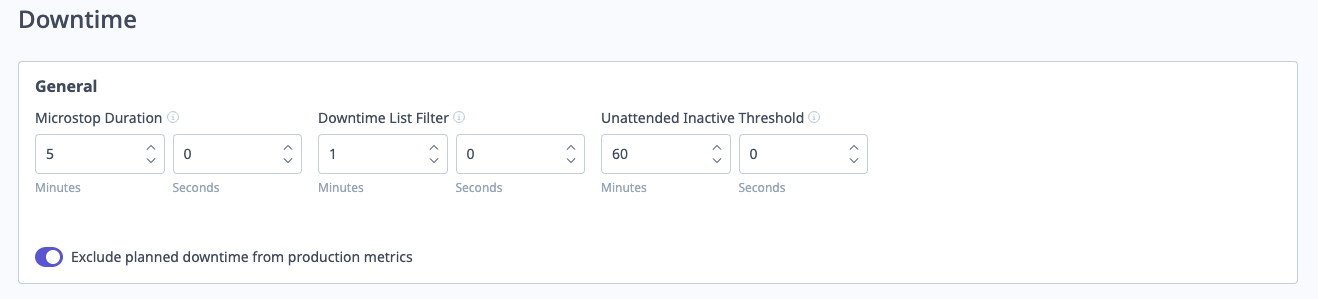
General Downtime Settings
Access: Settings → Downtimes → General
Key Settings:
1. Microstop Duration (seconds)
- Threshold separating microstops from long downtime
- Example: 60 seconds
- Stops < 60 sec = Microstops (typically not categorized)
- Stops ≥ 60 sec = Long downtime (prompted for categorization)
2. Downtime List Filter (seconds)
- Hides events shorter than this from operator categorization list
- Reduces clutter (operators don't see very short stops)
- Example: 30 seconds filters out stops < 30 sec
3. Unattended Inactive Threshold (minutes)
- During unattended shifts, how long machine can be idle before marked as "unscheduled"
- Affects Availability calculation
- Example: 30 minutes
- If idle > 30 min during unattended shift, time becomes unscheduled (doesn't hurt availability)
4. Exclude Planned Downtime from Production Metrics
- Toggle to exclude planned downtime from scheduled time
- Impact on OEE: See Impact on OEE section
- Enabled: Planned downtime excluded from Availability and Performance (not from Quality)
- Disabled: All downtime affects Availability equally
Automatic Downtime Classification
Automatic Downtime Classification (ADC) assigns reasons to recorded downtime using rules configured in My Apps → Downtime Rules. Use it for repeatable conditions such as known alarms, machine states, or scheduled events.
See the Automatic Downtime Categorization guide for the editor screenshot walkthrough, supported rule modes, timing options, priority, and troubleshooting.
Manual Downtime Categorization
Why Manual Categorization?
Not All Downtime Can Be Auto-Classified:
- ADC requires known, repeatable triggers
- Some downtime is unpredictable (ad-hoc issues)
- Operators have context machines don't (e.g., "waiting for forklift")
Manual Categorization:
- Operators select downtime reason from tablet
- Supervisors can categorize retroactively
Operator Categorization (Real-Time)
Three Methods:
Method 1: Current Downtime Pop-Up (Most Common)
When: Pop-up appears on ShopPulse when downtime exceeds "Long" threshold.
Steps:
- Pop-up appears in bottom right of tablet
- Operator taps "Categorize"
- Selects downtime reason from list
- (Optional) Adds note for context
- Taps "Save"
- Downtime categorized
Benefits:
- Immediate (while event is fresh)
- Most accurate (operator knows exactly what happened)
- Reduces uncategorized downtime
See Also: Categorizing Downtime in ShopPulse guide
Method 2: Categorize Button (On-Demand)
When: Operator wants to categorize events later (didn't categorize immediately).
Steps:
- Tap "Categorize" button in Navigation Bar (shows red badge with count)
- List of uncategorized events appears
- Select event to categorize
- Choose downtime reason
- (Optional) Add note
- Tap "Save"
Use Case:
- Operator was busy during downtime (dismissed pop-up)
- Reviewing downtime at end of shift
Method 3: All Downtime Tab
When: Reviewing all downtime for shift (categorized and uncategorized).
Steps:
- Open "All Downtime" tab on ShopPulse
- Filter to show uncategorized events
- Tap uncategorized event
- Select downtime reason
- (Optional) Add note
- Tap "Save"
Use Case:
- End-of-shift review
- Identifying patterns (multiple events of same type)
Supervisor Categorization (Retroactive)
Who: Managers, Executives, or operators (retroactively categorize past events)
Where:
- ShopPulse: Access from web or tablet
- Timelines Dashboard: Visual timeline view (web only)
Timelines Dashboard (Preferred for Batch):
- Navigate to Dashboards → Timelines
- Select date range and machines
- Uncategorized downtime shown (yellow segments without labels)
- Click segment to open detail panel
- Select downtime category
- (Optional) Add note
- Click "Save"
- Segment updates with category and color
If a downtime event spans more than one period you need to attribute separately (e.g., it crosses a shift change), you must categorize the full event first. Only after it's categorized will a Split Event option appear. Selecting Split lets you choose a split point and creates two separate events, which can then each be re-categorized independently.
Batch Categorization:
- Select multiple segments (if same reason)
- Apply category to all at once
- Saves time for repetitive categorization
See Also: Timelines Dashboard
Adding Notes to Downtime
Purpose:
- Provide additional context
- Explain root cause
- Track corrective actions taken
Example Notes:
- "Waiting for bar stock delivery from warehouse"
- "Tool #3 broke at 2:30 PM - replaced with backup"
- "Setup taking longer due to complex fixture alignment"
- "Operator training new employee on setup procedure"
Where Notes Appear:
- Downtime Reports (Events Table)
- Timelines Dashboard (click event for details)
- Downtime analysis exports (CSV)
Impact on OEE
Downtime affects the Availability component of OEE. For the complete metric definitions and calculations, see Understanding Your Data.
How Downtime Affects OEE
Availability Component:
Availability = (Running Time / Scheduled Time) × 100%
Key Points:
- All downtime reduces Availability (planned, unplanned, uncategorized)
- Categorizing downtime (planned vs. unplanned) does NOT change OEE calculation
- Categorization is for reporting and analysis only
- Planned and unplanned downtime affect Availability equally
- Setup impact: Planned setup can be excluded from scheduled time (configuration setting)
- If excluded: Planned setup does not hurt Availability or Performance
- If not excluded: Planned setup reduces Availability
Performance Component:
Performance = (Ideal Cycle Time / Actual Cycle Time) × 100%
Key Points:
- Downtime does not directly affect Performance
- Performance is calculated only over scheduled time (excluding planned setup if configured)
- Slow cycles (not downtime) reduce Performance
Quality Component:
- Not affected by downtime
- Only affected by rejected parts
Planned vs. Unplanned Downtime
Important Clarification:
Categorizing downtime as "Planned" vs. "Unplanned" does NOT change OEE calculation.
Purpose of Categorization:
- Reporting: Separate planned vs. unplanned in reports
- Analysis: Understand controllable (unplanned) vs. expected (planned) downtime
- Workflows: Trigger different actions based on category
- NOT for OEE: Both affect Availability equally
Exception: Planned Setup (if configured)
- Setting: "Exclude planned downtime from production metrics"
- If enabled: Planned setup excluded from scheduled time
- Does not hurt Availability or Performance
- Still included in Quality calculation
- If disabled: All downtime affects OEE equally
Downtime Reports
Downtime Report
Purpose: Analyze downtime patterns by category, machine, and time period.
Access: Navigate to Reports → Downtime
Report Sections:
1. Downtime Pareto Chart
- Bar chart showing top downtime categories
- Sorted by duration (minutes)
- Includes occurrences (count)
- Pareto line (cumulative percentage)
2. Downtime Events Table
- List of all downtime events
- Columns:
- Start Time: When downtime began
- Duration: Length of event
- Machine: Which machine
- Reason: Downtime category
- Message: Operator notes
- Planned: Planned/Unplanned status
- Sortable: Click column headers
- Searchable: Text search (Machine, Reason, Message)
- Clickable: Click event to categorize/recategorize
3. Downtime By Machine
- Stacked bar chart
- Each bar = one machine
- Colors = downtime categories
- Shows which machines have most downtime
Filters:
- Date/Time Range: Select period
- Machine or Machine Group: Filter to specific machines
- Shift: Filter to specific shift
- Include Uncategorized: Show/hide uncategorized downtime
Use Cases:
- Identify top downtime drivers (Pareto principle)
- Compare downtime across machines
- Track improvement initiatives (before/after)
- Justify capital investments (downtime reduction value)
See Also: Downtime Report
For combined production metrics, see the OEE Report. Use Report Builder for custom metrics and grouping.
Best Practices
Downtime Tracking Best Practices
1. Categorize Downtime as It Occurs
- Most accurate when fresh
- Use operator pop-up (immediate method)
- Review uncategorized at end of shift
2. Use Clear, Intuitive Category Names
- Names should be obvious to operators
- Examples:
- ✅ "Waiting for Material"
- ✅ "Tool Change"
- ❌ "Category 1"
- ❌ "Misc"
3. Start with a Small Category Set
- Follow Choosing Your Initial Categories
- Add subcategories when the reporting reveals a useful distinction
- Replicate a detailed hierarchy initially only when you already use an established downtime system
4. Automate Repeatable Reasons
- Use automatic classification for conditions that your machine data or schedules identify reliably
5. Review Uncategorized Downtime Weekly
- Identify patterns
- Create ADC rules for common events
- Batch categorize manually if needed
6. Train Operators on Why It Matters
- "Your input helps us improve"
- Show reports and improvements resulting from data
- Recognize operators who consistently categorize
7. Keep Microstop Threshold Reasonable
- Too low: Operators overwhelmed with pop-ups
- Too high: Miss significant downtime
- Recommended: 30-60 seconds
ADC Best Practices
Follow the auto downtime rollout and validation guidance when creating or changing rules.
Getting Help
Common Questions
"Downtime not being detected"
- Check machine connectivity (is data flowing?)
- If data is flowing and downtime still is not reporting, contact MachineMetrics support — in-cycle/execution-state mapping is machine-specific and support can confirm the correct configuration
"Downtime pop-up not appearing on tablet"
- Check microstop threshold (is downtime long enough?)
- Check Downtime List Filter (is downtime filtered out?)
- Verify ShopPulse settings
"ADC rule not working"
- Follow the auto downtime troubleshooting checklist
- Compare the source data and assigned reason in the machine Timeline
"Planned downtime still affecting OEE"
- Important: All downtime affects OEE equally (planned/unplanned categorization is for reporting only)
- Exception: Planned setup can be excluded (Settings → Downtimes → General → "Exclude planned downtime from production metrics")
Contact Support
Contact MachineMetrics Support with the machine, event time and timezone, affected category, screenshots, and expected behavior. Include the rule configuration for automatic categorization issues.