Heidenhain iTNC 530 and TNC 530
The iTNC 530 and TNC 530 use the Heidenhain proprietary connector and need no licensed option — the Ethernet port is standard.
Connect to: the control's Ethernet port · Adapter type: Heidenhain
These steps also work for a TNC 640 or TNC 730 running Option 18, but that is a fallback. If you are specifying or buying an option, choose Option 56 and follow TNC 640 / TNC7 instead.
Network Configuration
The control has to be reachable from the Edge device before you configure anything in MachineMetrics.
Physical Connection
- Locate the Ethernet port on the control
- iTNC 530 / TNC 530: typically on the rear of the control panel
- Connect a network cable from the control to your network switch or router
- Verify the link lights on the Ethernet port are active
Accessing Network Settings on the iTNC 530 / TNC 530
-
Press the Programming and Editing operating mode softkey (the right-arrow icon at the top-right of the softkey panel)

-
Press the MOD key on the control keyboard

-
Enter password NET123 then press ENT to access the network settings menu
-
Navigate to Network or Ethernet Settings
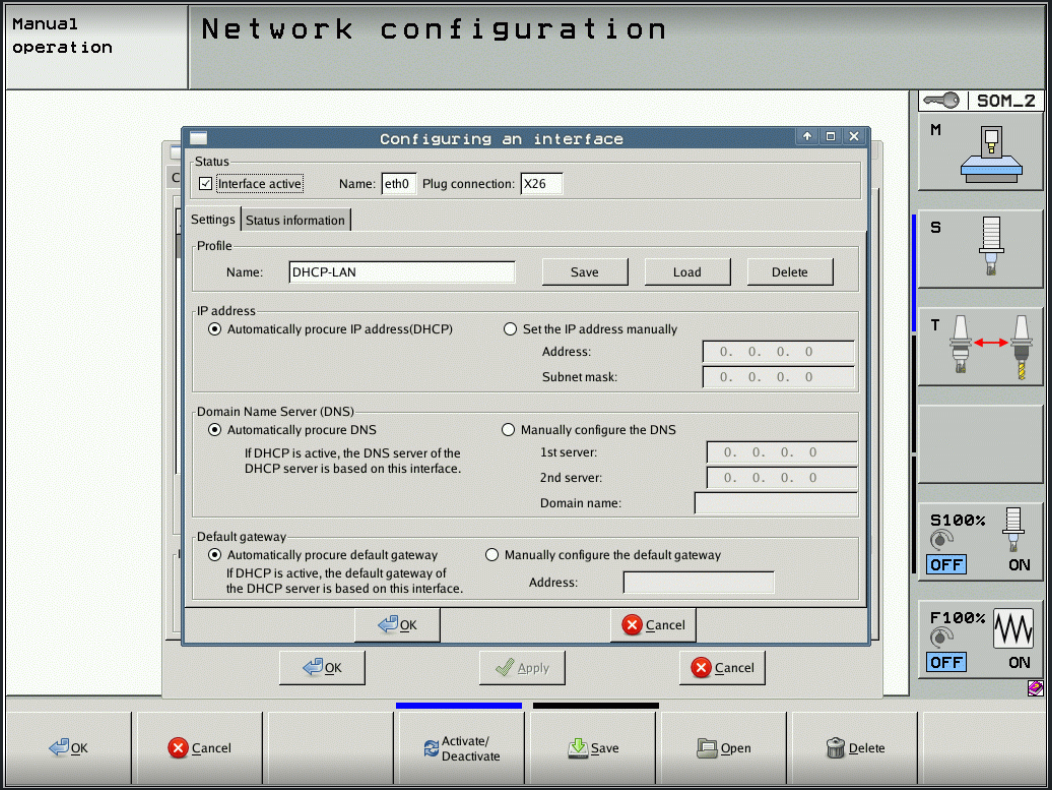
iTNC 530 network configuration dialog (Programming & Editing mode → MOD → NET123 → Network). Select Automatically procure IP address (DHCP) or Set the IP address manually and enter the Address and Subnet mask. Click OK → Apply → Save to commit.
Configuring the Address
For Static IP Address (Recommended):
- In Network Settings, select Manual or Static IP
- Enter the following network information:
- IP Address: (e.g., 192.168.1.100)
- Subnet Mask: (e.g., 255.255.255.0)
- Gateway: (e.g., 192.168.1.1)
- DNS Server: (optional, e.g., 192.168.1.1 or 8.8.8.8)
- Save settings and reboot control if prompted
For DHCP (Dynamic IP):
- In Network Settings, select DHCP or Automatic
- Control will automatically obtain IP address from network
- Note the assigned IP address for later use
- Recommended: Reserve this IP in your DHCP server to prevent changes
Important Network Configuration Notes:
- Use static IP or reserved DHCP to ensure consistent connectivity
- Ensure IP address is on same subnet as Edge device
- Document the IP address for MachineMetrics configuration
- Verify no IP conflicts exist on the network
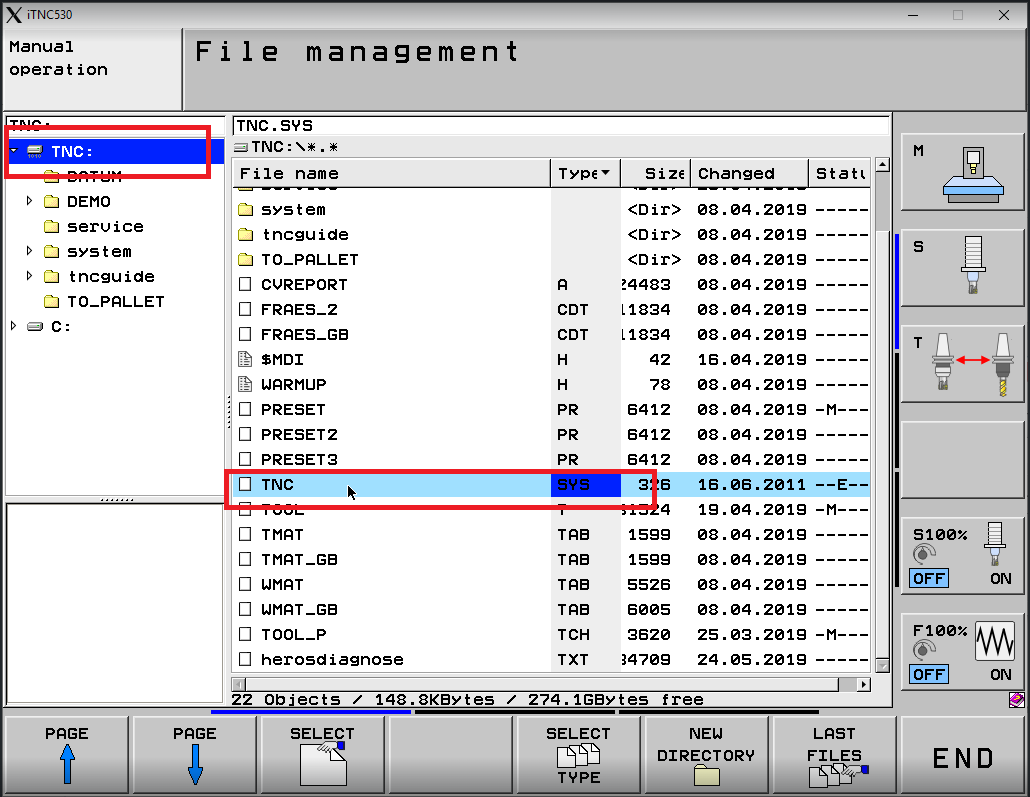
iTNC 530 alternative — editing TNC.SYS directly: Network settings can also be viewed and modified via the File Management screen. Press PGM MGT, navigate to
TNC:\, and locate the TNC.SYS file (type SYS). This file stores the network configuration and can be edited in text mode if the graphical network menu is not accessible.
Testing the Connection
Step 1: Verify IP Configuration
On the Heidenhain control:
- Navigate to Network Settings
- Verify IP address is displayed and valid
- Check connection status shows "Connected" or "Active"
Step 2: Test from Control (if available)
Some Heidenhain controls have built-in network diagnostics:
- Access Network Settings → Diagnostics (if available)
- Try pinging the Edge device IP address
- Verify successful response
Step 3: Test from Edge Device
Ping the control via Diagnostics → Manual Ping in Edge Management, or from another computer on the network:
ping [MACHINE-IP-ADDRESS]
Example:
ping 192.168.1.100
Expected Result: Continuous successful ping responses with low latency (< 10ms typical)
Adding Machine in MachineMetrics
Step 1: Create Machine Record
- Log into MachineMetrics at app.machinemetrics.com
- Navigate to Assets → Machines
- Click Add Machine
- Enter machine details:
- Machine Name: (e.g., "Hermle-C40U-01")
- Machine Type: (Mill, Machining Center, etc.)
- Make: (e.g., Hermle, DMG Mori, Starrag)
- Model: (e.g., C40 U, DMU 50, etc.)
- Serial Number: (optional but recommended)
- Click Next
Step 2: Select Edge Device
- Choose the Edge device that will connect to this machine
- Ensure Edge device is on same network as the Heidenhain control
- Click Next
Heidenhain Connector Configuration
Step 1: Select Connection Method
- In Data Collection Method, select Heidenhain
- If "Heidenhain" is not visible in the dropdown, contact MachineMetrics support
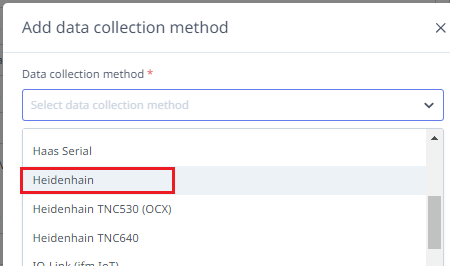
Select Heidenhain from the Data Collection Method dropdown. If you have a TNC 640 with Option 56 (OPC-UA), use the OPC-UA connector instead — see the OPC-UA guide.
Step 2: Enter Machine IP Address
- Enter the Heidenhain control's IP address (e.g., 192.168.1.100)
- The connector will automatically detect the control type and available data
Step 3: Save Configuration
- Review the IP address for accuracy
- Click Test Connection to verify connectivity
- If successful, click Save
Note: The Heidenhain connector automatically discovers available data items from the control. No manual configuration of data items is required.
Reading PLC Data Items
The Heidenhain connector supports reading additional PLC data beyond the standard data items via the machine's JSON configuration. Four PLC table types are supported, each introduced in a different adapter version.
Adapter Version Requirements
| Table Type | Identifier | Minimum Version | Value Type |
|---|---|---|---|
| WORD register | W | 4.0.3.0 | Numeric |
| DWORD register | D | 4.0.3.0 | Numeric |
| String | S | 4.0.5.0 | String |
| Marker (bit) | m | 4.1.0.0 | 0 or 1 |
Verify the adapter version on your Edge device before configuring PLC reads.
Configuration
Add a plc block to the machine's JSON configuration. Each entry takes a variable name as the key and a table identifier plus index as the value:
{
  "plc": {
    "contouring_feed_rate": "D, 388",
    "actual_speed_rpm": "W, 322",
    "active_program": "S, 33",
    "pulse_end_pgm_m02_m30": "m, 7270",
    "end_pgm_m30": "m, 8170",
    "end_pgm_m02": "m, 8164",
    "part_counter_plus_1": "m, 10440",
    "reset_part_counter": "m, 10439"
  }
}
Values are not manipulated — they are reported exactly as read from the PLC.
Machine Active Signals
The following standard legacy marker addresses can be used to determine machine and program state. These addresses are documented in the Heidenhain TNC 640 technical manual and are available on iTNC 530 and TNC 640 controls via the legacy numerical API.
| Marker | Address | Description |
|---|---|---|
NN_ChnControlInOperation | m, 4176 | High when the control is actively running a program |
PP_ChnNcStart | m, 4564 | NC start / cycle active |
PP_ChnNCStop | m, 4560 | NC stop |
NN_SpiInMotion | m, 4002 | Spindle in motion |
NN_SpiSpeedOK | m, 4001 | Spindle speed reached |
NN_ChnErrorFStop | m, 4220 | Feed stopped on error |
NN_ChnErrorNCStop | m, 4221 | NC stop on error |
NN_ChnErrorEmergencyStop | m, 4222 | Emergency stop active |
iTNC 530 only: M4170 (NN_ChnProgEnd equivalent) fires on normal program end (M30, M02, END PGM) and resets automatically on the next program start. It does not fire on operator stop or e-stop, making it a reliable cycle-complete signal. This marker does not have a documented legacy address on TNC 640 — use the MG_PULSE_END_PGM_M02_M30 OEM marker (if present) or an M-code workaround instead.
Combining with Part Count Word Register
The plc block can be combined with the partcounting block in a single configuration:
{
  "partcounting": {
    "plcPartCountMemAddressTNC640": "2056"
  },
  "plc": {
    "control_in_operation": "m, 4176",
    "nc_start": "m, 4564",
    "spindle_in_motion": "m, 4002",
    "pulse_end_pgm_m02_m30": "m, 7270",
    "end_pgm_m30": "m, 8170",
    "end_pgm_m02": "m, 8164",
    "part_counter_plus_1": "m, 10440",
    "reset_part_counter": "m, 10439"
  }
}
If the part counter word register holds a value of zero, the machine's CNC programs likely do not include the M-code required to increment the counter. On Doosan machines with Heidenhain controls this is typically M54, but check the machine builder's documentation to confirm the correct M-code before modifying any programs.
Testing the Adapter Connection
Step 1: Verify Adapter Status
- Navigate to machine page in MachineMetrics
- Check connection status indicator:
- Green: Connected and receiving data
- Yellow: Connecting or intermittent
- Red: Connection failed
Step 2: Check Data Items
- Go to Diagnostics tab on machine page
- Verify data items are populating:
execution- Should show current machine stateprogram- Should show active program namespindle_speed- Should show real-time spindle RPMtool_number- Should show current tool
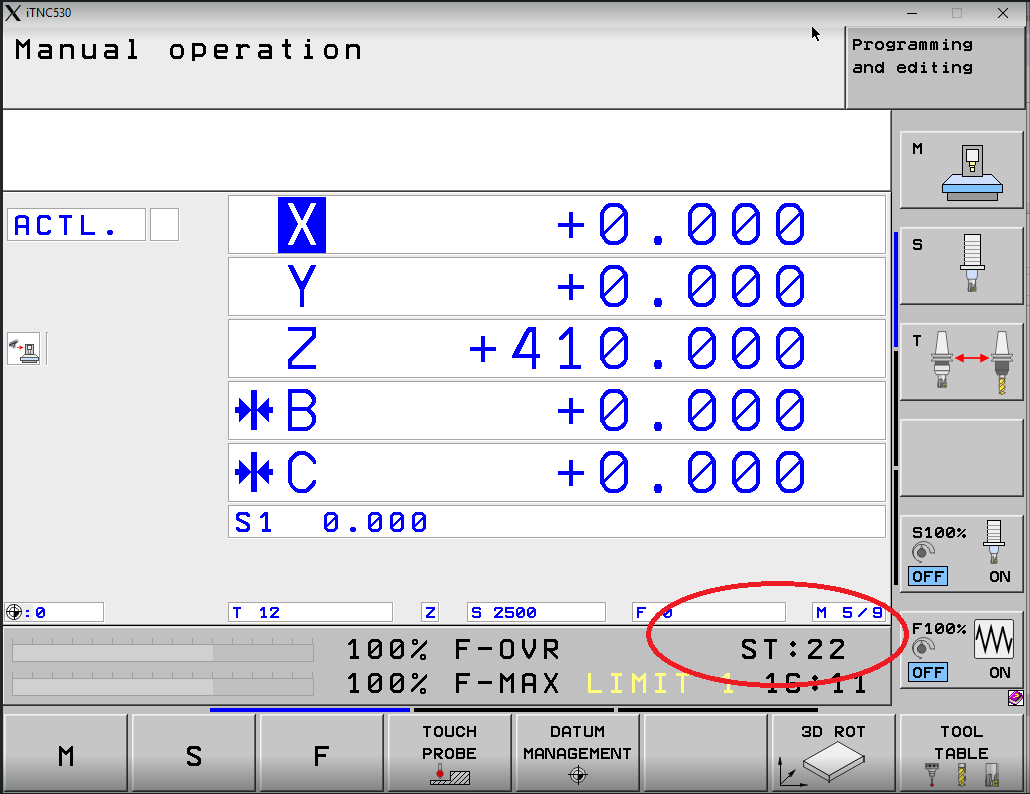
The iTNC 530 Manual Operation screen. At the bottom status bar, ST shows the current part count — the value circled here (ST:22) means 22 parts have been completed. MachineMetrics reads this counter to track production. When connected and data is flowing, verify the part count in MachineMetrics Diagnostics matches the ST value visible on the control.
Step 3: Verify in Machine View
- Navigate to Machines → Select your Heidenhain machine
- Verify machine status displays correctly:
- Status (In Cycle, Idle, etc.)
- Current program
- Spindle speed
- Tool information
Part Count
The iTNC 530 has no dedicated part counter that MachineMetrics can read directly, so the count comes out of the PLC WORD table. You find the address on the control, then tell MachineMetrics to read it.
Understanding the PLC WORD Table
Heidenhain machines often do not have a dedicated, standard part counter location that MachineMetrics can read directly. Instead, part count data is typically stored in the PLC WORD table, which is a memory area within the control that stores various machine variables.
What is the PLC WORD Table?
The PLC WORD table is a data structure in the Heidenhain control that contains:
- Machine status flags
- Counters (including part counts)
- Process variables
- Custom user data
Why Different Locations?
Part counter addresses vary by:
- Control model (iTNC 530 vs TNC 640)
- Machine builder customization
- Auxiliary equipment (pallet changers, multi-spindle setups)
- Custom macros or programs
Finding the Part Counter Address
This procedure is specific to the iTNC 530 / TNC 530.
Step 1: Select Programming and Editing mode
Press the Programming and Editing operating mode softkey (the right-arrow icon at the top-right of the softkey panel).
Step 2: Press the MOD key
Press the MOD key on the control's physical keyboard.
Step 3: Enter the access code
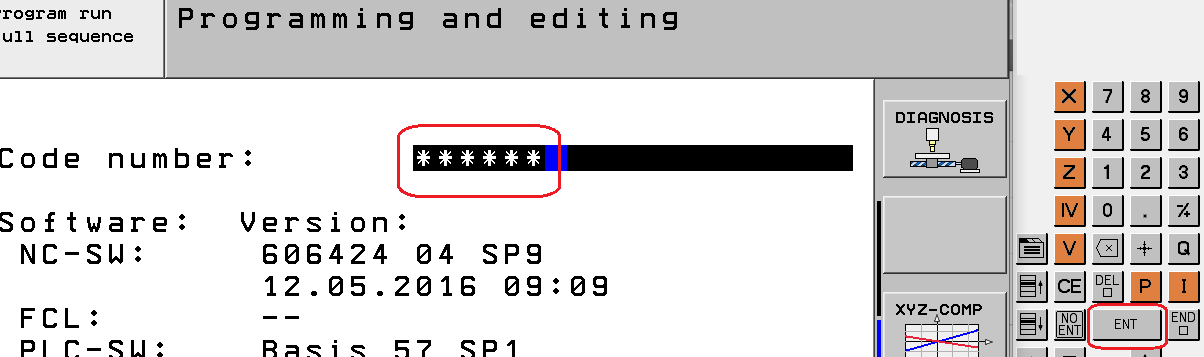
When the Code number: prompt appears, type 807667 then press ENT.
Note: If 807667 does not work, the machine builder may have set a custom PLC password — contact the machine builder for the correct code.
Step 4: Open the TABLE view
Use the arrow softkeys (◄ ►) to scroll the softkey bar until TABLE appears, then press TABLE.

Step 5: Switch to WORD view and DECIMAL mode
In the table view, press W (WORD) to show WORD-size values, then toggle HEX ↕ DEZIMAL to switch to decimal display. This makes it easier to match values with the machine's part counter readout.

Step 6: Locate the part counter in the WORD table
Scan the WORD table for a value that increments when a part completes. On most iTNC 530 machines the part counter is at W20, labeled WG_WERKSTUECK_ZAEHLER (German for "workpiece counter") in the status bar at the bottom of the screen when that cell is selected.
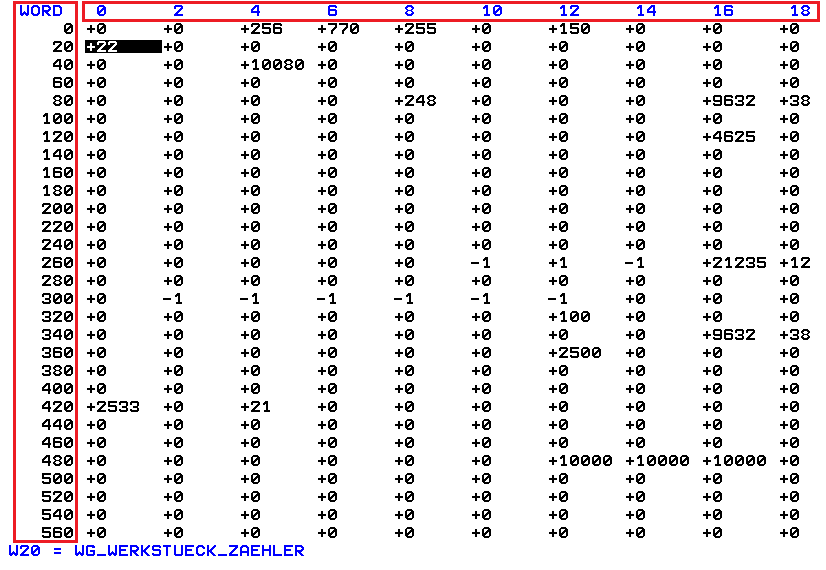
W20 = WG_WERKSTUECK_ZAEHLER is the most common part counter location on the iTNC 530. Run a cycle and watch the value at W20 increment to confirm.
If W20 is not the counter on your machine, scan the table for a label containing any of these terms — machine builders localise them, so check both languages:
Look for labels containing the following terms (in English or German):
English Terms:
workorworkpiecepiece counterorpart counterparts madeorparts countcounterorcountproduction counter
German Terms:
werkstück zähler(workpiece counter)teilezähler(parts counter)arbeitszähler(work counter)zähler(counter)stückzahl(piece count)
Note the WORD address, confirm the value increments as parts complete, and record it for the next step. If you cannot find a counter at all, ask the machine builder for the PLC WORD map — addresses move with builder customisation, pallet changers and multi-spindle setups.
Configuring the Address in MachineMetrics
For iTNC 530 / TNC 530 (WORD 20):
{
  "partcounting": {
    "plcPartCountMemAddressTNC640": "20"
  }
}
Change 20 to whichever address you found. The parameter name mentions TNC640 for
historical reasons — it applies to every control read over the proprietary connector.
Step 2: Configure Data Mapping
- Go to Machine Settings → Data Mapping tab
- Locate the
part_countdata item - Map it to:
- Type: EVENT
- Subtype: PART_COUNT
- Component: Machine or Controller
- Click Save
Step 3: Configure Data Rules
- Go to Machine Settings → Data Rules tab
- Locate Part Counting section
- Set Part Count Source to
part_count - Configure reset behavior:
- Reset on Program Start: Optional (depends on your process)
- Reset on Shift: Optional
- Click Save
Verifying Part Count
Step 1: Run a Test Part
- Load a program on the machine
- Run the program to completion
- Verify part counter increments on the control display
Step 2: Check MachineMetrics Data
- Go to machine page in MachineMetrics
- Navigate to Parts tab
- Verify part count matches control display
- Check that timestamp is accurate
Step 3: Check Diagnostics
- Go to Diagnostics tab
- Locate
part_countdata item - Verify value updates when part completes
- Check for consistent updates (no missed counts)
Step 4: Monitor Over Time
- Run multiple parts
- Verify count increments correctly
- Check for reset behavior (if configured)
- Confirm data is flowing to MachineMetrics Cloud
Troubleshooting Part Count Issues:
If parts are not counting correctly:
- Verify PLC WORD address is correct (double-check on control)
- Check M-code execution (review program for M53/M54)
- Verify Data Mapping settings in MachineMetrics
- Check adapter logs for errors or warnings
- Confirm part counter is enabled on the control
- Test manual increment on control (if possible)
Related Articles
- TNC 640 / TNC7 — the recommended path for any newer control
- Heidenhain Overview — identifying your control and its installed options
- Troubleshooting — connection, data collection and part count faults