MTConnect Connectivity Guide
- Overview
- Compatible Machines
- Prerequisites
- How MTConnect Works
- Verifying MTConnect Support
- Physical Connection
- Enabling MTConnect
- Adding the Machine in MachineMetrics
- Configuring Data Collection
- OEM-Specific Configurations
- Troubleshooting
- Best Practices
- Additional Resources
- Getting Help
Overview
Jump to: What is MTConnect? · Why MTConnect is Preferred · Who This Guide is For
What is MTConnect?
MTConnect is an open-source, royalty-free standard for collecting data from manufacturing equipment. Developed and maintained by the MTConnect Institute, this standard enables manufacturing equipment to provide data in structured XML format rather than proprietary formats.
MTConnect is one of the most commonly encountered standards that MachineMetrics uses to connect to machines worldwide.
Key Characteristics:
- Open and standardized protocol
- XML-based data format
- Industry-wide adoption
- No licensing fees
- Supported by major machine tool builders
Why MTConnect is Preferred
When a machine supports MTConnect, it's typically the preferred connectivity method because:
- Standardized: Consistent data format across different manufacturers
- Rich Data Set: Comprehensive machine status, alarms, programs, and production metrics
- Simple Setup: Often requires only network configuration
- No Additional Hardware: No serial converters or I/O modules typically needed
- Fast Deployment: Can usually connect in 20-45 minutes
- Industry Support: Continuously evolving with industry needs
Who This Guide is For
This guide is for:
- Manufacturing engineers connecting MTConnect-capable equipment
- IT personnel configuring network access for machines
- Maintenance staff enabling MTConnect on controls
- Quality engineers connecting CMM equipment
- Anyone responsible for machines with MTConnect capability
Compatible Machines
Jump to: Machine Tool Brands · Control Systems · CMM Equipment
Machine Tool Brands
Many well-known machine tool brands now include MTConnect as a standard or optional feature:
Common MTConnect-Enabled Brands:
- DMG MORI - Various controls
- Haas - Next Gen controls (port 8082)
- Hexagon - CMM and metrology systems
- Hurco - WinMax 10.4.0+ (mill) or 11.3.4+ (lathe)
- Mazak - Preview G, Smooth G, and Smart controls (other Mazak controls use Fusion Client)
- Okuma - OSP-P500, OSP 300, OSP 200, OSP 100-II
- Sodick - EDM and grinding machines
- Zeiss - CMM and metrology systems
- Many others - Check with your machine manufacturer
Control Systems
Mazak Controls (MTConnect only):
- Preview G, Smooth G, and Smart controls require MTConnect
- Other Mazak controls (Matrix, Nexus, Smooth, Preview 3, Fusion 640) use Mazak Fusion Client instead
- See Supported Mazak Control Models section
Okuma Controls:
- OSP-P500 (newer control, see OSP-P500 Setup)
- OSP 300 (best support)
- OSP 200 (requires THINC API update)
- OSP 100-II (requires THINC API update)
- Other OSP 100 controls: NOT supported
Hurco Controls:
- WinMax 10.4.0 or later (mills) - MTConnect included
- WinMax 11.3.4 or later (lathes) - MTConnect included
- Older WinMax versions - Requires Ultimonitor option
- Uses MTConnect version 1.3 schema
- Port 5000 (default)
Others:
- Varies by manufacturer
- Check machine documentation
- Contact MachineMetrics for verification
CMM Equipment
Hexagon CMMs:
- Metrology Connector V7.1 or higher (download from Hexagon Nexus)
- MTConnect Agent — open-source cppagent (GitHub)
- Advanced entitlement of Metrology Asset Manager (via Nexus account); Local Advanced entitlement supported for non-internet environments
- PC-DMIS (optional — only required for program name/cycle data)
Zeiss CMMs:
- CALYPSO 7.2 or newer
- PiWeb 8.x or newer
- Requires MTConnect Data Interface license
Other CMMs:
- Contact CMM manufacturer for MTConnect support
- May require software updates or licenses
Prerequisites
Before connecting your MTConnect machine, ensure you have:
Hardware:
- Machine with MTConnect capability (verified)
- MachineMetrics Edge device (deployed and activated)
- Ethernet cable (CAT5/CAT6)
- Network access between machine and Edge device
Network:
- IP address for the machine
- Knowledge of MTConnect agent port (typically 5000, or 8082 for Haas)
- Firewall access for MTConnect agent port
- Ability to test connectivity (ping, browser)
Access:
- Physical access to machine control
- Permission to enable MTConnect (if not already enabled)
- Administrative access to Windows backend (for Mazak, Okuma)
Information:
- Machine make, model, and control type
- Control software version
- Current network configuration
For CMMs:
- MTConnect license (Hexagon or Zeiss)
- CMM software version
- Administrator permissions on CMM PC
How MTConnect Works
Jump to: Architecture · Data Flow · Ports and Endpoints
Architecture
MTConnect uses a client-server architecture:
Machine Control
     ↓
MTConnect Adapter (converts machine data to SHDR format)
     ↓
MTConnect Agent (serves XML data via HTTP)
     ↓
MachineMetrics Edge Device (ingests and processes data)
     ↓
MachineMetrics Cloud
Components:
- Adapter: Translates machine-specific data to SHDR (Simple Hierarchical Data Representation)
- Agent: HTTP server that provides XML data streams
- Client: MachineMetrics Edge device that consumes the data
Data Flow
- Machine control generates operational data
- MTConnect Adapter reads this data
- Adapter converts data to SHDR format
- Agent receives SHDR and converts to XML
- Edge device polls the Agent's HTTP endpoint
- Edge processes and sends data to MachineMetrics Cloud
Ports and Endpoints
Common MTConnect Ports:
- 5000: Agent port (most common default)
- 7878: Adapter port (Mazak and some others)
- 8082: Agent port (Haas Next Gen)
- Custom: Some implementations use different ports
Note: MTConnect uses two types of ports:
- Agent ports (e.g., 5000, 8082) - External HTTP endpoint for data collection - Test with web browser
- Adapter ports (e.g., 7878) - Internal connection between adapter and agent - Test with telnet
Testing Adapter Ports:
To test if an adapter is running on port 7878, use telnet (not a web browser):
telnet <machine-ip> 7878
Example:
telnet 192.168.1.100 7878
If the adapter is running, you should see streaming data. If it doesn't connect, the adapter service is not running.
Common Endpoints:
/probe- Returns agent configuration and available data items/current- Returns current values for all data items/sample- Returns historical time-series data/assets- Returns asset information (tools, fixtures, etc.)
Example URLs:
http://192.168.1.100:5000/probehttp://192.168.1.100:5000/currenthttp://192.168.1.100:8082/sample(Haas)
Verifying MTConnect Support
Jump to: Quick Test Method · Control-Specific Checks
Quick Test Method
Follow these steps to check if your machine produces MTConnect data:
Step 1: Ensure Network Connection
- Connect machine to network via Ethernet
- Configure static IP address on machine
- Note the IP address (e.g., 192.168.1.100)
Step 2: Test Connectivity
- From a computer on the same network
- Open Command Prompt or Terminal
- Ping the machine:
ping 192.168.1.100 - Verify you receive replies
Step 3: Test MTConnect Endpoint
- Open a web browser
- Try these URLs (replace IP with your machine's IP):
http://192.168.1.100:5000http://192.168.1.100:8082(Haas only)
- Add
/currentto the URL for current data - If you see XML data, MTConnect is working!
Step 4: Verify on Control (Windows-Based)
For machines with Windows backend (Mazak, Okuma):
- Access Windows backend on the machine control
- Open browser on the control
- Navigate to
http://127.0.0.1:5000orhttp://127.0.0.1:7878 - Or try
http://localhost:5000/current - If data appears here but not from external PC: firewall issue
What Success Looks Like:
You should see XML output similar to:
<?xml version="1.0" encoding="UTF-8"?>
<MTConnectStreams ...>
  <DeviceStream name="Machine1">
    <ComponentStream component="Controller">
      <Samples>
        <Execution>READY</Execution>
        ...
If No Data Appears:
- MTConnect may not be enabled
- Port may be different
- Firewall may be blocking access
- Software upgrade may be needed
Control-Specific Checks
For Mazak:
- Access Windows backend (click Start button)
- Search for "MTConnect"
- Look for MTConnect folder with associated files
- If found: MTConnect is installed
- If not found: Contact Mazak for installation files
For Okuma:
- Access Windows backend (press CTRL + ///)
- Use Scout tool at MyOkuma.com to check compatibility
- Navigate to Programs → Okuma → MTConnect
- If present: MTConnect is installed
- Check THINC API version (may need update)
For Hexagon CMMs:
- Confirm Metrology Connector V7.1+ is installed on the CMM control PC
- Verify the Advanced entitlement of Metrology Asset Manager is active in your Nexus account
- Confirm the MTConnect Agent (cppagent) is running and listening on port 5001
Physical Connection
Jump to: Network Setup · Wired vs Wireless
Network Setup
Step 1: Connect Ethernet Cable
- Plug cable into machine's Ethernet port
- For Mazak: Port typically patched from HMI to electrical cabinet
- For Okuma: Port on control panel or in cabinet
- For CMMs: Network port on CMM PC
Step 2: Configure IP Address
Static IP (Recommended):
- Access network settings on machine or control PC
- Set static IP address
- Example: 192.168.1.100
- Subnet: 255.255.255.0
- Gateway: 192.168.1.1 (if needed)
⚠️ For Mazak:
- Configure "PC IP Address" (Windows Ethernet settings)
- DO NOT change the "NC IP Address" - this is for internal machine control communication
For Okuma:
- Press CTRL + /// to access Windows
- Configure Ethernet adapter settings
- Set static IP
For CMMs:
- Standard Windows network configuration
- Use static IP for reliability
Step 3: Verify Network Access
- Ensure machine IP and Edge device are on same subnet
- Test with ping from Edge device or computer
- Verify firewall allows MTConnect port
Wired vs Wireless
Wired Connection (Typical):
- Direct Ethernet cable from network to machine
- Most reliable for MTConnect
- Lower latency
- Preferred for production environments
Wireless Connection:
- Edge device with WiFi in machine cabinet
- Edge connects via Ethernet to machine
- Edge communicates to cloud via WiFi
- Useful when cabling is impractical
Enabling MTConnect
Jump to: Generic MTConnect Setup · Mazak-Specific Setup · Okuma-Specific Setup · Okuma OSP-P500 Setup · Hexagon CMM Setup · Zeiss CMM Setup · Hurco-Specific Setup
Generic MTConnect Setup
For machines that already have MTConnect installed:
Step 1: Locate MTConnect Service
- Access Windows backend on control
- Search for MTConnect application or service
- Common locations:
- Start Menu → Programs → MTConnect
- Windows Services → "MTConnect Agent" or similar
Step 2: Verify Service is Running
- Open Services (services.msc)
- Find MTConnect service
- Status should be "Running"
- If not running: Right-click → Start
Step 3: Configure Network Port
- Open MTConnect configuration utility
- Verify HTTP port (typically 5000 or 7878)
- Ensure port is not blocked by firewall
Step 4: Test Locally
- On the machine control, open browser
- Navigate to
http://localhost:5000/current(or your port) - Verify XML data appears
Step 5: Test Externally
- From another computer on network
- Navigate to
http://[machine-ip]:5000/current - If this fails but local test works: firewall issue
Mazak-Specific Setup
Important: Not all Mazak machines require MTConnect. See the Mazak Connectivity Guide to determine which connection method is appropriate for your machine.
Recommendation:
- If MTConnect is NOT already installed: Use Mazak Fusion Client instead (recommended)
- If MTConnect is already installed: You may continue to use MTConnect
Checking for MTConnect:
-
Access Windows Backend
- Click Windows Start button on Mazak control
- The control uses Windows as the OS
-
Search for MTConnect
- Click Start → Search
- Type "MTConnect"
- Look for MTConnect folder
-
Verify Installation
- MTConnect folder should contain:
- Adapter executable
- Agent executable
- Configuration files
- If not found: MTConnect needs to be installed
- MTConnect folder should contain:
Installing MTConnect (if needed):
-
Contact Mazak
- Mazak provides MTConnect on a thumb drive
- Each machine requires individual license file
- Request one thumb drive per machine
- Mazak provides installation instructions
-
Supported Control Models
- See Mazak-Specific Section for detailed compatibility chart
- Generally 2010 or newer controls support MTConnect
- Smooth and Matrix control families
Network Configuration:
-
Locate Ethernet Port
- Port usually patched from HMI
- Cable runs to keystone in main electrical cabinet
- Connected to shop network
-
Configure PC IP Address
- Access Windows network settings
- Configure Ethernet adapter
- Set static IP address
- WARNING: Do NOT change NC IP Address!
-
Default MTConnect Port
- Mazak agent typically uses port 5000
- Mazak adapter typically uses port 7878 (internal)
- Verify in MTConnect configuration
Starting MTConnect Service:
- Access Control Panel → Administrative Tools → Services
- Find "Mazak MTConnect" or similar service
- Ensure Status = "Running"
- If not: Right-click → Start
Okuma-Specific Setup
Compatibility Check:
-
Determine Control Type
- OSP 300: Best MTConnect support
- OSP 200: Requires THINC API update + MTConnect
- OSP 100-II: Requires THINC API update + MTConnect
- Other OSP 100: NOT supported
-
Use Scout Tool
- Visit MyOkuma.com
- Use Scout tool to verify compatibility
- Tool will indicate if updates are needed
-
Check Compatibility Chart
Accessing Windows:
- Press CTRL + /// to access Windows Start button
- From here you can access File Explorer, applications, etc.
Installing/Updating MTConnect:
-
Check Current Installation
- Press CTRL + ///
- Navigate to Programs → Okuma → MTConnect
- If not present: needs installation
-
Install from THINC App Store
- OSP 300: Install directly from THINC App Store
- Download MTConnect Agent/Adapter
- Follow on-screen installation prompts
-
Update THINC API (if needed)
- OSP 200 and OSP 100-II require THINC API update first
- Must be done by Okuma dealer
- Contact your dealer for this service
Enable Monitoring Tags:
⚠️ Critical Step: Even with MTConnect installed, monitoring must be enabled.
- Press CTRL + /// (access Windows)
- Select Programs → Okuma → Okuma MTConnect Adapter Application
- Enter credentials:
- Username:
Administrator - Password:
okuma+osp
- Username:
- Select Configuration tab
- Click Tags Configuration button
- Check "Enable Monitoring Tags"
- Verify data items you want to monitor are also checked
- Click Save & Close
- Restart machine for changes to take effect
Enabling Macro Variable Monitoring:
The Configurations tab also controls which common (macro) variables the adapter exposes over MTConnect. This is required if you need part counting via common variables or any other program-driven variable data.
- On the Configuration tab, locate the Common Variable Starting/Ending Index fields at the top of the screen
- Enter the starting index of the variable range you want to monitor (e.g.,
500) - Enter the ending index of the range (e.g.,
520) - Click Save & Close
Set the range as narrow as possible — only include the variables actually used by your programs. A range like 500–520 is typical for part counting setups.
If you are using a common variable for part counting (e.g., VC500), the variable index must fall within this range or MachineMetrics will not be able to read it.
If the Common Variable Starting/Ending Index fields or the Tool Assets checkbox are not visible on the Configurations tab, your version of the Okuma MTConnect Adapter is outdated. Download and install the latest version from MyOkuma.com to access these options.
Port Configuration:
- Okuma typically uses port 5000
- Verify in MTConnect configuration utility
Part Counting:
See Okuma Part Counting section for configuring common variables if automatic counting doesn't work.
Okuma OSP-P500 Setup
The OSP-P500 is a newer Okuma control with a different navigation path than older OSP controls. MTConnect is built in — no THINC App Store installation needed.
Protocol: MTConnect | Default Port: 5000 | URL: http://<machine_ip>:5000/current
Prerequisites:
- Ethernet cable connected from the machine control to the customer's network
- Network IP address or DHCP information from the customer's IT team
- Machine serial number
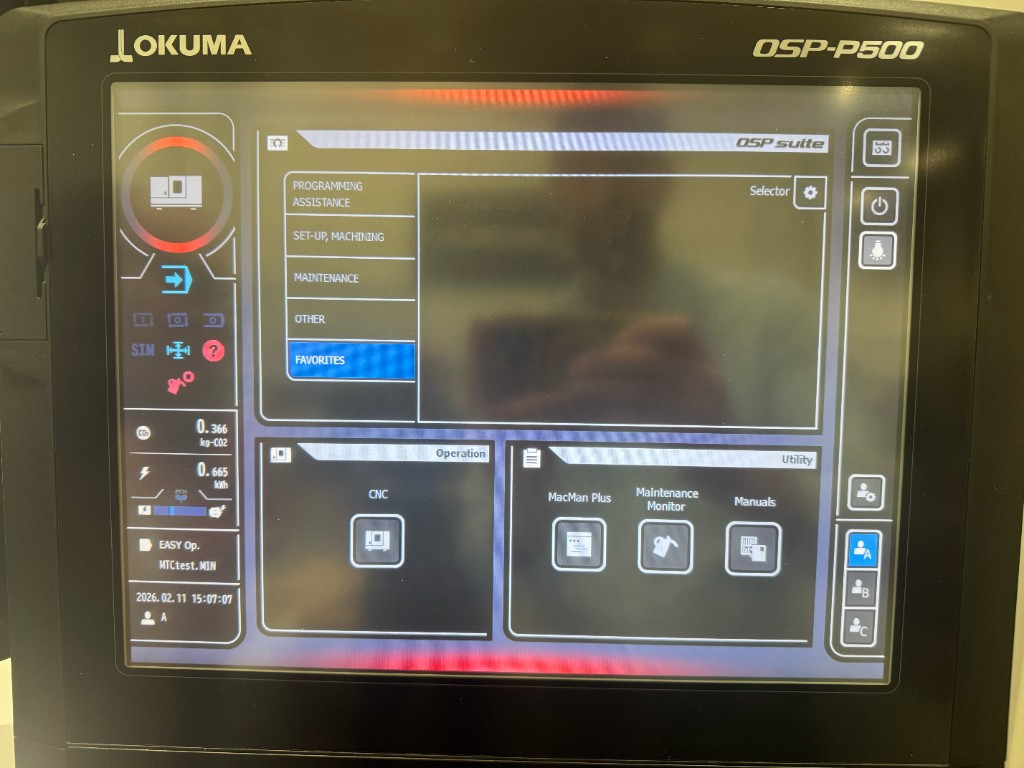
Step 1: Access the CNC Screen
From the machine homepage (OSP Suite), press CNC in the lower-left Operation panel to open the conventional CNC operation screen.
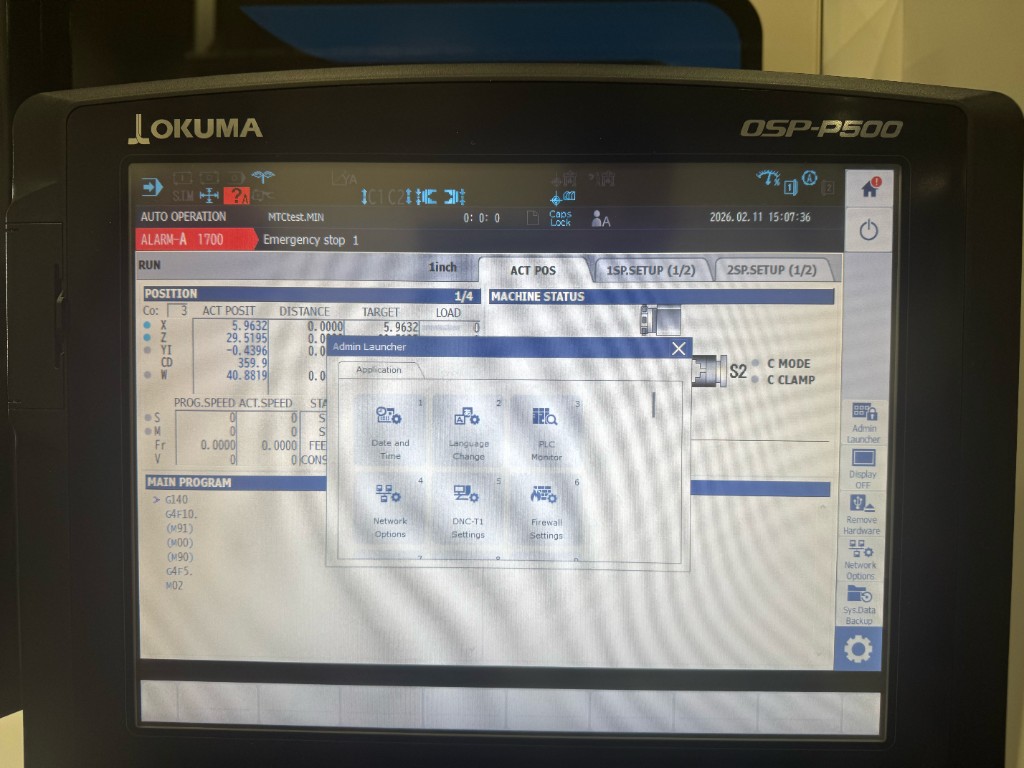
Step 2: Open Admin Launcher
- On the CNC screen, locate the puzzle piece icon in the lower-right sidebar
- Tap it to open the utility menu
- Tap the gear icon (⚙) to open settings
- Select Admin Launcher
The Admin Launcher window will open with configuration options including Date and Time, Language Change, PLC Monitor, Network Options, DNC-T1 Settings, and Firewall Settings.
Step 3: Configure the Network / IP Address
- In the Admin Launcher, select Network Options (item 4)
- Select the Network Interface
- The Windows Internet Protocol (TCP/IP) Settings page will appear
- Configure the IP address:
- DHCP: Select "Obtain an IP address automatically"
- Static IP: Enter the IP address, subnet mask, and default gateway provided by the customer's IT team
- Click OK and close the network settings
The machine must be on the same network/subnet as the MachineMetrics Edge device, or have a route configured between them.
Step 4: Verify Firewall Settings
The OSP-P500 has a built-in firewall (OSP-FIREWALL) that controls which protocols can communicate with the control. MTConnect must be enabled here.
- In the Admin Launcher, select Firewall Settings (item 6)
- The OSP-FIREWALL screen will open showing the list of firewall rules
- Confirm MTConnect-Agent is checked/enabled in the rules list
- If it is not enabled, check the box and press Apply
- Press Quit to close
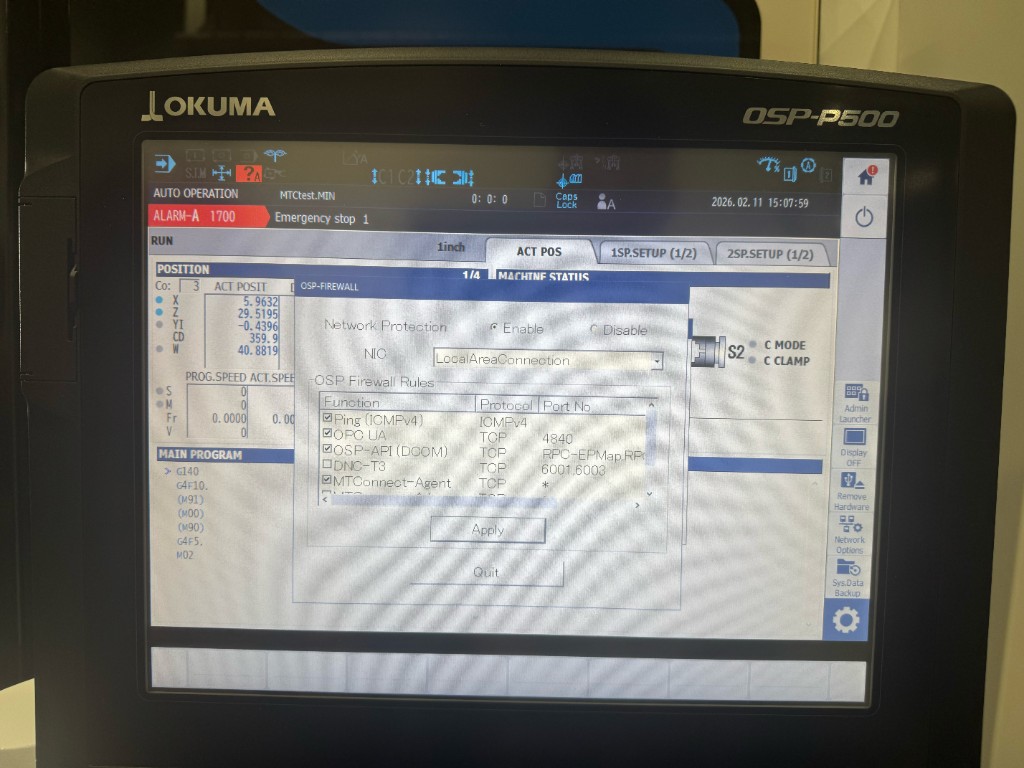
The firewall screen also shows OPC UA (TCP, port 4840) as a separate rule. If you are setting up OPC-UA on the same machine, ensure that rule is also enabled.
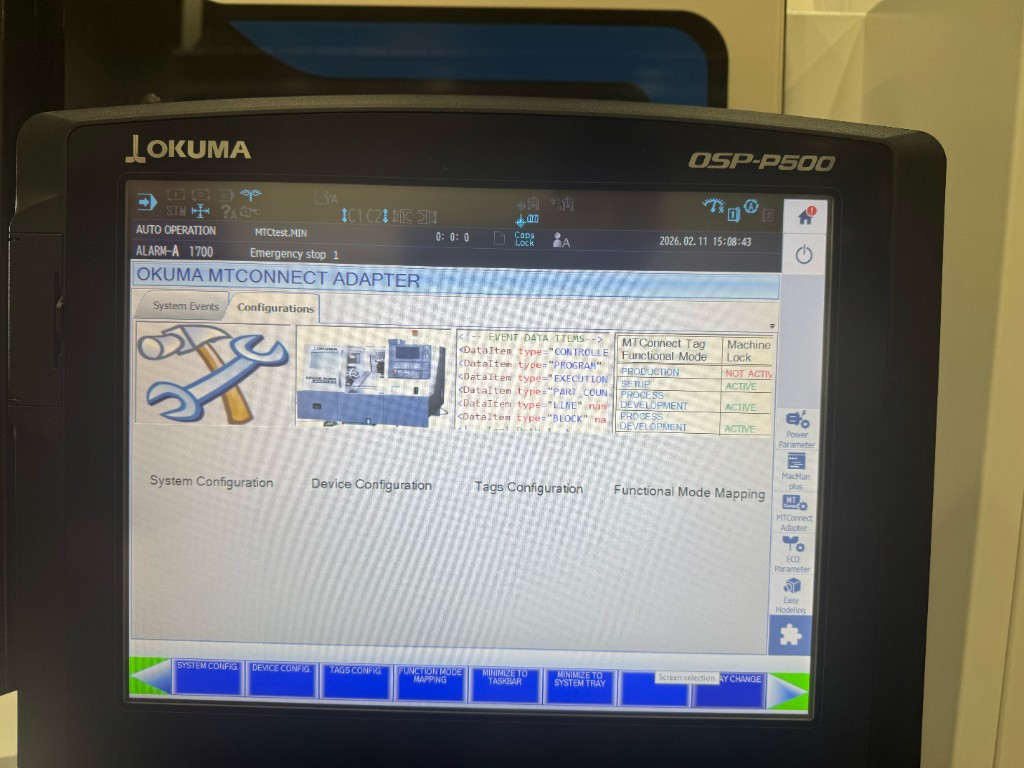
Step 5: Open the MTConnect Adapter
- Tap the puzzle piece icon again from the CNC screen
- From the utility menu on the right side, select MTConnect Adapter
- The Okuma MTConnect Adapter window opens on the Configurations tab, showing four sections:
- System Configuration
- Device Configuration
- Tags Configuration
- Functional Mode Mapping
Step 6: Update Device Configuration
- Select Device Configuration (or press the DEVICE CONFIG. softkey at the bottom)
- Update the following fields:
- Serial Number — Enter the machine's serial number
- Device Name — Enter a name for the machine
- Description — Enter a description that uniquely identifies this machine (e.g., make, model, location)
- Confirm the changes
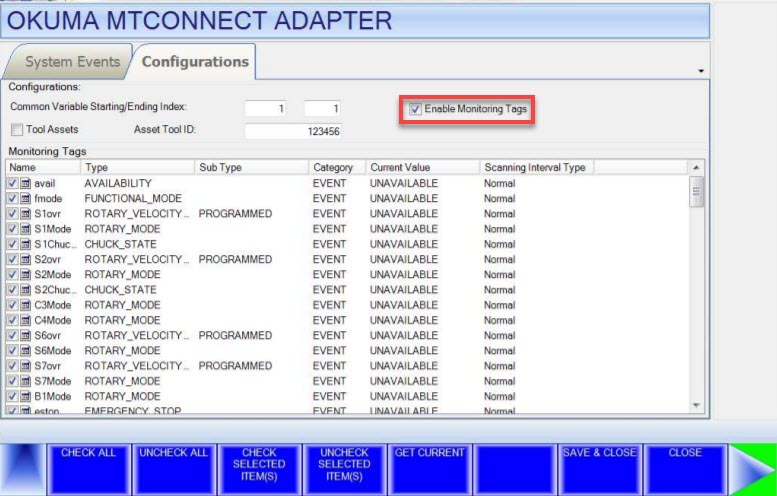
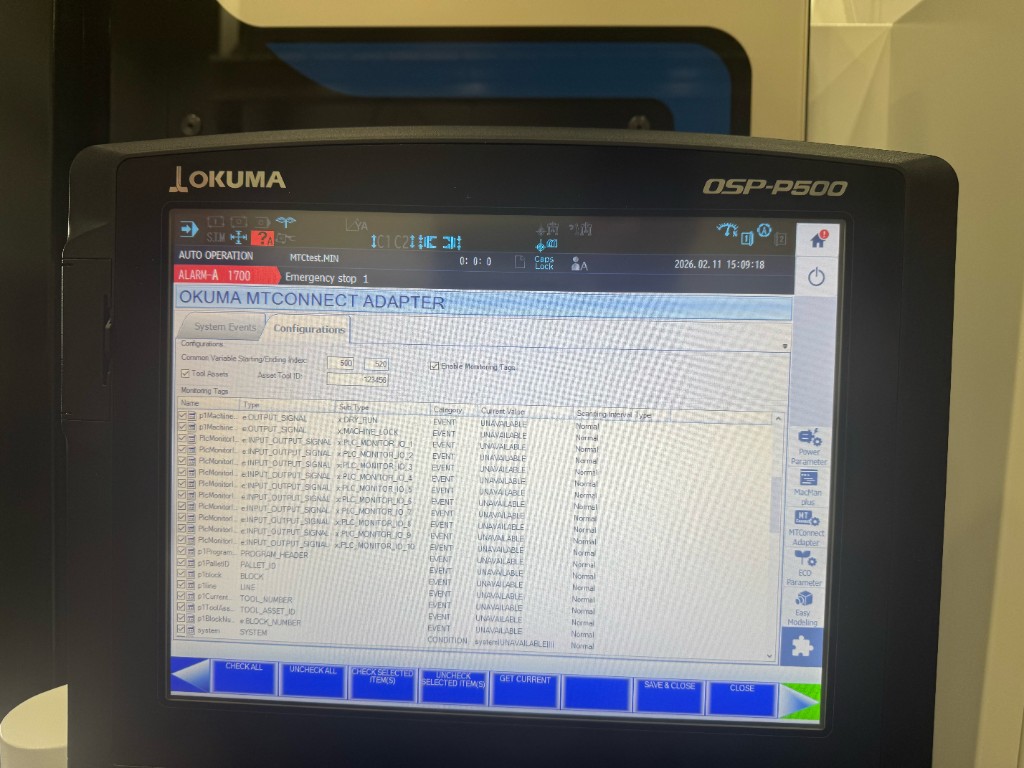
Step 7: Configure Monitoring Tags
Without "Enable Monitoring Tags" checked, all tag values will report as UNAVAILABLE.
- Select Tags Configuration (or press the TAGS CONFIG. softkey)
- ☑ Check Enable Monitoring Tags at the top of the screen
- ☑ Optionally check Tool Assets if tool asset data is required — enter the Asset Tool ID if applicable
- Set the Common Variable Starting/Ending Index range if the customer's programs use common variables (e.g., 500–520)
- Ensure relevant tags are checked. Key tags include:
| Tag | Type | Description |
|---|---|---|
| DRY_RUN | OUTPUT_SIGNAL | Dry run status |
| MACHINE_LOCK | OUTPUT_SIGNAL | Machine lock status |
| PLC_MONITOR_IO_1–10 | INPUT_OUTPUT_SIGNAL | PLC I/O signals |
| PROGRAM_HEADER | PROGRAM_HEADER | Active program info |
| PALLET_ID | PALLET_ID | Pallet identifier |
| BLOCK | BLOCK | Current block |
| LINE | LINE | Current line number |
| TOOL_NUMBER | TOOL_NUMBER | Active tool number |
| TOOL_ASSET_ID | TOOL_ASSET_ID | Tool asset reference |
| BLOCK_NUMBER | BLOCK_NUMBER | Block count |
| SYSTEM | SYSTEM | System condition |
Step 8: Save and Close
- Press SAVE & CLOSE (softkey at the bottom right)
- The MTConnect adapter reinitializes with the new configuration
- Press MINIMIZE TO SYSTEM TRAY — the adapter continues running in the background
Verification
- Open a browser on the machine control
- Navigate to
http://localhost:5000/current - You should see XML output with current machine data items
- From a remote machine on the same network, navigate to
http://<machine_ip>:5000/currentto confirm network accessibility
If all values show as UNAVAILABLE:
- Confirm "Enable Monitoring Tags" is checked
- Restart the MTConnect adapter: on OSP-P500, reopen it via CNC → Puzzle Icon → MTConnect Adapter; on Windows-based controls (OSP 300 / 200 / 100-II), close and reopen from Start → Programs → Okuma → MTConnect Adapter
- If the issue persists, restart the machine control
If the page does not load remotely:
- Check that Windows Firewall allows inbound traffic on port 5000
- Verify network connectivity between the Edge device and the machine
Quick Reference — OSP-P500
| Item | Value |
|---|---|
| Protocol | MTConnect |
| Default Port | 5000 |
| URL Format | http://<ip>:5000/current |
| Admin Launcher Path | CNC → Puzzle Icon → Gear → Admin Launcher |
| MTConnect Adapter Path | CNC → Puzzle Icon → MTConnect Adapter |
| Critical Setting | ☑ Enable Monitoring Tags |
Hexagon CMM Setup
For full setup instructions from Hexagon, refer to the Metrology Asset Manager MTConnect Guide on Hexagon Nexus.
How It Works
Hexagon's MTConnect implementation uses two components:
| Component | What It Is | Runs On |
|---|---|---|
| MTConnect Adapter | Built into Metrology Connector. Reads CMM data and sends it to the Agent | CMM control PC |
| MTConnect Agent | Open-source app (cppagent). Receives data from the Adapter and serves it over HTTP | CMM control PC or external PC |
MachineMetrics connects to the MTConnect Agent HTTP endpoint (port 5001 by default).
In standard MTConnect, port 7878 is the internal TCP port the Agent uses to communicate with the Adapter — it is not an HTTP client endpoint. If you have been connecting MachineMetrics at port 7878, confirm with your MachineMetrics engineer as this may depend on your specific Edge configuration.
Prerequisites:
- Nexus account (sign up at nexus.hexagon.com)
- Advanced entitlement (or Local Advanced entitlement) of Metrology Asset Manager
- Metrology Connector V7.1 or higher installed on the CMM control PC
- Network access between the Agent PC and MachineMetrics Edge
- PC-DMIS installed on the CMM PC (optional — only required if you need program name/cycle data)
Setup Steps:
Part 1: Configure the MTConnect Adapter in Metrology Connector
- Sign in to your Nexus account, download and install Metrology Connector from User Menu → User Preferences → Downloads
- Open Metrology Connector and click the Settings icon (large gear, upper right)
- Under Service and interfaces, click the MTConnect Adapter tab
- Check the checkbox next to your CMM asset (must already be upgraded to Advanced)
- Toggle on Interface Enabled in the Advanced Settings
- Note the port number shown — this is what the Agent will connect to (default is typically 7878). It can be changed, but must match the
agent.cfgfile - Click Save Changes
Part 2: Set Up the MTConnect Agent
- Download the MTConnect Agent (cppagent) from GitHub: https://github.com/mtconnect/cppagent/releases
- Unzip the downloaded archive to a folder on your C drive (for example,
C:\Users\Public\Downloads\mtconnect-agent\). The exact folder name may vary depending on the version you downloaded. - Edit
agent.cfgin thebinsubfolder of the folder you extracted (for example,C:\Users\Public\Downloads\mtconnect-agent\bin\agent.cfg)- Ensure the adapter port in this file matches what was set in Step 6 above
- Open a command window in the
binfolder (typecmdin the folder path bar, press Enter) - Run:
agent.exe debug - The Agent is now running
Part 3: Test and Connect
- In a browser on the Agent PC, navigate to
http://127.0.0.1:5001/current - You should see MTConnect XML data
- Provide the Agent PC's IP and port 5001 to MachineMetrics for Edge configuration
Data Flow:
- CMM control PC runs Metrology Connector with MTConnect Adapter enabled
- Adapter sends CMM data to the MTConnect Agent (internal connection)
- Agent serves data over HTTP at
http://[Agent-PC-IP]:5001/current - MachineMetrics Edge polls the Agent endpoint and ingests data
Zeiss CMM Setup
Prerequisites:
- CALYPSO 7.2+ installed and licensed
- Zeiss MTConnect Data Interface license
- Windows 10/11 64-bit PC
- Network access to MachineMetrics Edge
- Administrator permissions on controller PC
Installation Steps:
-
Obtain Installer
- Request from Zeiss support representative
- Or download from Zeiss Portal account
- Free 60-day trial available
-
Run Installer
- Execute as Administrator on CMM PC
- Accept default path:
C:\Program Files\Zeiss\MTConnectAdapter
-
Activate License
- Open Zeiss License Manager
- Import MTConnect entitlement file
- Verify "MTConnect Interface" shows as "Licensed"
-
Configure Adapter
- Launch "MTConnect Configuration Utility"
- Set machine name
- Set HTTP port (default 5000 or 5001)
- Configure CALYPSO data path
- Click "Apply and Start Service"
-
Test Locally
- On CMM PC, open browser
- Navigate to
http://localhost:5000/current - Should see XML output with MTConnect data
Data Items Available:
- Machine status (Idle / Measuring / Alarm)
- Current part program name
- Measurement count and cycle time
- Operator ID (if configured)
Hurco-Specific Setup
Overview:
Hurco machines use the MTConnect protocol to retrieve manufacturing data directly from WinMax on the control. The MTConnect adapter is available for download and installation.
Important: Hurco provides data through the MTConnect protocol but does not provide a GUI interface to display the data. Ensure any third-party applications (including MachineMetrics) check against MTConnect version 1.3 scheme.
Prerequisites:
- WinMax Version Requirements:
- Mill: WinMax 10.4.0 or later (MTConnect available without Ultimonitor)
- Lathe: WinMax 11.3.4 or later (MTConnect available without Ultimonitor)
- Older versions: Require Ultimonitor option to use MTConnect
- Administrator access to Hurco control
- Network connectivity between machine and Edge device
Installing the MTConnect Adapter:
-
Download MTConnect Adapter
- Download from Hurco MTConnect download page
- Password:
mtconnect
-
Access Service Menu
- Select Windows key or Hurco icon button on control
- Select the Service softkey
- Enter password:
46268 - Click OK
-
Enable Drive Access
- In Hurco Service Window, select Toggle Drive Access On
- Button will change to read "Toggle Drive Access Off"
-
Open File Explorer
- In Hurco Service Window, select Open Explorer
- Close the Hurco Service Window (click X in upper right)
-
Run Installer
- Search for MTConnect install package in File Explorer
- Select Run to launch installer
- Check box to accept License Agreement terms
- Click Install button
- Click Finish after successful installation
Verifying Installation:
Method 1: Using Internet Explorer
- Access Shell menu (Windows key or Hurco icon)
- Select Run softkey
- Enter password:
46268 - Enter
iexplorein Run window and click OK - Enter
http://127.0.0.1:5000/currentin address bar - Press Enter
- Verify: Machine data should display in XML format
- If data appears, MTConnect adapter is running correctly
Method 2: Using Task Manager
- Access Service menu (password:
46268) - Enable Drive Access
- Select Task Manager
- Close Hurco Service Window
- Select Processes tab
- Verify: Look for these processes:
agent.exeMTConnectAdapter.exe- If both are running, adapter is working
Port Configuration:
- Default Port: 5000
- Test URL:
http://127.0.0.1:5000/current(local) - External URL:
http://[MACHINE-IP]:5000/current(from network)
Data Items Available from Hurco:
Hurco MTConnect provides the following data:
| Data Item | Description |
|---|---|
| Status & Control | |
| EStop_State | Emergency stop status |
| Feed_Hold | Feed hold status |
| Controller_Mode | Current controller mode |
| Machine_Mode | 0=Diagnostic, 1=Idle, 2=Manual, 3=Manual Setup, 4=Auto Prep, 5=Auto Run, 6=Interrupt Cycle |
| COR_Status | Corner rounding status |
| Program Info | |
| Program_Name_Running | Active program name |
| Program_Name_Editing | Program being edited |
| Program_Status | Current program status |
| Block_Number | Current block number |
| Program_Runtime_Seconds | Program runtime |
| Part_Count | Part counter |
| Spindle & Feed | |
| Spindle_Speed | Current spindle speed |
| Spindle_Override | Spindle override percentage |
| Spindle_Time | Total spindle run time |
| S_Axis_Load | Spindle load |
| Feed_Rate | Current feed rate |
| Feed_Override | Feed override percentage |
| Rapid_Override | Rapid override percentage |
| Rapid_Speed | Rapid traverse speed |
| Tooling | |
| Current_Tool | Active tool number |
| Positioning | |
| X_Position, Y_Position, Z_Position | Axis positions |
| A_Position, B_Position, C_Position | Rotary axis positions |
| W_Position | W axis position |
| Axis Loads | |
| X_Axis_Load, Y_Axis_Load, Z_Axis_Load | Linear axis loads |
| A_Axis_Load, B_Axis_Load, C_Axis_Load | Rotary axis loads |
| W_Axis_Load | W axis load |
| Other | |
| Machine_Time | Total machine time |
Troubleshooting Hurco MTConnect:
Problem: Cannot access http://127.0.0.1:5000/current
Solutions:
- Verify MTConnect adapter is installed
- Check Task Manager for
agent.exeandMTConnectAdapter.exeprocesses - If processes not running:
- Restart machine
- Reinstall MTConnect adapter
- Check Windows Firewall settings (port 5000 must be allowed)
Problem: Local test works but external access fails
Solutions:
- Verify machine IP address
- Ping machine from Edge device or computer
- Check network connectivity
- Verify Windows Firewall allows external connections on port 5000
- Check if machine is on same network/VLAN as Edge device
Problem: Wrong WinMax version
Solution:
- If WinMax is older than 10.4.0 (mill) or 11.3.4 (lathe):
- Option 1: Upgrade WinMax to supported version
- Option 2: Purchase and install Ultimonitor option
- Contact Hurco support for upgrade options
Adding Hurco to MachineMetrics:
After verifying MTConnect is running:
- In MachineMetrics, go to Assets → Machines
- Click Add Machine
- Enter machine details:
- Machine Name: (e.g., "Hurco VM10i")
- Make: Hurco
- Model: (e.g., "VM10i")
- Edge Device: Select your Edge
- Select adapter type: MTConnect Agent
- Enter connection details:
- Connection address:
[MACHINE-IP]:5000 - Example:
192.168.1.100:5000
- Connection address:
- Click Test Connection
- If successful, click Save
Additional Resources:
- Hurco MTConnect Installation Guide
- Hurco Support: Contact your Hurco dealer
- MTConnect Version 1.3 Schema: mtconnect.org
Adding the Machine in MachineMetrics
Once MTConnect is enabled and verified:
Step 1: Log into MachineMetrics
- Navigate to Assets → Machines
- Click Add Machine
Step 2: Enter Machine Details
- Machine Name: Descriptive name (e.g., "Mazak-Mill-1")
- Make: Manufacturer (e.g., "Mazak", "Okuma")
- Model: Machine model
- Select Edge Device: Choose your Edge from dropdown
Step 3: Configure Adapter
- Adapter Type: Select MTConnect
- IP Address: Enter machine's IP address
- Port: Enter MTConnect agent port
- 5000 (most common agent port)
- 8082 (Haas agent port)
- Note: 7878 is typically the adapter port, not the agent port
- Device Name: Leave blank unless multi-machine agent (see below)
- Click Test Connection
Step 4: Verify Connection
- Test should return "Connected" or success message
- If test fails:
- Verify IP address is correct
- Verify port is correct
- Test endpoint in browser first
- Check firewall settings
- Click Save when test succeeds
Step 5: Configure Data Collection
- Machine will appear in Machines list
- Initial data items collected automatically
- Configure part counting if needed
- Map additional data items as required
Configuring Data Collection
Jump to: Available Data Items · Part Counting · Multi-Machine Agents
Available Data Items
MTConnect provides rich data depending on machine implementation:
Status & Mode:
- Execution state (READY, ACTIVE, INTERRUPTED, STOPPED)
- Controller mode (AUTOMATIC, MANUAL, MDI, etc.)
- Emergency stop status
- Door state
Program Information:
- Program name
- Active block
- Line number
Production Metrics:
- Part count (varies by implementation)
- Cycle time
- Run time
- Idle time
Machine Parameters:
- Spindle speed (actual and override)
- Spindle load
- Feed rate (actual and override)
- Axis positions
- Axis loads
Alarms & Messages:
- Active alarms with codes
- Warning messages
- Operator messages
Tool Data (if available):
- Tool number
- Tool life
- Tool changes
Quality Data (CMMs):
- Measurement results
- Part program execution
- Inspection cycle data
Part Counting
Automatic Part Counting (Most Machines):
- MTConnect often provides part count automatically
- Counted based on program execution cycles
- No additional configuration needed
- Verify count is incrementing correctly in MachineMetrics
Manual Configuration (If Needed):
For Okuma (Common Variables):
If automatic counting doesn't work:
-
On Okuma Control:
- Open MTConnect application
- Navigate to "Device Configuration" page
- Select common variable for part count (e.g., VC1)
-
In CNC Program:
- Add common variable increment near end of program
- Example:
VC1=VC1+1(increments by 1) - Example:
VC1=VC1+2(increments by 2 parts)
-
Notify MachineMetrics:
- Contact support with variable number used
- Configuration will be matched on our end
For Other Machines:
- Check MTConnect documentation for part count data item
- May be labeled "PartCount", "GoodCount", or similar
- Configure in MachineMetrics data mapping if not automatic
Multi-Machine Agents
Some MTConnect Agents report data for multiple machines over the same IP address and port.
Identifying Multi-Machine Setup:
- Browse to
http://[IP]:[PORT]/probe - Look for multiple
<Device>entries in XML - Each device will have a unique name
Configuration:
To collect data from a specific machine in a multi-machine agent:
- In MachineMetrics, when adding the machine
- Append device name to Connection Address
- Format:
[IP]:[PORT]/[DeviceName] - Example:
192.168.1.100:5000/Machine_1
In XML, look for:
<MTConnectDevices>
  <Devices>
    <Device name="Machine_1" ...>
    <Device name="Machine_2" ...>
Use the exact name from the XML, including underscores and capitalization.
OEM-Specific Configurations
Jump to: Mazak · Okuma · Hexagon CMMs · Zeiss CMMs · 3D Systems DMP 350 Flex · Other MTConnect Machines
Mazak
Important: Only certain Mazak machines require MTConnect. See the Mazak Connectivity Guide to determine the correct connection method for your specific control type.
Which Mazak controls use MTConnect:
The following controls require MTConnect and cannot use the Fusion Client:
- Preview G
- Smooth G
- Smart
All other Mazak controls (Fusion 640, Matrix, Nexus, Preview 3, Smooth/SmoothX/SmoothAi) should connect using the Mazak Fusion Client instead. If MTConnect is already installed and working on one of those controls, it is fine to continue using it.
Contact Mazak or refer to your machine documentation if you are unsure which control type you have.
Installation Process:
-
Check if Installed
- Access Windows on control
- Search for MTConnect folder
- If found: proceed to configuration
- If not found: contact Mazak
-
Request from Mazak
- Mazak provides MTConnect on USB thumb drive
- Each machine needs individual license
- Order separate thumb drive for each machine
- Includes installation files and instructions
-
Install from Thumb Drive
- Follow Mazak-provided instructions
- Installation includes:
- MTConnect Adapter
- MTConnect Agent
- License file (machine-specific)
- Configuration files
Network Configuration:
- Configure "PC IP Address" in Windows network settings
- DO NOT modify "NC IP Address" (internal machine communication)
- Default agent port: 5000 (or check MTConnect configuration)
- Default adapter port: 7878 (internal connection)
Service Management:
- Service name: "Mazak MTConnect" or similar
- Location: Control Panel → Services
- Ensure set to "Automatic" startup
- Verify "Running" status
Common Issues:
- Service fails to restart after power cycle
- See Troubleshooting section
Okuma
Supported Controls:
| Control | MTConnect | Notes |
|---|---|---|
| OSP-P500 | Built-in | See OSP-P500 Setup for full walkthrough |
| OSP 300 | Install from App Store | Best support, easy self-install |
| OSP 200 | Install from App Store (after THINC API update) | Contact Okuma dealer for API update first |
| OSP 100-II | Install from App Store (after THINC API update) | Contact Okuma dealer for API update first |
| Other OSP 100 | Not Available | Use I/O integration instead |
Compatibility Verification:
- Use Scout tool at MyOkuma.com
- Full compatibility chart: MyOkuma MTConnect Page
Installation for OSP 300:
- Access THINC App Store
- Search for "MTConnect"
- Download and install MTConnect Agent/Adapter
- Follow on-screen instructions
- Configuration happens automatically
Installation for OSP 200 / OSP 100-II:
- First: Contact Okuma dealer for THINC API update
- Then: Install MTConnect from THINC App Store
- Both steps required for these controls
Enabling Monitoring Tags:
⚠️ Critical: This step is required even if MTConnect is installed.
- Press CTRL + /// (access Windows)
- Navigate: Programs → Okuma → Okuma MTConnect Adapter Application
- Login:
- Username:
Administrator - Password:
okuma+osp
- Username:
- Click Configuration tab
- Click Tags Configuration button
- Check "Enable Monitoring Tags"
- Select data items to monitor (or select all)
- Click Save & Close
- Restart machine
Part Counting with Common Variables:
If part count doesn't increment automatically:
- Open MTConnect application on Okuma
- Go to "Device Configuration"
- Select common variable (e.g., VC1)
- In CNC program, add near the end:
VC1=VC1+1(increment by 1)VC1=VC1+2(increment by 2)
- Contact MachineMetrics with variable number for configuration match
Default Port: 5000
Accessing Windows: Press CTRL + ///
Hexagon CMMs
Software Required:
- Metrology Connector V7.1 or higher (download from Hexagon Nexus)
- MTConnect Agent — open-source cppagent (GitHub)
- PC-DMIS (optional — only required for program name/cycle data)
License Requirement:
- Advanced entitlement of Metrology Asset Manager (obtained via Nexus account)
- Local Advanced entitlement also supported for non-internet environments
Key Configuration:
- Enable the MTConnect Adapter tab in Metrology Connector Settings → Service and interfaces
- Adapter (inside Metrology Connector) runs on the CMM control PC and feeds the Agent
- MachineMetrics connects to the MTConnect Agent at port 5001
- Agent can run on the same CMM control PC or a separate PC
- Adapter port (typically 7878) must match what is set in
agent.cfg
Data Available:
- CMM status (idle, measuring, alarm)
- Program execution state
- Cycle data
- Measurement events
Documentation:
Zeiss CMMs
Supported Software:
- CALYPSO 7.2 or newer
- PiWeb 8.x or newer
License Requirement:
- Zeiss MTConnect Data Interface license
- 60-day trial available
- Trial Download
Key Configuration:
- Default port: 5000 or 5001
- CALYPSO data path must be configured
- Service runs in background
Data Available:
- Machine status (Idle / Measuring / Alarm)
- Current part program name
- Measurement count
- Cycle time
- Operator ID (if configured)
Best Practices:
- Use static IP for CMM PC
- Schedule weekly service restart via Windows Task Scheduler
- Keep CALYPSO and MTConnect adapter versions in sync
3D Systems DMP 350 Flex
The 3D Systems DMP 350 Flex exposes machine data via a built-in MTConnect Agent running on port 5000. The agent may serve multiple virtual devices (one per printer module) from a single endpoint.
Identifying Your Device UUID
Navigate to http://<agent-ip>:5000/current in a browser. Each DeviceStream element in the response has a uuid attribute — use that value as the device identifier when configuring the connection in MachineMetrics.
Connection String
In MachineMetrics, use the MTConnect Agent connection type with the following connection string format:
<agent-ip>/<device-uuid>
Example: 192.168.1.105/asset_12345-6789A00000001
Adapter Script
Apply the following transform adapter script to derive execution state, surface fault conditions, and extract structured job data from the Build-Job-Data JSON field.
Printer State Reference
| Value | State |
|---|---|
| 1 | Disconnected |
| 31 | Idle |
| 32 | Idle Error |
| 33 | Shutdown |
| 34 | Print Initializing |
| 35 | Printing |
| 36 | Print Finalizing |
| 37 | Print Complete |
| 38 | Print Paused |
| 39 | Print Initializing Error Aborting |
| 40 | Print Initializing Error Aborted |
| 41 | Print Error Aborting |
| 42 | Print Error Aborted |
| 43 | Print Cancel Aborting |
| 44 | Print Cancel Aborted |
| 45 | Maintenance |
# 3D Systems DMP 350 Flex - MTConnect Transform Adapter
# printer_state values documented in table above

version: 2

mtconnect-passthrough: true

# ===== INPUT =====
declare-keys:
  - Printer-State
  - Fault-General-Fault
  - Fault-Blower-Motor
  - Fault-Chiller
  - Fault-Coupling-Safety-Sensor
  - Fault-Invalid-Oxygen-Value
  - Build-Job-Data

deny-keys:
  - Build-Job-Data

# ===== TRANSFORMATION =====
variables:
  execution:
    - state:
        # NOTE: States 34 (Print Initializing) and 36 (Print Finalizing) are
        # included as ACTIVE. Adjust to READY if these should not count as utilization.
        - ACTIVE: Printer-State == 34 or Printer-State == 35 or Printer-State == 36
        - INTERRUPTED: Printer-State == 38 or Printer-State == 39 or Printer-State == 41 or Printer-State == 43
        - READY: true

  job-name:
    - source: Build-Job-Data
    - pattern-match:
        pattern: /\"name\":\"([^\"]+)\"/
        group: 1

  job-id:
    - source: Build-Job-Data
    - pattern-match:
        pattern: /\"job_id\":\"([^\"]+)\"/
        group: 1

  job-material:
    - source: Build-Job-Data
    - pattern-match:
        pattern: /\"material\":\"([^\"]+)\"/
        group: 1

  job-total-layers:
    - source: Build-Job-Data
    - pattern-match:
        pattern: /\"total_layers\":([0-9]+)/
        group: 1

  job-status:
    - source: Build-Job-Data
    - pattern-match:
        pattern: /\"status\":([0-9]+)/
        group: 1

  job-start-time:
    - source: Build-Job-Data
    - pattern-match:
        pattern: /\"start_time\":([0-9]+)/
        group: 1

  job-x-extent:
    - source: Build-Job-Data
    - pattern-match:
        pattern: /\"x_extent\":([0-9.]+)/
        group: 1

  job-y-extent:
    - source: Build-Job-Data
    - pattern-match:
        pattern: /\"y_extent\":([0-9.]+)/
        group: 1

  job-z-extent:
    - source: Build-Job-Data
    - pattern-match:
        pattern: /\"z_extent\":([0-9.]+)/
        group: 1

  job-material-estimate-g:
    - source: Build-Job-Data
    - pattern-match:
        pattern: /\"material_estimate_total\":\[([0-9]+)\]/
        group: 1

  job-material-estimate-vol:
    - source: Build-Job-Data
    - pattern-match:
        pattern: /\"material_estimate_total_volume\":\[([0-9]+)\]/
        group: 1

# ===== OUTPUT =====
data-items:
  - execution
  - job-name
  - job-id
  - job-material
  - job-total-layers
  - job-status
  - job-start-time
  - job-x-extent
  - job-y-extent
  - job-z-extent
  - job-material-estimate-g
  - job-material-estimate-vol

conditions:
  dmp-fault:
    - code: general-fault
      message: "${Fault-General-Fault}"
      value:
        FAULT: Fault-General-Fault != "UNAVAILABLE" and Fault-General-Fault != ""
  dmp-warning:
    - code: blower-motor
      message: Blower motor fault
      value:
        WARNING: Fault-Blower-Motor != "UNAVAILABLE" and Fault-Blower-Motor != ""
    - code: chiller
      message: Chiller fault
      value:
        WARNING: Fault-Chiller != "UNAVAILABLE" and Fault-Chiller != ""
    - code: coupling-safety-sensor
      message: Coater safety coupling tripped
      value:
        WARNING: Fault-Coupling-Safety-Sensor != "UNAVAILABLE" and Fault-Coupling-Safety-Sensor != ""
    - code: invalid-oxygen-value
      message: Invalid oxygen sensor value
      value:
        WARNING: Fault-Invalid-Oxygen-Value != "UNAVAILABLE" and Fault-Invalid-Oxygen-Value != ""
Notes
- Fault conditions — The raw
Fault-*fields pass through viamtconnect-passthroughand can be mapped in Data Mapping. Theconditionsblock surfaces active faults and warnings as MachineMetrics alarm events. - Build-Job-Data — The raw JSON blob is denied from passthrough and replaced by the individual extracted fields listed in the output section above.
- Printer-State — This field arrives as a numeric string. The execution logic compares it as a number.
Other MTConnect Machines
Generic Setup:
- Most MTConnect machines follow similar process
- Verify MTConnect is enabled
- Determine correct port (test with browser)
- Configure static IP
- Add to MachineMetrics using MTConnect adapter type
Common Ports:
- 5000 (most common agent port)
- 8082 (Haas agent port)
- Note: 7878 is typically an adapter port (internal)
If Unsure:
- Contact machine manufacturer
- Contact MachineMetrics support with machine details
- Test endpoint with browser first
Troubleshooting
Jump to: Adapter vs. Agent: Testing Each One · Connection Issues · No Data Appearing · Mazak MTConnect Service Issues · Okuma Issues · Network Problems
Adapter vs. Agent: Testing Each One
MTConnect typically runs as two components, and either one can be the thing you're connecting to:
- Agent — port
5000(or8082on Haas). The HTTP server that serves XML. Often runs on the control, but may run on a separate PC. - Adapter — port
7878. Feeds raw data to the agent. Nine times out of ten the adapter is running directly on the control, even when the agent lives elsewhere — it is frequently the more reliable component to find on the machine itself.
Testing the Agent (ports 5000 / 8082) — Use a Browser
- From a computer on the same network, navigate to
http://<ip-address>:5000(orhttp://<ip-address>:8082for Haas). - Append
/currentto the URL to see live data. - If you see XML, the agent is up.
See demo.mtconnect.org/Mazak/current for an example of a healthy agent response.
Testing the Adapter (port 7878) — Use Telnet or PuTTY
The adapter does not serve a web page — a browser will not work here. Use either of the following:
Option 1: Telnet
telnet <ip-address> 7878
Telnet is disabled by default in Windows. Enable it under Control Panel → Programs and Features → Turn Windows features on or off → check Telnet Client.
Option 2: PuTTY
- Download PuTTY from putty.org (no installation needed).
- Set connection type to Raw.
- Enter the machine IP address and port
7878. - Click Open.
If you can connect to port 7878, MTConnect is very likely installed. If you see machine data on either test, you are good to go.
Connection Issues
Problem: Machine won't connect or test connection fails
Diagnostic Steps:
-
Verify Physical Connection
- Ethernet cable securely connected
- Link lights on network port active
- Cable not damaged
-
Test Network Connectivity
- Ping machine IP from Edge device or computer
- If ping fails: network/routing problem
- If ping succeeds: MTConnect or firewall issue
-
Test MTConnect Endpoint
- Open browser on computer
- Navigate to
http://[machine-ip]:[port]/current - Try different ports: 5000, 7878, 8082
- If XML appears: MTConnect is working, check MachineMetrics configuration
- If no response: MTConnect not running or wrong port
-
Check Firewall
- Windows Firewall on control may block MTConnect port
- Temporarily disable to test (be sure to re-enable)
- Or add firewall rule for MTConnect port
- Common ports to allow: 5000, 7878, 8082
-
Verify MTConnect Service
- Access Services on machine control
- Find MTConnect service
- Verify Status = "Running"
- If stopped: Start the service
No Data Appearing
Problem: Connection succeeds but no data in MachineMetrics
Solutions:
-
Wait for Initial Sync
- Allow 5-10 minutes for first data
- MTConnect polls periodically
- Refresh browser/app
-
Check Machine Status
- Verify machine is powered on
- Machine may need to be in certain mode
- Run a program to generate data
-
Verify Endpoint Returns Data
- Browse to
http://[machine-ip]:[port]/current - Ensure XML contains actual values
- If XML is empty or has no values: MTConnect configuration issue on machine
- Browse to
-
Check Data Mapping
- Assets → Machines → [Your Machine] → Data Mapping
- Verify data items are mapped
- Look for unmapped items
-
Review Edge Logs
- Settings → Edge Devices → Logs
- Look for MTConnect errors or warnings
Mazak MTConnect Service Issues
Problem: Mazak MTConnect service won't stay running after reboot
This is a known issue with older Mazak MTConnect adapters.
Diagnostic Steps:
-
Access Windows on Mazak Control
- Click Start menu
- Type "Run" and press Enter
- Type
CMDand press Enter (opens command prompt)
-
Test MTConnect Locally
- In command window, type:
telnet localhost 7878 - If you see streaming data: MTConnect is running, likely network issue
- If telnet doesn't connect: Service not running
- In command window, type:
-
Check Service Status
- Open Control Panel → Advanced Settings → Component Services
- Find "MTConnect" or "Mazak MTConnect" in services list
- Check if service is running
- If not running: Right-click → Start
-
Verify Again
- Return to command prompt
- Retry telnet test:
telnet localhost 7878 - Should now see data stream
Permanent Fix:
- Contact Mazak dealer and request upgraded MTConnect adapter
- Newer software versions resolve auto-restart issues
- Upgrade recommended for production reliability
Okuma Issues
Problem: MTConnect installed but not reporting data
Check Monitoring Tags:
This is the most common Okuma issue.
- Access Windows (CTRL + ///)
- Open Okuma MTConnect Adapter Application
- Login (Administrator / okuma+osp)
- Configuration tab → Tags Configuration
- Verify "Enable Monitoring Tags" is checked
- If unchecked: Check it, Save & Close, restart machine
Problem: Part count not incrementing
⚠️ CRITICAL FIRST STEP: Verify Machine is Counting Parts
Before troubleshooting MachineMetrics or MTConnect configuration, verify the machine itself is incrementing its internal part counter.
MTConnect (and MachineMetrics) reads the machine's native part counter. If the machine isn't counting parts, MTConnect cannot report them. Without additional configuration, MachineMetrics relies entirely on the machine's internal part count signal provided by MTConnect.
See the Connectivity Validation Guide for a visual guide to identifying healthy vs. problematic part count patterns — including what sporadic counts and sub-second cycle times look like.
Check Machine Part Counter:
- Look at the machine's control screen
- Find the part counter display (varies by machine/control)
- Run a cycle
- Verify the counter increments on the machine itself
If the machine counter is NOT incrementing:
- This is a machine configuration issue, not a MachineMetrics or MTConnect issue
- Machine is not configured to count parts
- For Okuma: See Okuma Part Counting section below
If the machine counter IS incrementing but MachineMetrics shows zero:
- This is a MachineMetrics or MTConnect adapter configuration issue
- Verify MTConnect adapter is reporting the part count
- Access MTConnect stream:
http://[machine-ip]:[port]/current - Look for
<PartCount>or similar data item - If present in MTConnect but not in MachineMetrics: Data mapping issue
Solution for Okuma Machines:
If Okuma part count not incrementing on machine itself, use Common Variables.
See Okuma Part Counting section for detailed setup.
Problem: THINC API too old
Solution:
- Contact Okuma dealer for THINC API update
- Required for OSP 200 and OSP 100-II
- Cannot self-install API update
Problem: Control not compatible
Solution:
- Use Scout tool to verify compatibility
- If not compatible: Use Digital I/O integration instead
- Contact MachineMetrics for alternative methods
Network Problems
Problem: Can access MTConnect locally but not from network
Cause: Firewall blocking MTConnect port
See Also: Network Requirements Guide for Edge device network and firewall requirements.
Solutions:
-
Check Windows Firewall
- On machine control, open Windows Firewall
- Check if MTConnect port (5000, 7878) is blocked
- Add inbound rule to allow port
-
Test from Control First
- On machine, open browser
- Go to
http://localhost:5000/current - If this works but external access doesn't: firewall
-
Create Firewall Rule
- Windows Firewall → Advanced Settings → Inbound Rules
- New Rule → Port → TCP → Specific Port (5000 or 7878)
- Allow the connection
- Apply to all profiles
-
Network Routing
- Verify machine and Edge are on same subnet
- Or proper routing is configured
- Check with IT team if needed
Missing or Unavailable Data Items
Sometimes a machine connects successfully and reports data, but a specific data item you expect is either absent from the stream or shows a value of UNAVAILABLE.
In MTConnect, the individual pieces of information a machine publishes are called data items (each is a DataItem in the agent's structure). A status of UNAVAILABLE means the data item exists in the machine's MTConnect structure — the control is advertising it — but the control is not populating it with an actual value.
MachineMetrics relies on the machine control vendor to output the data items they are supposed to. MachineMetrics reads what the control's MTConnect agent provides; it cannot create a value the control is not supplying.
What to do when a data item is missing or reports UNAVAILABLE:
- Confirm the data item is genuinely expected for that machine and control — not all controls expose every data item.
- Contact the machine tool builder or control manufacturer and ask:
- Is this behavior expected for this machine and control version?
- Do they have a standard data item list to check the machine against?
- Ask whether an MTConnect software update from the builder or control vendor resolves the issue — this is the most common fix.
When a control advertises a data item but does not populate it, the fix is in the hands of the builder or control vendor and is outside MachineMetrics' control to resolve. Contact support@machinemetrics.com if you need help identifying the affected data items or routing the issue to the right party.
Best Practices
Network Configuration:
- Use static IP addresses for all machines
- Document IP addresses and ports
- Keep machine IPs in dedicated range
- Example: 192.168.1.100-199 for machines
MTConnect Service:
- Set services to "Automatic" startup
- Monitor service health periodically
- Keep MTConnect software updated
- Request latest versions from machine manufacturer
Data Quality:
- Verify part counting works correctly
- Map all relevant data items
- Test data accuracy against machine display
- Review data regularly for anomalies
Maintenance:
- Check service status weekly
- Monitor for adapter errors in Edge logs
- Keep machine control software updated
- Document any configuration changes
For CMMs:
- Use static IPs
- Schedule service restarts weekly (Task Scheduler)
- Keep measurement software and MTConnect versions in sync
- Validate XML output against MTConnect schema
Documentation:
- Record machine IPs and ports
- Document MTConnect version installed
- Keep notes on any special configurations
- Maintain list of common variable usage (Okuma)
Security:
- MTConnect uses HTTP (not HTTPS)
- Use dedicated machine network
- Limit access to MTConnect ports
- Don't expose MTConnect to public internet
Additional Resources
MTConnect Institute:
- Official website: www.mtconnect.org
- Standards documentation
- Reference implementations
- Community forums
MTConnect GitHub:
- github.com/mtconnect
- Sample adapters for various machines
- Reference agent implementations
- Tools and utilities
Wikipedia:
- MTConnect Wikipedia Page
- Overview and history
- Industry adoption information
Articles:
OEM Resources:
MachineMetrics Resources:
Getting Help
Jump to: Before Contacting Support · Contact Options
Before Contacting Support
Gather this information:
-
Machine Details
- Make, model, serial number
- Control type and version
- MTConnect version (if known)
-
Network Configuration
- Machine IP address
- MTConnect port
- Can you ping the machine?
- Can you browse to MTConnect endpoint?
-
Test Results
- Browser test result (XML output or error?)
- Local test on control (if Windows-based)
- Telnet test result (for Mazak)
-
Error Details
- Exact error messages
- Screenshots helpful
- When problem started
- What changed recently
Contact Options
MachineMetrics Support:
- Email: support@machinemetrics.com
- Include all information listed above
- Attach screenshots
- Describe troubleshooting steps attempted
Machine Manufacturer:
- For MTConnect installation files
- For software upgrades
- For control-specific questions
- For THINC API updates (Okuma)
Solution Delivery Manager (SDM):
- Configuration guidance
- Deployment planning
- Best practices
MTConnect Institute:
- Protocol questions
- Standards documentation
- Community support
Ready to connect your MTConnect machine?
- Verify MTConnect support
- Enable MTConnect if needed
- Configure network
- Test endpoint in browser
- Add machine in MachineMetrics
- Verify data flow
Questions? Contact support@machinemetrics.com with your machine details.